Market Insights: Monday, December 15th, 2025
Market Overview
US stocks slipped on Monday as investors continued to rotate out of richly valued tech and AI names and into more reasonably priced value and cyclical plays while bracing for a heavy dose of delayed economic data. The S&P 500 and Dow both drifted lower by about 0.1%, while the tech-heavy Nasdaq lagged with a 0.6% decline, extending Friday’s tech-led slide and underscoring how fragile sentiment has become around the crowded AI trade. Concerns about stretched AI expectations and valuations kept pressure on marquee tech names, with ongoing weakness in Broadcom and Oracle reinforcing the idea that investors now want clearer proof that massive AI spending will translate into durable earnings growth. At the same time, many strategists view this rotation as ultimately healthy, signaling a broadening of leadership beyond a narrow group of megacap tech winners and opening the door for other sectors to participate if AI cools. Markets are also digesting the political and policy backdrop as Wall Street leans into the prospect that President Trump’s influence over a reshaped Federal Reserve and his One, Big, Beautiful Bill could deliver a powerful combination of monetary and fiscal support in 2026. This week will put those hopes to the test with a backlog of key releases delayed by the government shutdown, including November’s jobs report on Tuesday, an inflation print on Thursday, and an update on October retail sales that will shape views on whether the Fed is close to done cutting rates. Looming over the entire discussion is the question of who will replace Jerome Powell when his term ends in May, with Kevin Hassett still seen as the frontrunner and Kevin Warsh also in the mix; both are viewed as more sympathetic to Trump’s push for lower rates, even as they stress formal policy independence. On the corporate front, the AI wobble was joined by a stark reminder of competitive pressures as iRobot shares collapsed after the Roomba maker filed for bankruptcy, citing intense competition from lower-cost Chinese rivals and the drag from tariff battles. Overall, Monday’s tape reflected a market that remains broadly constructive heading into the last full trading week of 2025 but is now more cautious, more rotational, and increasingly dependent on upcoming economic data and policy decisions to justify further gains.
SPY Performance
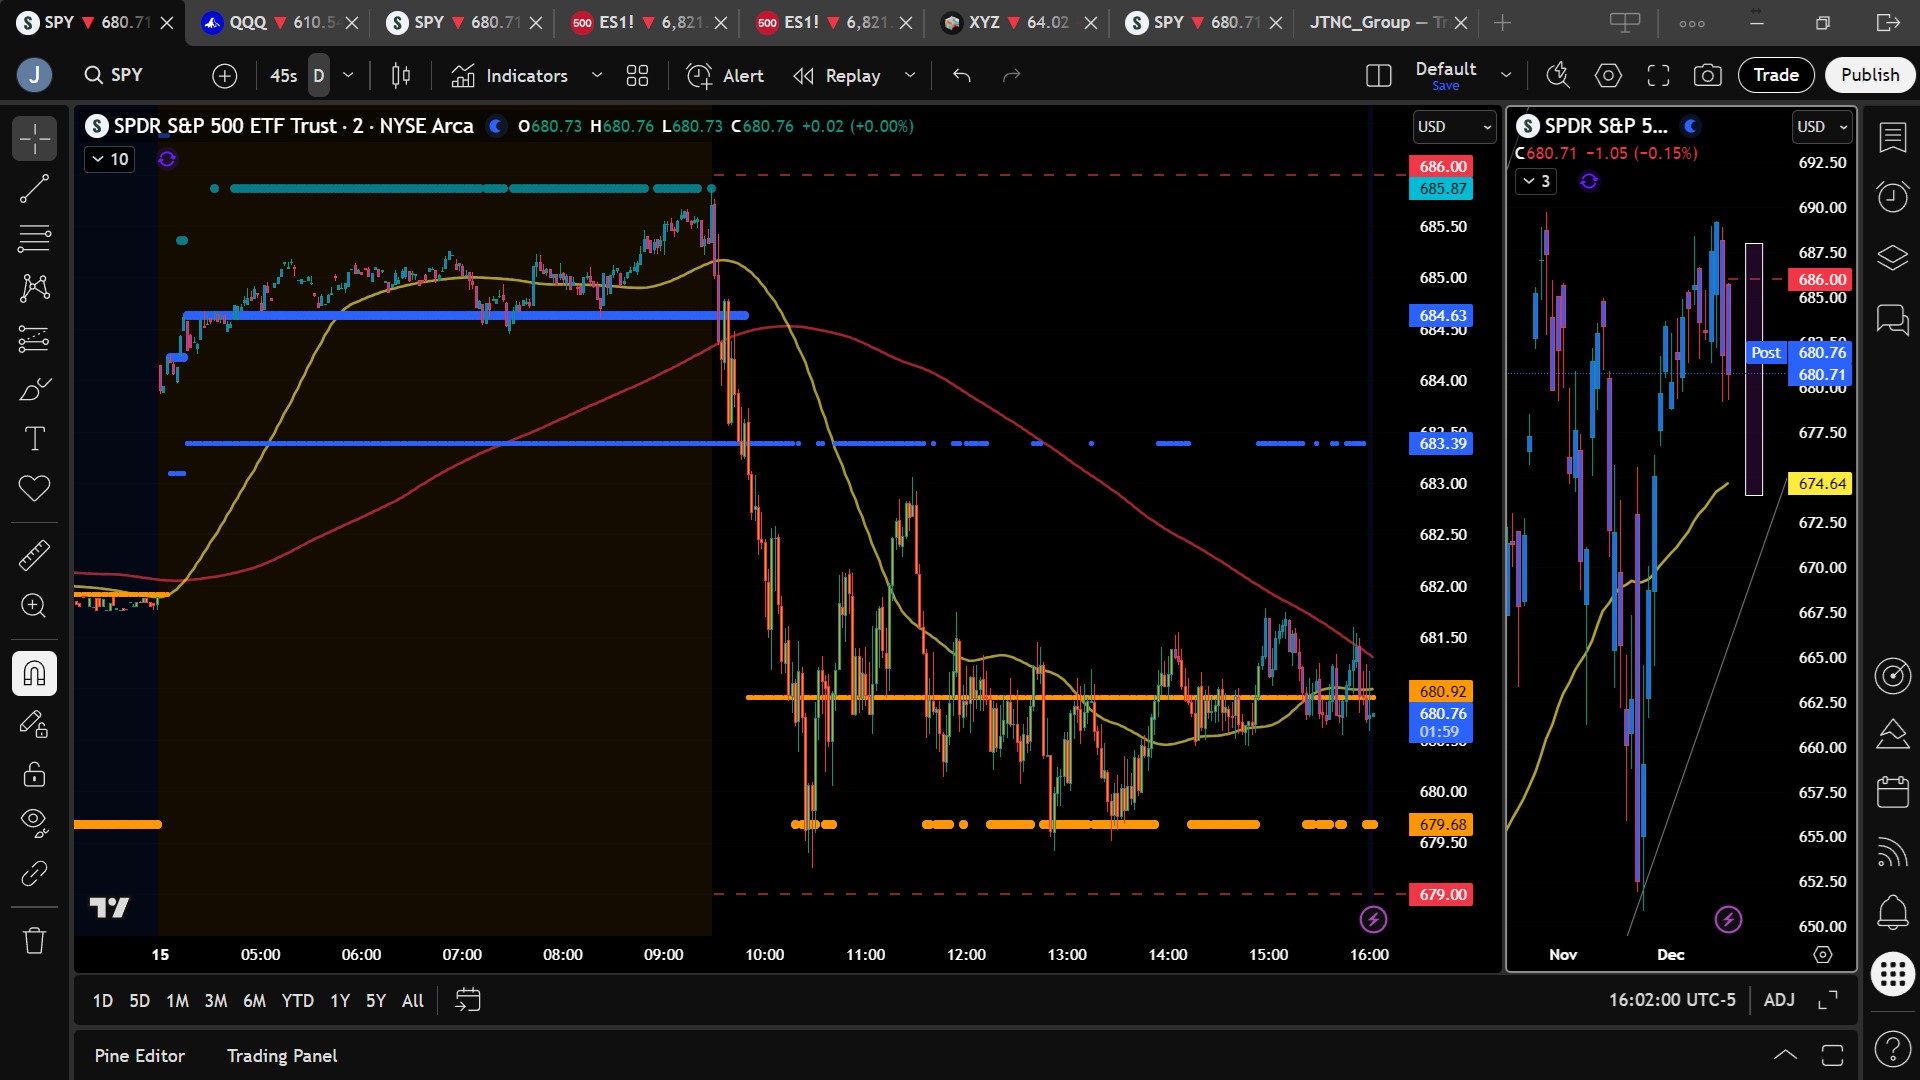
SPY spent Monday grinding lower within a relatively narrow but important range, opening at $685.68, ticking up to an intraday high of $685.75 almost immediately, and then fading steadily to an intraday low of $679.26 before recovering slightly to close at $680.71, down 0.15% on the day. Volume reached 84.69 million shares, above average and another sign that the recent weakness is accompanied by meaningful repositioning rather than apathy. The quick failure near the open above the key $685 bias level and the subsequent slide toward the well-watched $680 area reinforced the idea that bulls no longer have unchallenged control. Price tested the $680 zone multiple times during the session, with each defense becoming a little less convincing and highlighting how repeated probes of support can gradually drain liquidity. The close below $685 and just above $680 keeps SPY locked inside the $675–$685 battleground we have been highlighting, with bulls still holding the longer-term edge but bears now dictating the short-term tone.
Major Indices Performance
Across the major indices, Monday’s action mirrored the pattern of recent sessions but with a slightly more muted tone. The Dow slipped 0.09%, giving back only a sliver of its recent gains thanks to its relatively lighter tech exposure. The S&P 500 fell 0.15% alongside SPY’s modest dip, while the Nasdaq led the downside once again with a 0.59% loss, weighed by continued de-risking in high-valuation tech and AI names. The Russell 2000 dropped 0.79%, reflecting lingering concerns about smaller-cap earnings leverage and sensitivity to the economic cycle. The weakness aligned with the ongoing rotation out of the most crowded AI and megacap trades and into more diversified value and cyclical exposure, consistent with the notion that the market is trying to broaden leadership even as headline indices hover not far from recent highs. Despite the softness in equities, the broader macro backdrop remains relatively constructive, with Treasury yields easing slightly and volatility still contained, suggesting investors are adjusting exposures rather than abandoning risk altogether.
Notable Stock Movements
It was another predominantly red session across the Magnificent Seven, but under the surface there were a few notable standouts. Most of the group traded lower in sympathy with the broader tech and AI unwind, yet Meta and NVIDIA managed to hold in better, and Tesla led the upside with a strong 3.54% gain. Tesla’s outperformance helped offset some of the pressure elsewhere in the group and underscored that investors are still willing to back select growth names when they see compelling narratives around execution, innovation, or future earnings power. On the downside, Broadcom continued to slide following its recent earnings update, as investors reassessed AI-related revenue visibility and margins, while Oracle remained under pressure amid concerns about delayed data-center buildouts and how quickly AI demand will translate into realized revenue. Outside of tech, the most dramatic move came from iRobot, whose shares collapsed after the Roomba maker filed for bankruptcy, a stark illustration of how intense global competition and tariff-related pressures can overwhelm even a well-known consumer brand. Taken together, Monday’s leadership mix reinforced the idea that the market is in a sorting phase, rewarding stories with clearer paths to growth and punishing those that depend too heavily on vague or distant AI promises.
Commodity and Cryptocurrency Updates
Commodities and crypto delivered another mixed read on risk sentiment and macro expectations. Crude oil fell 1.29% to $56.50, slipping back toward the key $56 level that our model has been flagging as the critical line between a constructive basing pattern and a deeper correction. We have been calling for crude to drift toward $60 for several months, and while Monday’s move leaves open the possibility of further downside, the broader view remains that if oil can hold above $56, a rally back toward $60 and potentially $70 is still on the table, especially if global demand remains resilient and supply discipline holds. Gold inched higher by 0.09% to around $4,332, staying firmly near record territory and underscoring continued demand for hedges against policy missteps, inflation surprises, and geopolitical risk even as equities remain relatively elevated. Bitcoin, by contrast, fell 3.11% and closed just above $85,600, extending its recent pullback. That decline aligns with the broader cooling in speculative risk appetite and the tech/AI unwind, but the crypto benchmark is still holding well above prior consolidation zones, suggesting that while momentum has slowed, the longer-term uptrend has not yet broken.
Treasury Yield Information
The 10-year Treasury yield edged lower by 0.33% to close near 4.181%, offering a modest tailwind to risk assets even as equities struggled to gain traction. In our framework, yields below 4.5% remain broadly supportive for stocks, but as the 10-year approaches 4.8%, pressure tends to build under the surface, and a sustained move above 5% historically signals more serious trouble for risk assets. At 5.2%, our model suggests the probability of a 20% or greater equity correction rises meaningfully, making that level a critical line in the sand. Monday’s small dip in yields, coming alongside weakness in tech and AI, reinforced the idea that the recent pullback in equities is driven more by positioning and valuation concerns than by a sudden deterioration in the rate backdrop. For now, the rate environment remains workable for risk assets, but with a heavy economic calendar ahead, any upside surprise in jobs or inflation could reignite concerns about how many more cuts the Fed can deliver in 2026, which would quickly feed back into both yields and equity multiples.
Previous Day’s Forecast Analysis
In Friday’s newsletter, our model projected SPY’s maximum range for Monday between $676 and $690, highlighting the potential for a more directional session with periods of chop driven by Put-side dominance in the options landscape. We framed the $675–$685 band as the primary battleground, noting that the longer-term trend remained bullish above $640 but that the near-term edge was starting to tilt toward the bears after Friday’s sharp selloff from new highs. The roadmap emphasized that bulls needed to reclaim and hold above $685 to reassert control and open the door for another push toward $689–$690, while a failure to hold above the mid-$680s and, in particular, a break below $680 would signal that bears were gaining momentum and could press price toward $678, $676, and potentially $675 or lower. Our preferred strategy coming into Monday called for cautious long attempts near support above $680, combined with openness to tactical shorts on failed bounces into the $685–$690 resistance band given the growing signs of fatigue in the AI trade and the rising importance of that overhead supply zone.
Market Performance vs. Forecast
Monday’s actual price action largely validated the structural framework from Friday’s forecast while underscoring just how important the $680 and $685 levels have become. SPY opened at $685.68, effectively right on the bias level and near the lower edge of our previously highlighted resistance zone, and briefly ticked to $685.75 before rolling over. Rather than grinding higher toward $689–$690, price quickly slipped below $685 and spent most of the session pressing down toward the $680 region, ultimately tagging a low of $679.26 before recovering slightly to close at $680.71. That intraday pattern confirmed the idea that bounces into the mid-$680s would likely attract sellers and that bulls were losing the ability to sustain trade above $685. At the same time, the day’s low remained comfortably within the forecasted $676–$690 range and held just above the more critical $675 threshold, keeping the broader bull trend intact even as the near-term tone weakened. Traders who respected the framework around $680 as the dividing line between bullish control and growing bearish momentum had clear cues: the failure above $685 suggested de-risking or tactical shorts, while the repeated defenses of $680 signaled that aggressive shorts should be quick to lock in gains near support.
Premarket Analysis Summary
In Monday’s premarket report, published at 7:05 AM with SPY trading around $685.14, we set the bias level at $685 and outlined a balanced but cautious roadmap. On the upside, we highlighted targets at $686 and $689, with the expectation that if SPY could stay above $685, the path of least resistance would remain higher, albeit with fading momentum as price climbed away from support. On the downside, we flagged $685, $681.50, $680, and $679 as key levels to watch in the event that the bias failed, and we emphasized that while we did not see strong appetite for an aggressive selloff, the tape suggested fragile attempts to keep the uptrend alive rather than a powerful new leg higher. Our tactical lean favored long entries only from clearly defined support or strong rallies that confirmed buyers were still willing to defend key levels, while warning that any sustained trade below $685 would likely invite a test of the $681.50–$680 zone before meaningful dip-buying interest would reappear.
Validation of the Analysis
Intraday price action aligned closely with the premarket roadmap, particularly around the bias and support levels. After a brief attempt to hold above $685 at the open, SPY failed to sustain trade over the bias and quickly rolled over, triggering the downside path toward the support cluster we outlined. Price moved down through $681.50 and into the $680 zone, where buyers stepped in multiple times, defending that level on three separate occasions and confirming its importance as the first line of defense for the bulls. Each bounce off $680 was relatively shallow and ultimately failed to recapture the $685 bias level, with the best attempt stalling around $683 before price drifted back down into the low $680s. This behavior matched our expectation of “fragile attempts to keep upward momentum alive” and highlighted why we preferred long entries only from well-defined support and why we were skeptical of sustained progress much beyond $686–$689. The fact that the session’s extremes hugged the premarket levels so closely reinforced the usefulness of those levels for framing intraday trade selection and risk management.
Looking Ahead
Looking ahead to Tuesday and the rest of the week, the macro calendar transitions from quiet to intense and will likely determine whether SPY can finally break out of the $675–$685 range. Tuesday brings a packed slate of releases, including ADP, Average Hourly Earnings, Core Retail Sales, Non-Farm Employment Change, headline Retail Sales, the Unemployment Rate, and both Flash Manufacturing and Flash Services readings. These data points will provide a comprehensive snapshot of labor market strength, consumer demand, and the health of both the goods and services sectors just as investors are trying to gauge how much room the Fed has left to cut rates in 2026. Wednesday is quiet with no scheduled releases, but Thursday brings another major test with CPI and Unemployment Claims, followed by Friday’s Final GDP and Core PCE prints. Together, these reports will either reinforce or challenge the narrative that Trump’s policy agenda and a more dovish Fed can support robust growth and earnings without reigniting inflation pressures. With SPY stuck in a tight range and leadership rotating, the market is primed for a break in one direction or the other, and this week’s data will likely be the catalyst that decides whether the next significant move is a renewed leg higher or a deeper corrective phase.
Market Sentiment and Key Levels
After Monday’s session, sentiment sits in a delicate balance between a still-intact longer-term uptrend and a near-term environment that increasingly favors the bears. SPY’s close at $680.71 leaves price trapped between the key $675–$685 boundaries, with bulls no longer able to maintain control above $685 and bears still unable to force a decisive break below $675. The broader uptrend remains bullish above $640, but repeated failures at and above $685 combined with persistent tests of $680 suggest that the easy phase of the rally has faded. For Tuesday, we see resistance at $683, $686, $689, and $690, with the $686–$690 band continuing to act as a heavy lid due to stacked resistance and overhead options positioning. On the downside, support sits at $679, $677, $675, and $670, with $680 and $675 serving as critical checkpoints for whether the market is simply consolidating or starting to transition into a more meaningful correction. A sustained push back above $685–$686 would tilt the field back toward the bulls and open the door for another run at $689–$690, while a clean break below $675 could accelerate selling toward $670 and possibly $660 as stop-losses trigger and dip buyers step back.
Expected Price Action
Our AI model currently projects SPY’s maximum range for Tuesday between $674 and $688, a slightly lower and narrower band than Monday’s but still wide enough to support trending moves with intermittent periods of chop. The options landscape continues to show Put-side dominance across a broad spectrum of strikes, which generally aligns with more directional price action as hedging flows amplify moves in either direction. As long as SPY holds above the $680 region and can reclaim $683–$686, we expect attempts to push toward $689–$690, though any progress into that zone is likely to be slow and choppy given the heavy resistance overhead and the market’s recent struggle to sustain trade over $685. If SPY loses $680 with conviction, a slide toward $677 and then $675 becomes the base case, with $670 coming into play if selling pressure intensifies, especially around key data releases. Traders should be prepared for volatility spikes around Tuesday’s economic prints and should prioritize reacting to how SPY behaves at the key levels rather than trying to front-run the data.
Trading Strategy
Given the current backdrop of elevated but not extreme volatility and a market that is stuck between well-defined support and resistance, our preferred approach remains to stay tactically nimble with a slight bullish bias that is contingent on holding key support zones. For long setups, we favor entries on failed breakdowns that quickly reclaim levels near $680, $679, or $677, with clear invalidation if SPY breaks and holds below $675. Upside targets for these longs sit at $683, $686, and then $689–$690, with partial profit-taking recommended at each level and trailing stops used to protect gains as price moves higher. For traders open to short exposure, failed bounces into $683–$686 or deeper pushes toward $689–$690 provide attractive locations to initiate tactical shorts with downside targets at $680, $677, and $675, while remembering that short trades remain countertrend in the context of the larger bull market. The VIX climbed 5.15% to 16.55 but remains within a neutral, risk-on zone, which favors defined-risk option strategies and disciplined trade management rather than oversized directional bets. In this environment, smaller position sizes, tighter stops, and a willingness to step aside during the most chaotic moments around major data releases are key to preserving capital and taking advantage of the best opportunities.
Model’s Projected Range
SPY’s projected maximum range for Tuesday is between $674 and $688, with the Put side dominating in a wide band that signals trending price action with intermittent trending periods. The market moved slightly lower today with SPY falling 0.15% to close at $680.71 on higher than average volume, finishing below the key $685 level where bulls assume full control. Bulls and bears are now engaged in a battle for dominance, with the longer-term edge still favoring the bulls but the near-term edge shifting to the bears. Price is likely to remain trapped between $675 and $685 until an external catalyst forces a breakout. Overnight SPY moved higher and reached $685.87 in the premarket before selling off shortly after the open. Price then moved almost straight down until reaching major support at $680 midmorning, where bulls stepped in and defended the level three separate times. Repeated tests of support drain liquidity, and it remains unclear whether the next test will be the one that breaks lower, especially given how often $680 has already been tested. A midafternoon bounce from $680 pushed price up to $683 before failing once again, and SPY then drifted back toward $681 where it remained into the close. While this bounce limited further downside, today’s price action does not support a Santa Rally, particularly given the decline occurred on higher volume. Overnight the bulls must hold above $680 to attempt another move back toward $685. If $680 breaks, SPY may slide to $677, with $675 likely next and $670 in play if selling pressure accelerates. As noted on Friday, $680 remains the critical line separating bull control from rising bearish momentum, and that dynamic remains firmly in place. Resistance for Tuesday sits at $683, $686, $689, and $690, while support rests at $679, $677, $675, and $670. Gains above $686 are likely capped by heavy resistance, while a break below $670 could quickly send price toward $660. The broader trend remains bullish above $640, though the bulls’ advantage continues to narrow. For Tuesday we prefer longs near support above $680 only on failed breakdowns that recover quickly, and we will also watch closely for short opportunities near $685. Crypto fell sharply today and MAG stocks were mixed, and while the market is likely to continue higher until clear weakness appears in these leadership groups, the signals are becoming less supportive. The VIX rose 5.15% to 16.55 but remains in neutral, risk-on territory. Traders should stay flexible with a mild bullish bias while exercising caution near the highs, as confidence in a Santa Rally has softened even though a few red days do not invalidate the broader upward trend.
Market State Indicator (MSI) Forecast
Current Market State Overview:
The MSI ended the session in a Bearish Trending Market State with SPY closing at MSI resistance. There were no extended targets throughout the regular session or into the close, although extended targets did print overnight in the premarket above the highs. Overnight, the MSI rescaled to a narrow bullish state with extended targets, which allowed price to retest $685 before failing right at the open. Shortly after the open, the MSI shifted to a wide ranging state and then transitioned into a bearish state, where it remained from late morning into the close, with SPY oscillating between ranging and bearish states. With no extended targets and a wide ranging state dominating, the MSI forecast a sideways to down session, which is exactly what the market delivered. Participation remained light, and with the herd absent, although volume was elevated and the dip to $680 was once again bought. For Tuesday, the MSI is projecting sideways to lower prices, with support at $679.68 and resistance at $680.93.
Key Levels and Market Movements:
On Friday we stated, “If the bulls do hold $680, they will look for another attempt to clear $685 in pursuit of new closing highs which is likely to be sold on the first and second attempts,” and noted, “Crypto and most MAG stocks fell today, reflecting a bit more indecision that could weigh on equities,” while also adding, “favor the bulls slightly on Monday as long as price stays above $680.” With this context, and with the MSI in a narrow bullish state in the premarket at $685, we waited at the open for a clean short once extended targets stopped printing. The $685 level was identified as a short on the first or second test in Friday’s newsletter. At 9:32 am we entered short at $684.50 at MSI resistance and set T1 at MSI support at $683.43. After T1 was secured, we set T2 at the premarket level of $681.50, which was also hit quickly. With two targets in hand, we moved our stop to breakeven and trailed the remaining 10%, looking for a possible exit near $680. The MSI rescaled lower but without extended targets, suggesting limited downside, and when a clean failed breakdown appeared we exited and reversed long at $679.75. We set T1 at the premarket level of $681.50, which was hit, and then set T2 at MSI resistance at $683.40. Price came close to that second target, but a textbook failed breakout signaled exhaustion, so we exited the trade and called it a day. We closed T2 and our runner at $682.50 going two for two thanks to having a clear plan, maintaining patience and discipline, and staying aligned with MSI signals, market structure, and our broader trading framework. The MSI continues to prove its reliability as the cornerstone of our trading process.
Trading Strategy Based on MSI:
Tuesday has economic news that could move the market. Absent an external catalyst, a repeat of today is likely, with sideways to down price action and limited movement. The bulls must defend $680 on any overnight retest or the bears will press lower. If $680 holds, the bulls will attempt another push toward $685, but that level is again likely to be sold. If $680 fails, SPY likely drops to $677 and then $675, and a break of $675 brings $670 into play. Crypto and most MAG stocks fell today, showing renewed indecision that could weigh on equities. The long-term bull trend remains intact above $640, so we slightly favor the bulls on Tuesday as long as price holds above $680. If $680 fails and does not recover quickly, we favor shorts below that level or on low-volume bounces back into $680. Any first, and possibly second, test of $685 also remains a strong short candidate. As always, stay alert to macro risks and be prepared to trade what you see in the coming days. Failed breakouts and failed breakdowns continue to offer the highest-probability setups, so remain flexible, avoid trading during Ranging Market States, and ensure all trades are fully aligned with MSI signals. Providing real-time insights into market control, momentum shifts, and actionable levels, the MSI when integrated with our Pre-Market and Post-Market Reports continues to sharpen execution precision and elevate trade quality. If you haven’t yet integrated MSI and our model levels into your process, now is the time. Contact your representative to get started as these tools are designed to support consistency and enhance performance.
Dealer Positioning Analysis
Summary of Current Dealer Positioning:
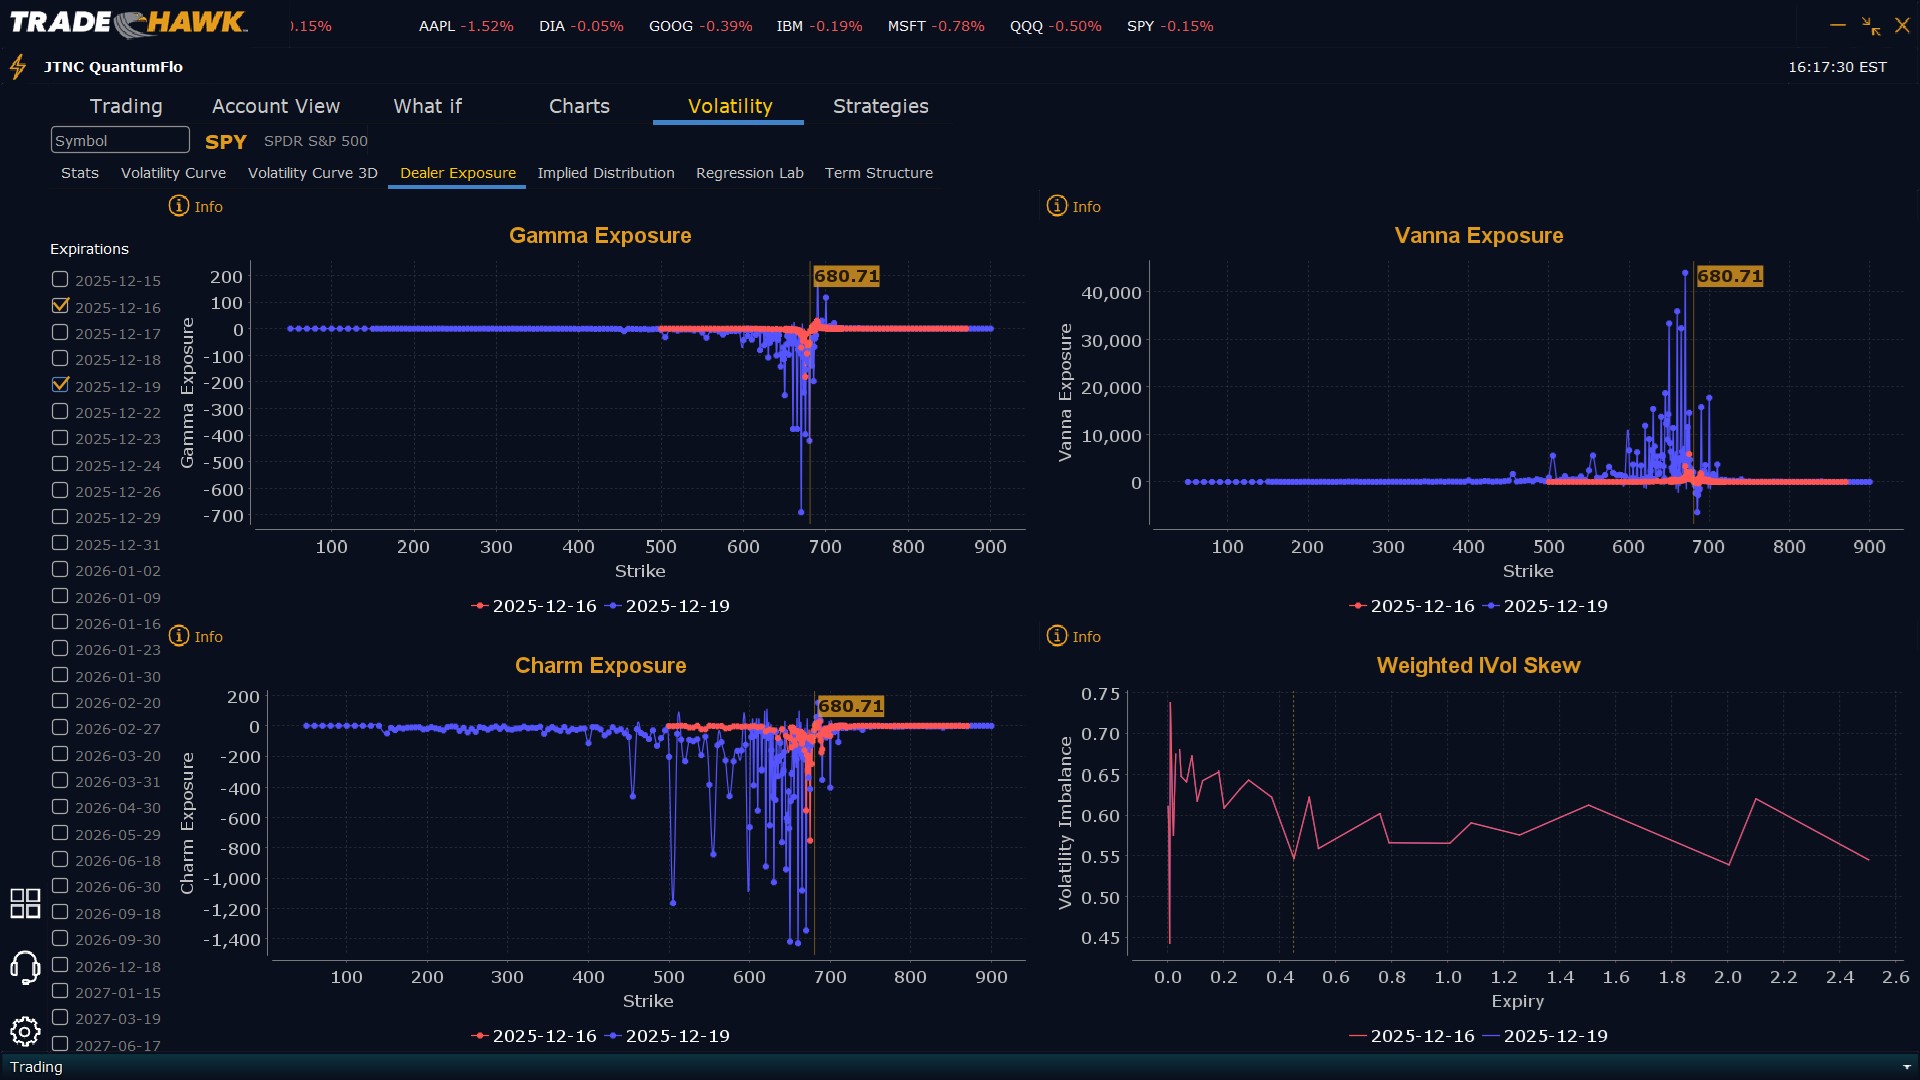
Dealers are selling SPY $685 to $710 and higher strike Calls while buying $681 to $684 Calls indicating the Dealers’ desire to participate in any relief rally on Tuesday. The ceiling for tomorrow appears to be $689. To the downside, Dealers are buying $680 to $565 and lower strike Puts in a 3:1 ratio to the Calls they’re selling/buying displaying little concern that prices could move significantly lower on Tuesday. Dealer positioning is unchanged from neutral/slightly bearish to neutral/slightly bearish.
Looking Ahead to Friday:
Dealers are selling SPY $686 to $720 and higher strike Calls while buying $681 to $686 Calls indicating the Dealers’ desire to participate in any relief rally this week. The ceiling for the week appears to be $700 although $690 is a major hurdle. To the downside, Dealers are buying $680 to $565 and lower strike Puts in a 5:1 ratio to the Calls they’re selling/buying, reflecting a market that is showing some concern about lower prices. For the week Dealer positioning is unchanged from bearish to bearish. We advise reviewing Dealer positioning daily for directional clues. These positions evolve quickly and tracking them is essential for staying ahead of shifting market sentiment.
Recommendation for Traders
Into Tuesday, we suggest continuing to treat the $675–$685 band as the primary decision zone and building your game plan around how SPY behaves at those levels, especially as key economic data hit the tape. On the long side, look for measured entries if price stabilizes above $680 and begins reclaiming $683–$686, with upside targets at $689 and $690 and a willingness to trail stops higher as those levels are tested and as the data confirm or refute the bullish macro narrative. On the short side, focus on failed bounces into $683–$686 or any spikes toward $689–$690 rather than chasing weakness lower; use $680, $677, and $675 as logical downside targets and stay alert for signs that buyers are stepping in aggressively near those levels, which would be a cue to reduce or exit short exposure. With VIX around 16.55, volatility remains contained but not complacent, favoring defined-risk strategies, disciplined profit-taking, and respect for stop-losses over attempts to swing for home runs. As we move into a week packed with key data releases, make sure to review the premarket analysis posted before 9 AM ET each day for updated model levels, MSI signals, and Dealer positioning that could materially influence the intraday playbook. Trade what you see, stay flexible, and let the market’s behavior around the key levels guide your decisions.
Good luck and good trading!
