Market Insights: Friday, December 12th, 2025
Market Overview
US stocks finally hit the brakes on Friday, with a sharp rotation out of tech putting pressure on the major indices and capping what turned into a rough week for growth and AI names. The Nasdaq led the slide with a 1.6% loss, continuing its tech-heavy slump, while the S&P 500 dropped about 1% after briefly breaking above the 6,900 level for the first time earlier in the week. The Dow, with less tech exposure, slipped a milder 0.5% but still managed to end the week up around 1%, bucking the broader weakness. Rising Treasury yields added to the risk-off tone as the 10-year moved above 4.18% and the 30-year climbed past 4.85%, pressuring high-valuation sectors. Under the surface, investors were clearly rethinking the AI trade: Broadcom followed Oracle in disappointing Wall Street on forward AI visibility and margins, and despite an earnings beat, AVGO sank more than 10% as investors questioned how quickly the massive AI spend will translate into durable profits. That reassessment drove money toward more cyclical, value-oriented stocks that tend to benefit from economic strength and lower rates, aligning with the Fed’s third rate cut of the year and growing optimism around US growth. The rate cuts continued to support gold, which tagged another record and is now on track for its best year since 1979, underscoring persistent demand for safety even as equities hover near highs. On the policy front, President Trump signaled that Kevin Hassett is currently the frontrunner to replace Jerome Powell when his term ends in May, with Kevin Warsh also under serious consideration, keeping next year’s monetary policy outlook firmly in the spotlight. Corporate headlines added another twist as Lululemon shares surged more than 9% after the company announced CEO Calvin McDonald will step down at the end of January following a stretch of softer sales, a move markets interpreted as a reset that could unlock better execution going forward. Overall, Friday’s tape reflected a market still broadly bullish but now rotating and repricing where future growth is most likely to come from.
SPY Performance
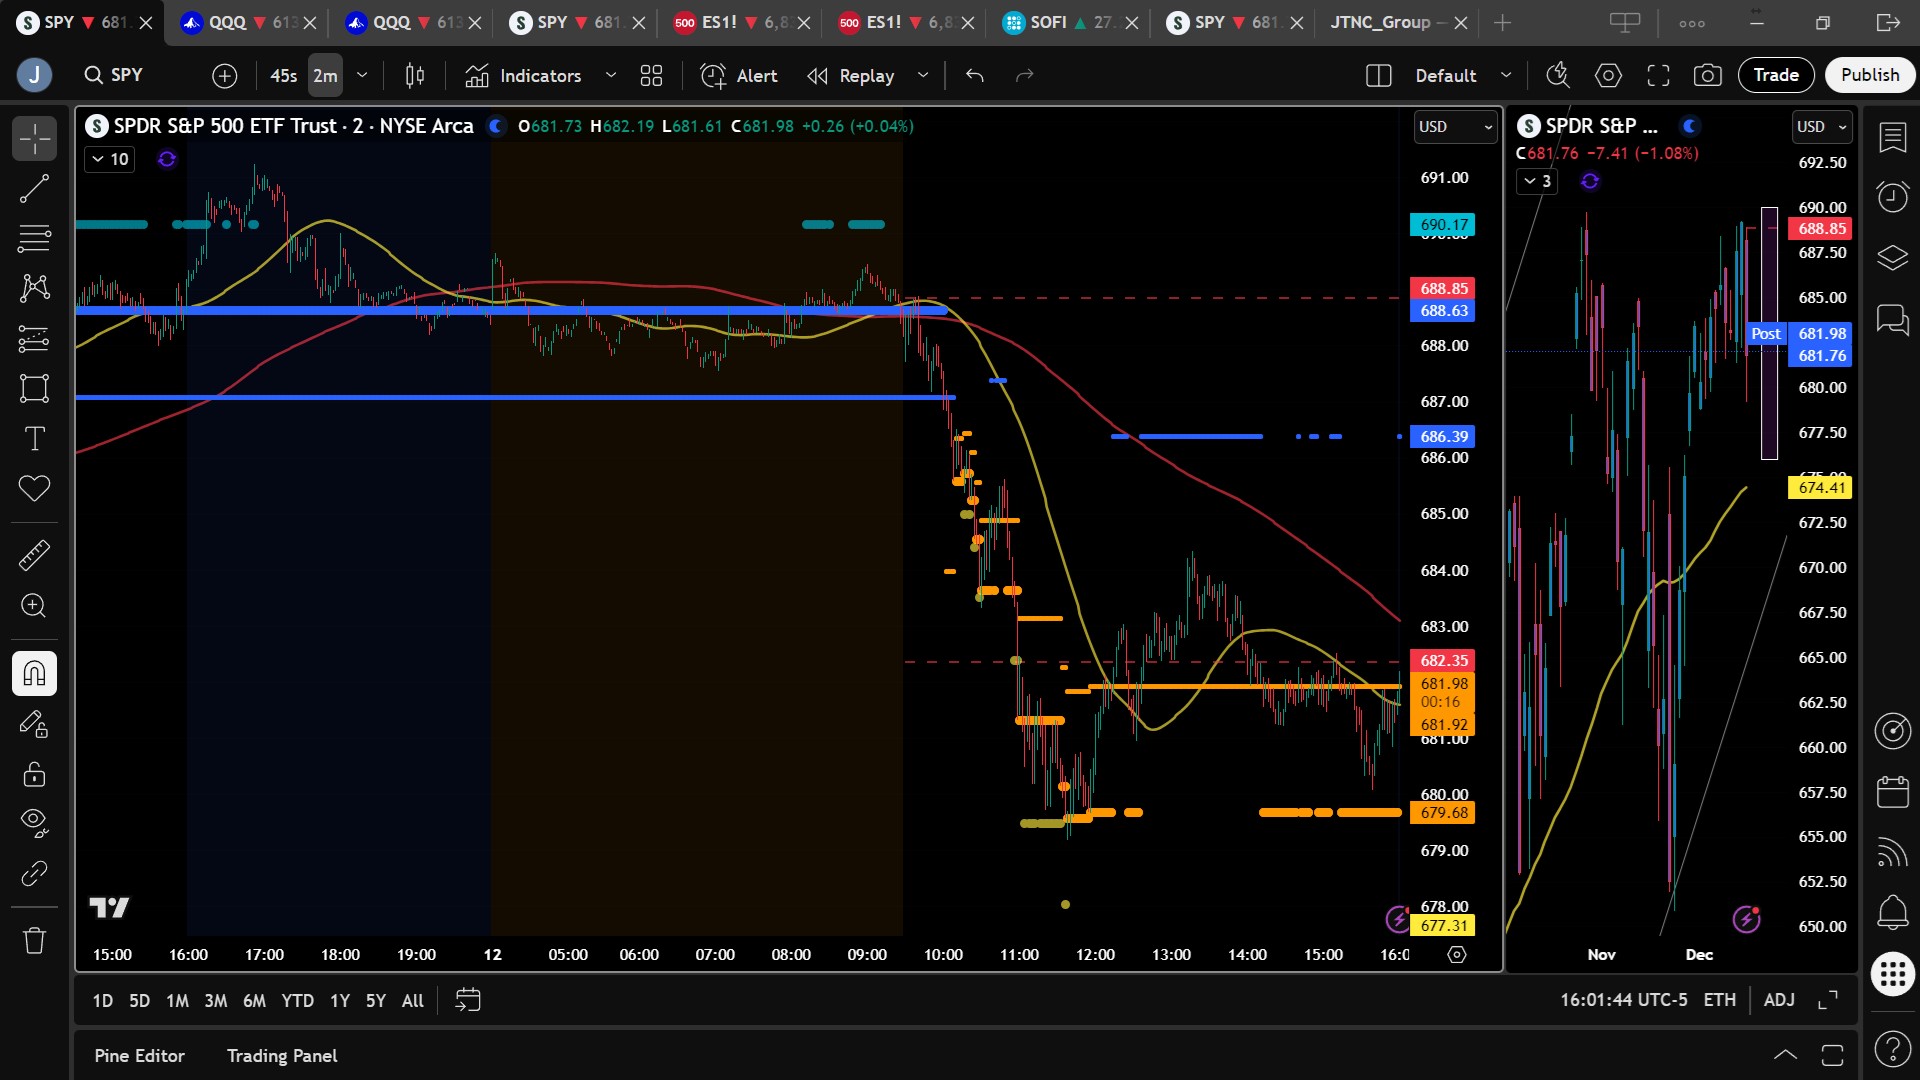
SPY had a tough session, opening at $688.18 after tagging new highs overnight, briefly pushing to $688.88, and then getting sold hard down to $679.17 before recovering a bit to close at $681.72, down 1.08% on the day. Trading volume swelled to 99.76 million shares, well above average and a clear sign that Friday’s move was not just noise; participants were actively repositioning after a week dominated by AI optimism and then AI doubt. The failure to hold above the widely watched $685 area, which had been the line in the sand for bullish control, marked a notable shift in tone and put the $675–$685 zone back into play as the primary battleground. While bulls did manage to defend the $679–$680 area intraday, the close below prior support suggests a more two-sided environment heading into next week, with both dip buyers and aggressive sellers now willing to engage around the same levels.
Major Indices Performance
Among the major indices, the Dow held up best with a 0.51% pullback, giving back only a small slice of its recent gains after setting new records earlier in the week. The S&P 500 fell 1.08% and slipped away from its recent milestone above 6,900, while the Russell 2000 dropped 1.62% and the Nasdaq lagged with a 1.69% decline as tech bore the brunt of the selling. The weakness lined up with the unwind in AI enthusiasm after Broadcom and Oracle failed to deliver the clean AI story investors were hoping for, while concerns about stretched tech valuations resurfaced. At the same time, the broader macro backdrop remains constructive: the Fed’s third rate cut of the year, decent growth expectations, and a still-manageable volatility backdrop are helping value and cyclical names attract fresh capital. Crude oil slipped 0.16% to $57.51, staying above the key $56 level that our model has been flagging as the pivot for a potential move back toward $60 and possibly $70 if demand holds. Gold added another 0.43% to close near $4,331, staying firmly in breakout territory, while Bitcoin dropped 2.97% but maintained a close above $90,100, showing that risk appetite in crypto is cooling but not collapsing.
Notable Stock Movements
It was one of the most broadly red days we’ve seen recently across the Magnificent Seven, with most names trading lower in sympathy with the AI and megacap tech unwind. The big standout on the upside was Tesla, which climbed 2.70% and led the group higher, helped by renewed enthusiasm around EV demand and ongoing optimism about its AI and autonomy ambitions. Apple and Netflix also managed to finish green, signaling that not all growth leadership is breaking at once and that investors are still willing to own select megacaps with strong balance sheets and clear earnings visibility. The rest of the group traded lower, reflecting a more skeptical stance toward the richest valuations and the most AI-dependent narratives. Outside the core leaders, Broadcom’s post-earnings slide underscored just how unforgiving the tape has become when the market doesn’t get the AI clarity it wants, while Oracle’s earlier selloff continued to weigh on broader software and infrastructure names. Lululemon’s double-digit pop stood out as a clear idiosyncratic winner, driven by the CEO transition announcement and hopes for a sharper strategic focus after a period of disappointing sales performance.
Commodity and Cryptocurrency Updates
Commodities and crypto sent a mixed but telling signal about risk appetite and macro expectations. Crude oil slipped modestly by 0.16% to $57.51, and while that’s a small move, it keeps price locked in a critical zone. Our model has been calling for a drift toward $60 for some time, and so far the action is consistent: as long as crude stays above $56, the path toward $60 and perhaps even a push toward $70 remains on the table, especially if growth data stays firm and OPEC discipline holds. Gold firmed 0.43% to close near $4,331, reinforcing the idea that investors are still hedging against policy missteps and macro surprises despite the broader equity rally. This combination, steady to stronger gold and only mildly weaker crude, fits a market that is rebalancing rather than panicking. Bitcoin, on the other hand, dropped 2.97% but still closed above the important $90,100 area. That pullback aligns with the broader de-risking out of speculative growth and some profit-taking after a strong crypto run, but the fact that it held a big round-number handle suggests the uptrend in digital assets is not yet broken.
Treasury Yield Information
The 10-year Treasury yield ticked higher by 1.11% to close around 4.190%, continuing the recent bounce off the lows and reminding equity traders that the rate backdrop can shift quickly. In our framework, yields below 4.5% remain broadly supportive for stocks, but once the 10-year starts grinding toward 4.8%, pressure builds under the surface, and a move to 5% or above has historically been where real trouble begins for risk assets. At 5.2%, our model suggests the probability of a 20% or greater equity correction rises meaningfully, so this threshold remains a key risk marker to watch. Friday’s move up in yields, combined with the selloff in higher-duration assets like tech and AI, fit neatly with that narrative: as funding costs edge higher and discount rates move up, markets become less forgiving of lofty multiples and stories that are all promise and little near-term cash flow. For now, the rate environment is still workable for equities, but the direction of travel in yields will be an important driver of whether dips continue to be bought or start turning into deeper, more persistent pullbacks.
Previous Day’s Forecast Analysis
In Thursday’s newsletter, we highlighted that SPY had broken out following the FOMC and that bulls were firmly in control as long as price stayed above the $682–$683 band, with $686 flagged as the key level to hold to “all but guarantee” new all-time highs on Friday. The expected trading range for Friday was framed primarily between $686 and $690, with a potential extension toward $694–$695 if resistance gave way. We emphasized that dips into $683 or $680 were likely to be bought and that a clean break above $690 could open the door to the upper resistance cluster, while only a decisive move below $680 would meaningfully tilt the field back toward the bears. The trading strategy leaned bullish, preferring long setups from support in the $683–$685 zone with tight risk below $680 and suggesting that tactical shorts near $690–$691 should be considered only if momentum clearly faded. Overall, the prior day’s roadmap called for a consolidating but upward-biased session, with the primary assumption that the bulls would defend the recently claimed levels and potentially push SPY into or beyond the all-time high area.
Market Performance vs. Forecast
Friday’s actual tape diverged from that bullish roadmap in a few important ways. SPY opened at $688.18, right in the middle of the expected $686–$690 consolidation band and quickly tagged an intraday high of $688.88, which was just shy of the first upside target region and consistent with the idea that the market might attempt another push higher. However, instead of grinding up toward $694–$695, price rolled over and broke below both $686 and $683, ultimately flushing down to a low of $679.17 before stabilizing and closing at $681.72. That close sat below the key $683–$685 support zone we highlighted and below the $680 line where we had said bears would start to gain momentum. The projected maximum range for Monday of $683 to $694 from Thursday’s model was clearly exceeded to the downside, showing that while the upper resistance cluster near $690–$695 remained intact, sellers were more aggressive than anticipated once SPY lost the bias level. Long entries taken near $683–$685 offered little follow-through and required quick risk management, while traders who respected the “break below $680 opens the door lower” framework had an early signal that the character of the tape had shifted. The day reinforced why those downside levels matter so much: once broken, they can rapidly flip what looks like a controlled consolidation into a meaningful test of lower support.
Premarket Analysis Summary
In today’s premarket analysis posted at 7:12 AM, SPY was trading around $687.85, and we framed the session as one likely to start with consolidation against a still broadly bullish backdrop. The bias level was set at $686.35, with the view that as long as SPY held above that line, the path of least resistance remained higher and long setups at defined support levels made sense. Upside targets were laid out at $688.85 and $691.30, while downside targets were set at $686.35, $684.85, $683.85, and $682.35 in the event that the bias level was lost. The core expectation was that strength and sustained trade above $686.35 could push SPY toward the upper targets, but that a stall near an upper target, especially if combined with a loss of the bias level would likely trigger a consolidation phase back into the mid-$680s. We explicitly noted that conditions did not suggest a major collapse and that we were not eager to be overly aggressive on the short side, preferring to buy dips into support as long as those levels appeared to hold and to treat any downside move as controlled digestion rather than the start of a trend reversal.
Validation of the Analysis
The market’s actual behavior did a good job of validating the key structure from the premarket blueprint, even though the eventual downside extension went a bit further than the base case. After the open, SPY moved up into the $688–$689 region and effectively tagged the first upside target near $688.85 before stalling, exactly the kind of behavior we flagged as a warning that consolidation might begin. From there, price rolled over and cleanly lost the $686.35 bias level, kicking off a sustained move lower that sliced through the next downside targets at $684.85 and $683.85 and moved into the $682.35 area. While the analysis suggested that the decline would likely remain relatively shallow, the slide continued a bit beyond our final premarket level, ultimately touching $679.17 before buyers stepped in. Even so, the roadmap around the bias level and the initial target structure worked well: traders watching for a stall near the upper target had a high-quality short or risk-off inflection, and those respecting the bias level saw that once $686.35 failed, the focus shifted from buying every dip to respecting the emerging downside momentum. The fact that price interacted meaningfully with nearly every premarket level underscores the value of those levels for intraday decision-making.
Looking Ahead
As we look ahead to Monday’s session and the coming week, the macro calendar shifts from quiet to busy in a hurry. Monday itself has no scheduled economic releases, which means price action is likely to be driven by technical levels, dealer positioning, and any weekend headlines rather than fresh data. Tuesday, however, is stacked: ADP, Average Hourly Earnings, Core Retail Sales, Non-Farm Employment Change, headline Retail Sales, the Unemployment Rate, and both Flash Manufacturing and Flash Services readings all hit the tape. That cluster of data will give the market a comprehensive read on the labor market, consumer strength, and the underlying health of both the goods and services sides of the economy. With the Fed already having delivered three rate cuts this year, traders will be watching closely for any signs that growth is either re-accelerating in a way that might put upward pressure on inflation or softening enough to raise recession concerns. Later in the week, CPIs and Unemployment Claims on Thursday and the Final GDP and Core PCE prints on Friday will round out the picture. The takeaway is simple: after a technically driven, rotation-heavy week, the next leg of the move, up or down, is likely to be heavily influenced by how these data points shape expectations for the 2026 policy path and earnings trajectory.
Market Sentiment and Key Levels
After Friday’s action, the market’s tone has shifted from “bulls firmly in control” to “bulls still ahead, but now under pressure.” SPY’s close at $681.72 puts it back in the middle of the $675–$685 battleground zone we’ve been highlighting, and the break back below $685 means the bears have re-entered the conversation in a meaningful way. The broader trend remains bullish above $640, but the easy phase of the Santa Rally has clearly cooled. For now, we see key resistance at $685, $689, $690, and $692, with that upper band around $690–$692 still acting as a heavy lid due to stacked resistance and prior failed attempts to sustain trade above it. On the downside, support sits at $680, $678, $676, and $675, with $680 acting as the first line of defense the bulls will want to reclaim and hold early next week to reassert control. A sustained push back above $685 would suggest Friday’s selloff was more shakeout than shift, potentially opening the door for another run at $690–$692, while a decisive break below $675 could usher in a faster slide toward $670 and even $665 as sellers press their advantage. With a big macro week on deck, sentiment can swing quickly, so traders should treat these levels as primary pivots for intraday and swing decision-making.
Expected Price Action
Our AI model’s actionable intelligence currently projects SPY’s maximum range for Monday between $676 and $690, a relatively wide band that points to the potential for trending price action with pockets of choppy trade. The options landscape shows Put-side dominance across a broad swath of strikes, which typically aligns with more directional movement and the possibility of sharper intraday swings as hedging flows kick in. The bias is modestly bullish as long as SPY can hold the $680 area and reclaim $685, but Friday’s loss of those levels means that bears now have real room to operate on failed bounces. If SPY can push back above $685 and sustain trade there, we expect a grind toward $689–$690, where gains may stall again given the heavy resistance and overhead options positioning. A clean breakout through $690 would put $692 and then $695 back on the radar, though we would expect progress above $690 to be slower and choppier than earlier in the rally. On the downside, if SPY loses $680 with conviction, we look for a move toward $678 and then $676, with $675 as the key line where a deeper correction could accelerate toward $670. Traders should be prepared for volatility spikes around next week’s major economic releases and consider trimming size or tightening risk around those time windows, focusing instead on reacting to how SPY behaves at the key levels rather than pre-guessing the data.
Trading Strategy
Given the shift in tone and the elevated but not extreme volatility backdrop, our preferred approach is to stay tactically nimble while leaning slightly bullish as long as SPY holds the mid-$670s. For long setups, we like entries near support zones at $680, $678, and $676, with clear invalidation if SPY breaks and holds below $675. Upside targets for these longs sit at $685, $689, and $690, with partial profit-taking recommended as each level is tested and stop-losses trailed higher to lock in gains. For traders comfortable with short exposure, failed bounces into $685 or $689–$690 offer reasonable spots to initiate tactical shorts with downside targets at $680, $678, and $676, while remembering that short trades tend to be lower probability in a market that is still in a larger bull trend. VIX closed near 15.80, which is still a relatively low, risk-on level that supports option-selling and mean-reversion strategies but also warns that if volatility spikes, it can do so from a compressed base and move quickly. In this kind of environment, we favor smaller position sizes, tight stop-losses around clearly defined levels, and a willingness to step aside during the most chaotic moments around major data releases. Let the market show its hand at the key levels and trade what you see, not what you hope.
Model’s Projected Range
SPY’s projected maximum range for Monday is between $676 and $690, with the Put side dominating in a wide band that signals trending price action with periods of chop. The market moved sharply lower after reaching new highs in the overnight session as the AI trade stalled or began to unwind following weak Oracle earnings and a delay in GPT data center rollout, with rising debt levels adding to concern. SPY closed down 1.08% at $681.76, again below the key $685 level where bulls assume complete control. Bears are back in the mix and the $675 to $685 zone will likely be the main battleground. Overnight SPY reached new highs above $690 but quickly pulled back, opening at $688.85 before selling off. The Oracle news accelerated the decline and SPY dropped to $679.17 before buyers stepped in. The bounce limited further damage, but the action does not support confidence in a Santa Rally, and significantly higher-than-average volume reinforced the weakness. Bulls want to keep price above $680 overnight to attempt a move back toward $685. If $680 breaks, SPY may fall to $678, and below that $675 becomes likely with the potential for $665 if the decline continues. Yesterday we noted that $680 is the line that determines whether bulls can maintain control or bears gain momentum, and that remains true heading into next week. Resistance levels are at $685, $689, $690, and $692, while support lies at $680, $678, $676, and $675. Gains above $690 should be limited due to heavy resistance, and a break below $675 could send price toward $670 with little difficulty. The broader trend stays bullish above $640, though the bulls’ advantage is narrowing. For Monday we prefer long positions near support above $680 while watching for short opportunities near $685. Crypto declined along with most MAG stocks except Netflix, Tesla, and Apple, and the market is likely to rise until clear weakness appears in these two groups. The VIX rose 6.40% to 15.80 but remains in neutral, risk-on territory. Traders should stay flexible with a mild bullish bias while noting caution near the highs, and although confidence in a Santa Rally has softened, one down day does not derail the broader trend, which still points to higher prices.
Market State Indicator (MSI) Forecast
Current Market State Overview:
The MSI ended the session in a Bearish Trending Market State with SPY closing at MSI resistance. There were no extended targets at the close, though they did print during the decline that began shortly after the open. Overnight, the MSI held its bullish state with extended targets that corresponded to new intraday highs, but by 6 pm these targets stopped printing and price pulled back to MSI support. A brief premarket pop produced new extended targets, but they also stopped before the open, after which the MSI began a rapid series of rescalings lower with extended targets until price reached the day’s lows. A few minor rescalings higher followed, though the MSI remained bearish, and eventually it settled into the current ranging state that persisted through the entire afternoon until the close when price fell once again with the MSI ending the day in a bearish state. For Monday, the MSI is projecting sideways to lower prices, with support at $679.68 and resistance at $681.93.
Key Levels and Market Movements:
On Thursday we stated, “Friday will likely bring new all-time highs with SPY pushing toward $695,” and noted, “The bulls will defend $686 overnight, and if that level fails, they want the dip held at $683,” while adding, “If $683 breaks, the bears will try to press lower.” With this context, and with the MSI in a narrow bullish ranging state in the premarket and at the open, we waited for a clean long entry off MSI support. We thought we had one at $687.25 but waited for a slightly lower price to give our first target at $688.85 more than the $1 minimum we always seek. Because price had reached all-time highs overnight and failed to hold, we chose to be more cautious than usual since recent highs have often led to quick selloffs. That caution proved helpful as price dropped sharply. We wanted to see $686 hold per our plan, and when it did not, we shifted to the next level at $683 and entered short at MSI resistance at $686.35 with T1 at MSI support at $685.25. After T1 filled, we set T2 at the next MSI level at $684.57. With both targets hit we moved our stop to breakeven and trailed, expecting a move to $683. SPY reached $683.28 and then formed a failed breakdown, so we closed the short and waited for another entry. We considered a long, but MSI extended targets kept us out of taking a long trade. A quick pop suggested selling might be over, but the Oracle news sent the market into a fast decline. We entered another short at MSI resistance at $684.90 and set T1 at $683.60. Once that filled, we set T2 at $681.33, which hit quickly. With our stop at breakeven and extended targets still printing, we held until a textbook failed breakdown near the lows and with no more extended targets, we exited the trade and ended the trading day before noon going two for two as the perfect ending to a strong week, thanks once again to having a clear plan, maintaining patience and discipline, and staying aligned with MSI signals, market structure, and our broader trading framework. The MSI continues to prove its reliability as the cornerstone of our trading process.
Trading Strategy Based on MSI:
Monday is likely to set the tone for next week’s action. The bulls need to keep price above $680 on any overnight retest; if they cannot, the bears will press lower. If the bulls do hold $680, they will look for another attempt to clear $685 in pursuit of new closing highs which is likely to be sold on the first and second attempts. There is no scheduled news to drive markets on Monday, though weekend macro risks can always shape the open, so trade what you see and use the MSI for guidance. If $680 fails, SPY likely drops to $678 and then $675, and a break of $675 puts $670 into play. Crypto and most MAG stocks fell today, reflecting a bit more indecision that could weigh on equities. The long-term bull trend remains intact above $640, so we continue to favor the bulls slightly on Monday as long as price stays above $680. If $680 fails and does not recover quickly, we favor shorts below that level or on any low-volume bounce back into $680. As always, stay alert to macro risks and be prepared to trade what you see in the coming days. Failed breakouts and failed breakdowns continue to offer the highest-probability setups, so remain flexible, avoid trading during Ranging Market States, and ensure all trades are fully aligned with MSI signals. Providing real-time insights into market control, momentum shifts, and actionable levels, the MSI when integrated with our Pre-Market and Post-Market Reports continues to sharpen execution precision and elevate trade quality. If you haven’t yet integrated MSI and our model levels into your process, now is the time. Contact your representative to get started as these tools are designed to support consistency and enhance performance.
Dealer Positioning Analysis

Summary of Current Dealer Positioning:
Dealers are selling SPY $689 to $710 and higher strike Calls while buying $682 to $688 Calls indicating the Dealers’ desire to participate in any relief rally on Monday. The ceiling for Monday appears to be $690. To the downside, Dealers are buying $681 to $565 and lower strike Puts in a 3:1 ratio to the Calls they’re selling/buying displaying little concern that prices could move significantly lower on Monday. Dealer positioning is unchanged from neutral/slightly bearish to neutral/slightly bearish.
Looking Ahead to Next Friday:
Dealers are selling SPY $689 to $720 and higher strike Calls while buying $682 to $688 Calls indicating the Dealers’ desire to participate in any relief rally next week. The ceiling for the week appears to be $700 although $690 is a major hurdle to overcome. To the downside, Dealers are buying $681 to $565 and lower strike Puts in a 5:1 ratio to the Calls they’re selling/buying, reflecting a market that is showing some concern about lower prices. For the week Dealer positioning has changed from slightly bearish to bearish. We advise reviewing Dealer positioning daily for directional clues. These positions evolve quickly and tracking them is essential for staying ahead of shifting market sentiment.
Recommendation for Traders
Into Monday, we suggest treating the $675–$685 band as the main decision zone and building your plans around how SPY behaves there. On the long side, look for measured entries if price stabilizes above $680 and starts reclaiming $683–$685, with upside targets at $689 and $690 and a willingness to trail stops higher as those levels are tested. On the short side, focus on failed bounces into $685 or $689–$690 rather than chasing weakness lower; use $680, $678, and $676 as logical downside targets and avoid overstaying if buyers step in near those levels. With VIX around 15.80, volatility is still relatively subdued, which favors defined-risk strategies and disciplined profit-taking rather than swinging for home runs. Keep position sizes moderate, respect your stops, and be especially mindful of how the market reacts around Tuesday’s heavy data slate, as those releases can quickly shift both direction and intraday volatility. Before the bell each day, make sure to review the premarket analysis posted before 9 AM ET to capture any updates to the model’s outlook and Dealer positioning that could affect your game plan.
Good luck and good trading!
