
Market Insights: Thursday, November 5th, 2026
Market Overview
Wall Street's post-election party turned into a brutal hangover Thursday as AI and chip stocks collapsed, wiping out every bit of Wednesday's rally. The Dow tumbled 3.4%, or more than 1,800 points, the S&P 500 fell 4.4%, and the Nasdaq dropped 5.5% to close in correction territory. The PHLX Semiconductor index plummeted 12% as Nvidia (NVDA), Micron (MU), and AMD (AMD) took the brunt of the beating, while large-cap tech suffered its worst day since the COVID-19 sell-off. SpaceX (SPCX) and Tesla (TSLA) also plummeted. Investors are still digesting the Democrats' sweeping victory on Tuesday. There's relief that election uncertainty is gone, but the market is still sorting out who wins and who loses under the new regime on Capitol Hill, and regulatory concerns weighed heavily on AI data center buildout plays. The bigger story, though, is a full-blown shakeout. Institutional investors dumped 2026's best performers to lock in gains before year-end, and Nomura's Charlie McElligott put it bluntly: "They're shooting the generals." He called the unwind of this year's thematic stocks "wildly acute" for more than a month, driven by hedge funds racing to protect profits rather than any sudden hit to fundamentals. "Single-name stock moves are absolutely BONKERS," he wrote, adding that "the Momentum/High Sharpe unwind has been so substantial that we are approaching the dreaded 'Round Trip' levels in some trades." Over the past month, Lam Research (LRCX) is down 36%, Applied Materials (AMAT) has shed 30%, and AMD and Nvidia are off 22% and 15%, respectively. Retail investors didn't buy the dip this time either. Vanda Research said everyday investors sold a net $358 million in individual US stocks as of 2:58 p.m. ET, on track for their biggest selling day since March 17, 2020, when they pulled $502 million. "This is what we would call a total capitulation by retail investors," said Vanda's Viraj Patel, who saw "no signs of buying the dip" outside of leveraged ETFs like the ProShares UltraPro QQQ (TQQQ) and Direxion Daily Semiconductor Bull 3X Shares (SOXL). He also pointed to a broader institutional "buyers' strike" alongside forced selling by systematic and leveraged strategies.
Oil bounced back as traders questioned whether President Trump will actually pursue a deal with Iran to end the Middle East war. Optimism had built overnight after Vice President JD Vance posted on X that "The reason we lost [the midterm elections] is the war," hinting the party should push for a resolution, but uncertainty won out, with Brent trading around $98 per barrel and WTI at $90. On the economic front, Challenger, Gray & Christmas reported October layoff plans fell to their lowest level since 2023 as companies focused on holding onto workers, setting the stage for Friday's key jobs report. Duke Energy (DUK), Airbnb (ABNB), and Lumentum (LITE) headlined the earnings calendar. Meanwhile, Goldman Sachs (GS) named 109 new partners, its largest class since 2010 and nearly 15% bigger than 2024's group of 95, with 60 coming from investment banking and trading, 33 from Asset & Wealth Management, and 13 engineers. Breaking from past years, a Goldman executive declined to share the class's gender and racial makeup, citing changes in the legal environment, though the firm now has more than 100 female partners.
SPY Performance
SPY opened at $765.47, a slight dip from yesterday's close of $766.81. That small gap down turned out to be the only gentle moment of the day. Buyers managed a feeble push to a session high of $765.97, barely above the open and nowhere near yesterday's high of $769.22. From there it was a one-way trip lower. SPY sliced through today's first line of support at $762.64, filled the gap at $757.07, and then blew right past the deeper support at $752.41 like it wasn't even there. The selling never let up, and SPY dropped to a session low of $732.71 before finishing at $733.15, closing just a hair above the bottom of the day.
SPY lost 4.39%, a brutal reversal that erased yesterday's breakout and then some. Yesterday the low came early and never got retested. Today the high came early and never got retested. That flip tells you everything about who was in control. A close almost exactly at the session low is about as bearish as a candle gets, because it means sellers were still pressing at the final bell with no sign of buyers stepping in. Volume made it worse. Turnover exploded to 105.45 million shares, well above average and nearly double yesterday's already solid number. This wasn't a quiet drift lower. It was heavy, aggressive liquidation. The fear gauge confirmed the panic. The VIX rocketed 62.49% to close at 26.99, wiping out yesterday's plunge and launching right back above the 20 level we had been so happy to see it break. Traders scrambled to buy protection at any price.
The bears took the wheel today, and they floored it. We said a slide back under $757.07 would turn the breakout into a fakeout, and that's exactly what happened, only far faster and deeper than anyone expected. Today's low of $732.71 is now the only support that matters in the short term, and with SPY closing right on top of it, a break below would signal more pain ahead. On the upside, the broken levels flip into resistance. $752.41 is the first hurdle for any bounce, followed by $757.07 and $762.64 above that. Reclaiming those would take serious buying power that simply wasn't there today. The mix of a close at the lows, huge volume, and a VIX near 27 makes today clearly bearish. Oversold bounces can come quickly after a drop like this, but until buyers prove they can hold a level, rallies are suspect. Yesterday the bulls patched the crack, and today the whole wall came down.
Major Indices Performance
The Dow held up best in a brutal session, but "best" is relative when the index still dropped 3.44%. Just one day after leading a powerful rally, blue chips gave back every bit of that gain and then some as sellers hit nearly every corner of the market. Crude reversed hard to the upside, reviving the same energy-cost worries that had eased so quickly the session before. Industrials and transportation-heavy names felt that pressure, but the Dow's tilt toward steadier, cash-rich companies kept the damage below what the rest of the board suffered. When fear spikes this fast, investors tend to hide in established names, and the Dow got a small dose of that protection.
The Russell 2000 came in second with a 4.49% decline, abruptly ending its three-session winning streak. Small-caps had been one of the most reliable groups on the board, but that kind of steady buying can unwind quickly when sentiment flips. Smaller domestic companies are more exposed to rising energy prices and tighter financial conditions, so the jump in oil hit them twice as hard after giving them a lift just a day earlier. The fact that small-caps fell harder than the Dow shows investors weren't just trimming risk. They were stepping back from the riskier end of the market altogether.
The Nasdaq took the worst beating with a steep 5.52% loss, wiping out its two-day recovery in a single session. Heavy selling in megacap tech dragged the index down, and when the market's biggest leaders crack together, there's nowhere for tech-heavy portfolios to hide. The S&P 500 landed between the Dow and the Russell 2000, with losses spread across nearly every sector. The VIX exploded 62.49% to close at 26.99, rocketing back above the key 20 level and erasing the calm that had built up just one day earlier. A move that big in fear tells you traders are scrambling for protection, not calmly rebalancing. With Average Hourly Earnings, Non-Farm Employment Change, and the Unemployment Rate all hitting Friday morning, the jobs report now carries a lot of weight. A soft number could fuel a relief bounce, but a hot one could pile more pressure on an already shaken market.
Notable Stock Movements
Tesla led the Magnificent Seven in the wrong direction, and this was no ordinary stumble. The electric vehicle maker cratered 10.77%, a double-digit wipeout that dwarfs the losses it posted in each of the last two sessions. That makes three straight days in the red for Tesla, and the weakness we flagged last time has now turned into a full-blown breakdown. When a stock that size drops that hard, it isn't just a few nervous sellers. Big money is heading for the exits, and Tesla's slide is becoming one of the clearest warning signs in the market right now.
The group flipped to a mostly red day, ending the two-session winning streak that had investors feeling better about big tech. Just one session ago, Microsoft was leading a broad rally and confidence in the heavyweights looked like it was firming up. Today that confidence got tested hard. The concern we raised about Tesla and NVIDIA dragging on the group's momentum played out faster and more violently than expected, with the selling spreading well beyond those two names. When the market's most trusted leaders fall together, it usually means investors are trimming risk across the board rather than reacting to problems at any one company.
The damage reached every corner of the market. The Nasdaq plunged 5.52%, taking the worst of the beating, while the Russell 2000 tumbled 4.49% and the Dow sank 3.44%. That's the exact reverse of last session's broad rally, and tech getting hit hardest shows just how much the Magnificent Seven weighed on the market. Bitcoin also dropped 5.61%, so speculative assets felt the pain right alongside the big tech names. The VIX exploded 62.49% to 26.99, jumping back above that key 20 level it had only just broken below and signaling that fear has come roaring back. Friday brings the jobs report at 8:30 AM ET, and with nerves this frayed, the numbers could set off big moves in either direction. If Tesla can find a floor and the rest of the group stabilizes, big tech has a chance to regain its footing. But if the selling keeps spreading through the heavyweights, this could turn into a deeper pullback for the whole market.
Commodity and Cryptocurrency Updates
Crude oil bounced back, gaining 3.00% to close at $90.76. That recovers a chunk of the prior session's steep drop and pushes the black gold back above $90, a sign that buyers weren't ready to let the geopolitical risk premium fully unwind. Crude rallied even as the broader market went into full risk-off mode, which shows supply concerns and geopolitical tensions are still the main forces driving energy prices. Crude remains well above $70 and continues to defy longer-term model expectations, so the supply disruption story isn't going away anytime soon. Friday's jobs report could stir up demand worries if the labor market shows cracks, but supply headlines will likely remain in control. A sustained move this far above $70 keeps inflationary pressure in play and could complicate Fed policy if energy prices stay elevated.
Gold kept climbing, adding 0.93% to close at $4,111. That makes it two straight gains and builds a cushion above the key $4,000 level that bulls fought hard to reclaim. The yellow metal finally acted like a true safe haven, holding its ground while stocks and crypto got slammed in a wave of heavy selling. Inflation uncertainty, steady central bank buying, and ongoing geopolitical tensions continue to support the long-term case. Pulling further away from $4,000 strengthens the argument that the recent dip was a flush rather than the start of a deeper correction. Friday's jobs data and inflation expectations readings could spark some volatility, but as long as gold holds above $4,000, bulls stay firmly in charge.
Bitcoin got crushed, tumbling 5.61% to close below $75,895. That snaps its two-day winning streak and drags the crypto back under the $80,000 psychological level it had just reclaimed. The sharp drop lined up perfectly with the market-wide risk-off move and the jump in fear, once again showing Bitcoin trades like a high-beta risk asset rather than a safe haven. Losing $80,000 this quickly undercuts the recovery story and puts the recent base-building effort in doubt. With the jobs report on deck Friday, Bitcoin will likely stay at the mercy of the broader risk tone. A quick move back above $80,000 would ease the damage, while continued weakness would put the downtrend firmly back in play.
Treasury Yield Information
The 10-year Treasury yield fell 1.16% today to close at 4.840, its second straight decline and another step back from the 5% line. This time the drop didn't help stocks at all. Yesterday falling yields fueled a rally, but today bonds caught a classic flight-to-safety bid as investors dumped risk and piled into Treasuries. When yields fall because money is running for cover rather than because inflation fears are cooling, it's a warning sign, not a green light.
Against each threshold, the 10-year kept improving. The 4.5% level where equity valuations start to feel the squeeze sits 34 basis points below today's close, and the 4.8% mark that usually triggers broader selling is now just 4 basis points away, so the 10-year is right on the doorstep of escaping the selloff zone. The 5% serious-risk flag has 16 basis points of cushion, up from 11 yesterday, and the gap to 5.2%, where the framework calls for a 20% or greater correction, widened to 36 basis points.
Equities ignored the relief completely. The Nasdaq cratered 5.52%, the Russell 2000 sank 4.49%, and the Dow gave back 3.44%, erasing yesterday's rally and then some. That disconnect shows rates weren't the driver today. Fear was, and the VIX exploded 62.49% to 26.99. Gold edged up 0.93% to $4,111, consistent with a defensive tone. Crude worked against the bond rally, climbing 3.00% to $90.76. Rising oil keeps inflation expectations sticky, which could limit how far yields can fall once the panic fades.
Friday is the big test, with Average Hourly Earnings, Non-Farm Employment Change, and the Unemployment Rate at 8:30 AM ET, followed by Prelim UoM Consumer Sentiment and Prelim UoM Inflation Expectations at 10:00 AM ET. A soft jobs print could finally push the 10-year below 4.8%, though in this environment that may read as growth worries rather than good news for stocks. A hot wage number would be the bigger danger, potentially snapping yields back toward 4.95% and putting the 5% threat back in play while equities are already on the ropes.
Previous Day’s Forecast Analysis
Our AI model projected SPY's maximum range for Thursday at $762 to $774, with the Call side dominating an expanding band. That setup pointed to trending price action with intermittent chop. After Wednesday's powerful rally broke SPY out of its recent box, the model noted price was sitting just below the middle of the projected range and holding above first support at $765. That gave us a bullish bias heading into the session. The forecast also highlighted the VIX dropping 19.59% to 16.75, a sharp collapse in fear that put buyers firmly in control. Unemployment Claims at 8:30 AM ET was flagged as unlikely to move the market, so positioning and momentum were expected to drive the action.
The key battleground was the $765 to $770 zone. $770 was the first resistance and a major round number bulls needed to clear, with $772, the $774 range top, and $775 and $778 sitting above. On the downside, losing $765 was expected to send price toward $763 and then $759, with the lowest support at $755. A break of $755 risked a quick slide toward $750. The bigger picture remained healthy, with structural support near $640 and the long-term bull trend intact.
The favored trade was buying a dip into $765 that held, targeting $770 and $772, with runners toward $774 and stops below $762 or tighter under $763. A clean break above $770 called for buying the retest rather than chasing, targeting $772 and $774 with stops below $765. Most profits were to be taken at $774, with only a small runner toward $775 and $778. On the bearish side, the best setup was shorting a failed rally into $772 to $774, targeting $770 and $765 with stops above $775. A decisive loss of $765 opened a short on a failed retest of $763, targeting $759 and $755 with stops just above $765. Traders were advised to run normal position size with stops in the 0.5-0.75% range. Shorts were to be kept light and tactical, and dip buying into support remained the core plan until sellers could take back $763.
Market Performance vs. Forecast
Thursday's session delivered a sharp reversal that pushed SPY well below the model's projected maximum range of $762 to $774. SPY opened at $765.47, reached a high of just $765.97, fell to a low of $732.71 and closed at $733.15, down 4.39%, on volume of 105.45M, higher than average. The forecast leaned bullish on the strength of a Call-heavy band, but it also stated plainly that sellers would "need a real catalyst to take it back." External catalysts arrived and drove price action far beyond the projected range. The model does not account for unpredictable external events, and the shock that hit Thursday's tape introduced volatility well outside the base case scenario. The model's call for trending price action did show up, with SPY trending lower from the open and finishing near the lows of the day.
The key levels framed the session with real clarity. SPY opened right in the heart of the $765 to $770 battleground the forecast flagged as the day's critical zone. The session high stalled less than $1 above the open, so $765 served as the line in the sand from the very first minutes. Once that level gave way, the downside map unfolded in order through $763, $759 and $755. The forecast specifically warned that if $755 cracked, "there is little to keep price from falling toward $750," and that "$750 can come quickly." That warning proved accurate as price sliced through $750 with little resistance. The upper levels at $770, $772 and $774 went untouched, and the long-term bull trend above structural support near $640 remains intact even after a heavy day.
On the falling market side, the breakdown trade was built for exactly this kind of session. The playbook called for shorting a failed retest of $763 from underneath with targets at $759 and $755, and both targets were reached as sellers kept pressing. The short at a failed rally into $772 to $774 never activated because price never got near that zone, so no capital was put at risk there. On the rising market side, the favored dip buy at $765 called for a pullback that held and firmed up, and the forecast was explicit that buyers should keep stepping in only "until sellers prove they can take back $763." Once that level broke, stops below $762 were triggered and risk management protocols protected capital before the bigger move lower developed. The guidance to step aside if $755 cracked rather than catch a falling knife kept traders out of the worst of the slide.
The VIX rose 62.49% to 26.99, a violent spike in fear that pushed it back above the 20 mark. The falling market scenario specifically named a VIX bounce off 16.75 as confirmation for shorts, and that signal fired decisively. The heavy volume showed this was broad, conviction-driven selling rather than a quiet drift lower. The model identified the battleground, flagged the support level that would flip the bias, and mapped the exact downside path sellers followed once the catalyst hit. Extraordinary events can produce outsized moves, but the framework adapts as conditions shift, and Thursday showed how well-defined stops and alternate scenarios keep traders protected and positioned to act when the market turns.
Premarket Analysis Summary
The premarket analysis, posted before the opening bell, set up Thursday's session with SPY at $767.30 in a call-dominated tape for a second straight session, extending Wednesday's gap-and-go that held $760 and ran through $765. The bias hinged on $770, the defining level, a major round number, and the heaviest concentration on the board in weeks. Clearing and holding it would call the pullback over, while failing there would likely pin price between $764 and $770 into the weekly close. The expected move ran from $759 to $773, about six points, and the notes cautioned that a wall this heavy at a round number tends to pin price beneath it unless buyers take it early. Upside targets stepped through $769 as the last step before the gate, then $771 as the first step through, $773 as the expected move top, and $775 as max upside. On the downside, $766 was the first level to watch, with $764 as the most important support on the board and the floor of Wednesday's rally, $762 as the point of last hope, and $760 as max downside, a major round number and Wednesday's gate turned floor, sitting just above the bottom of the expected move.
The upside map never came into play, and the downside map got completely blown apart. SPY opened at $765.47, already below the $766 first level and just above the $764 floor, and the high of $765.97 never even reclaimed $766, let alone tested $769 or the $770 gate. Sellers broke $764, sliced through $762 and $760, and blew past the $759 expected move bottom without a fight, driving price to a low of $732.71. SPY closed at $733.15, barely off the lows, down 4.39% on 105.45M shares of well above-average volume. The VIX spiked 62.49% to 26.99, a violent return of fear that confirmed this was a full-scale liquidation, not a routine pullback. The key takeaway is that the call-dominated pin setup failed spectacularly, with every support level giving way and the rally of the past two sessions erased in a single day. Bulls now need to stabilize price and reclaim lost ground before any recovery talk makes sense, while continued weakness would leave the market searching for a floor well below the levels mapped in the premarket notes.
Validation of the Analysis
Thursday's session turned into a full-blown liquidation, and while the size of the drop went far past anything an expected move could frame, the premarket map still flagged the line that mattered from the opening bell. The notes were written with spot at 767.30, pressing into "the heaviest ceiling on the board," with 766 marked as "our first level to watch" beneath spot. SPY opened at $765.47, $1.83 below spot and already under 766. That was the first warning sign. The notes made the bullish condition clear: "Hold 766 and 770 gets its test." Buyers never got that chance. SPY's session high was $765.97, just 3 cents shy of 766, and price never reclaimed it. That left 770, "the gate," completely untouched, $4.03 above the high of the day.
Once 766 rejected, the downside script took over exactly as written. The notes called 764 "the most important level below" and warned that "a clean break puts the rebound in question." It broke, and it broke cleanly. From there the notes said "lose 764 and expect a quick trip to 762, then a real fight at 760," and that sequence played out in order. The fight at 760 never came, though. Sellers drove straight through max downside and the 759 bottom of the expected move. SPY bottomed at $732.71, $27.29 below 760, and closed at $733.15, down 4.39%. The notes had cautioned that ranges should stay contained "unless one side forces the issue," and sellers forced it in a big way on heavy volume. The VIX rose 62.49% to 26.99, a surge in fear that confirmed this was no ordinary pullback and showed the call-dominated positioning unwinding all at once.
The trading value came from knowing that 766 was the line bulls had to hold and that a failure there flipped the whole board bearish. The first setup was the short on the rejection just under 766. Selling the $765.97 high with risk tucked above 766 paid 1.97 points into 764, 3.97 points into 762, and 5.97 points into 760, all levels the notes had laid out in sequence. The second opportunity was what happened after 760 gave way. The notes had defined it as max downside and "yesterday's gate turned floor," so a decisive break through it signaled the expected move was broken and the trend had room to run. Traders holding from the 766 rejection had a shot at the full 33.26-point slide to the low. The map also kept traders out of the worst trade of the day. With 766 never reclaimed, there was no reason to buy the dip toward 769 or 770. Heading into Friday, bulls need to stabilize price and reclaim the old 760 floor before any talk of recovery makes sense. Bears simply need to keep price pinned near the lows to press the breakdown into the weekly close.
Looking Ahead
Friday brings the biggest scheduled event of the week, with the monthly jobs report hitting at 8:30 AM ET. Traders will get three key numbers at once: Non-Farm Employment Change, the Unemployment Rate, and Average Hourly Earnings m/m. This is the high-impact release that can move every corner of the market, because it gives the Fed its most complete picture of the labor market. A strong payrolls number paired with a steady unemployment rate would back the growth story, but it could also push back expectations for rate cuts. A weak print or a jump in unemployment would likely revive easing bets while raising fresh worries about a slowdown. Don't sleep on the wage data, either. A hot Average Hourly Earnings reading would signal sticky inflation pressure, and that could rattle the market even if the headline jobs number looks fine.
The action doesn't stop after the open. At 10:00 AM ET, the Prelim UoM Consumer Sentiment and Prelim UoM Inflation Expectations reports land, and both are medium-impact releases that could add a second wave of volatility. The inflation expectations reading matters most, since the Fed keeps a close eye on whether consumers believe price pressures are easing. If both reports point in the same direction as the jobs data, the morning's move could build strength into the afternoon. If they send mixed signals, expect choppy, back-and-forth trading. Jobs days are known for violent pre-market swings that often reverse once regular trading begins, so avoid chasing the first move. Keep position sizes manageable, use stops, and let the dust settle before committing fresh capital heading into the weekend.
Market Sentiment and Key Levels
Thursday belonged to the bears, and it wasn't close. Sellers grabbed control from the opening bell, never gave it back, and pushed SPY to a finish just pennies off the session lows. A close like that tells you buyers never showed up to defend anything, and it raises the risk of follow-through selling. The damage was broad. The Nasdaq led the way down with a 5.52% plunge, the Russell 2000 dropped 4.49%, and the Dow fell 3.44%. When tech, small caps, and blue chips all get hit this hard together, that's not rotation. That's a wholesale move out of risk. Mega-cap leadership was mostly red, which dragged hard on the cap-weighted averages. Bitcoin slid 5.61%, confirming that speculative appetite dried up across the board, while gold gained 0.93% as some money looked for shelter. Fear also came roaring back. The VIX spiked 62.49% to 26.99, wiping out Wednesday's calm and launching back above the 20 threshold in a single session. There was no single headline driving it, which makes the selloff look more like broad de-risking ahead of a major data release. Bears are firmly in control heading into Friday.
SPY finished right on top of first support at $733, and that's the line bulls have to hold. Losing $733 likely sends price toward $728, then $725 and $720. If $720 gives way, there's little to keep SPY from sliding toward $715. On the upside, first resistance sits at $735, and a push through there opens the door to $738, followed by $740 and $745 if a relief bounce gains traction. Zoom out and the long-term bull trend is still intact, with SPY well above structural support at $640. As long as those key structural levels hold, this remains a broader dip-buying environment, but the short-term structure is broken and needs time to repair. Friday's projected maximum range runs from $719 to $741, with the Put side dominating in an expanding band that points to trending price action mixed with intermittent chop. The flip back to Put-side control lines up with what the tape showed. The calendar is anything but quiet. Average Hourly Earnings, Non-Farm Employment Change, and the Unemployment Rate hit at 8:30 AM ET, followed by Prelim UoM Consumer Sentiment and Inflation Expectations at 10:00 AM ET. With the jobs report on deck, expect big swings, especially in the first hour. Watch whether mega-caps and crypto can stabilize, since sustained weakness in both leadership groups would signal a deeper pullback. Yields and energy prices remain factors that could add pressure if inflation worries build. Given the Put-heavy setup and the weak close, we favor shorting rallies near $738. Let the data hit before acting, keep position sizes small with the VIX this elevated, and treat a decisive push above $740 as the signal to step aside from the short side.
Expected Price Action
Friday's session brings actionable intelligence generated by our AI model, which projects SPY's maximum range at $719 to $741. With the Put side dominating in an expanding band, the model is calling for trending price action with intermittent chop. Friday is loaded with market-moving data. Average Hourly Earnings, Non-Farm Employment Change and the Unemployment Rate all hit at 8:30 AM ET, followed by Prelim UoM Consumer Sentiment and Prelim UoM Inflation Expectations at 10:00 AM ET. With the jobs report on deck, expect significant volatility, especially in the first hour of trading. Thursday's brutal selloff left SPY sitting right on the model's first support at $733, just above the middle of Friday's projected range. Sitting on support with a Put-heavy tilt to the band gives us a bearish bias heading into Friday. The VIX rose 62.49% to 26.99, a violent spike in fear that confirms sellers have grabbed control.
The key battleground for Friday is the $733 to $738 zone. $735 is the first resistance bulls need to reclaim, and a push through it opens the door toward $738. Above that, $740 and the $741 range top cap the upside, with $745 sitting just beyond. On the downside, losing $733 likely sends price toward $728, with $725 below that. The lowest support sits at $720, right near the $719 bottom of the model's range. If $720 breaks, there is little to keep price from falling toward $715. The bigger picture remains intact, with SPY well above structural support near $640 and the long-term bull trend still in place. As long as price holds above key structural levels, this is still a dip-buying market on a broader timeframe, but the short-term structure needs repair.
In the short run, the playbook favors shorting rallies near $738. A bounce into $738 that stalls sets up a short with $733 and $728 as targets. If $733 fails early, Friday likely turns into a trend day toward $725 and $720. Don't chase the first move off the jobs data, since chop is part of the forecast and the opening reaction can reverse quickly. If buyers push through $740 and hold, step aside on the short side, because that signals Thursday's flush may have run its course. Dip buyers should wait for a test of $720 or lower before stepping in, and only with tight risk. With fear surging and the biggest data release of the month ahead, Friday sets up as a test of whether bulls can stop the bleeding or whether sellers press their advantage into the weekend.
Trading Strategy
The VIX rose 62.49% to 26.99, a violent spike in fear that blasts it well above the 20 mark and tells us traders are scrambling for protection heading into Friday. This is not the tape for normal position size. The jobs report lands at 8:30 AM ET with Average Hourly Earnings, Non-Farm Employment Change and the Unemployment Rate, followed by Prelim UoM Consumer Sentiment and Inflation Expectations at 10:00 AM ET, so the first hour is likely to be a whipsaw. Cut size in half, widen stops to give the market room to breathe, and avoid taking a trade in the first few minutes after the 8:30 release. The Put side dominates an expanding band, and the model calls for trending action with intermittent chop, so expect sharp counter-moves even if the trend points lower.
In a rising market scenario, buying a hold of $733 after the data hits is the cleanest long setup, but it is a tactical bounce trade, not a trend trade. The trigger is price testing first support, stabilizing and firming up, ideally with the VIX easing back below 26.99 as buyers step in. The first profit target is $735, with $738 next as price runs into heavier resistance. Runners can press toward $740 and the top of the projected range at $741, but treat that as the stretch target on a strong relief rally. Stops on longs belong below $728. If bulls clear $738 and hold it, don't chase the spike. Buy a clean retest of $738 as support instead, targeting $740 and then $741. Stops on that breakout trade belong below $735. Since a push beyond $741 takes price outside the projected range, take most profits there and let only a small runner ride toward $745.
In a falling market scenario, shorting a failed rally into $738 to $740 is our favored trade and the best setup on the board given the Put-heavy structure and the weak close near the lows. A bounce into that zone that rolls over is the trigger, particularly if the VIX pushes back above 26.99 while price stalls under resistance. The first profit target is $735, with $733 next if sellers keep pressing. Stops on shorts belong above $741, the top of the projected range. If $733 gives way with conviction, short a failed retest of $733 from underneath, targeting $728 and then $725. Stops on that breakdown trade belong just above $735. If sellers keep control, $720 is the next target, and because the projected low sits at $719, take most profits into $720 and keep only a small runner. If $720 cracks, there is little to keep price from sliding toward $715, but by that point the move is stretched, and that is where shorts should be booking gains, not adding.
The long-term bull trend remains intact above $640, and the bigger picture is still a dip-buying environment, but the short-term edge belongs to the bears until SPY repairs the damage. The explosion in fear and the broad risk-off tone make longs a quick tactical bounce at best, while fading rallies into resistance carries the better odds. Keep size small, scale out in layers into support, respect your stops, and let the jobs data show its hand before committing. Short strength into $738 until buyers prove they can take back $741.
Model’s Projected Range
SPY's projected maximum range for Friday is $719 to $741, with the Put side dominating in an expanding band that suggests trending price action with intermittent chop. Friday brings the Average Hourly Earnings m/m, Non-Farm Employment Change and Unemployment Rate at 8:30 AM ET, followed by Prelim UoM Consumer Sentiment and Prelim UoM Inflation Expectations at 10:00 AM ET, and with the jobs report on deck these releases are likely to produce significant volatility particularly in the first hour of trading. SPY closed at $733.15, down 4.39%, in a brutal session that opened at $765.47, tagged a high of $765.97 right out of the gate and then sold off relentlessly to a low of $732.71, finishing just pennies off the lows. SPY is trading near our model's first support at $733, and with no single headline to point to, the size of the drop and the spike in fear show broad risk-off sentiment taking hold heading into a major macro data release. If SPY can push through $735, it opens the door to a move toward $738, but if $733 gives way, price likely slides toward $728, and if the lowest support at $720 breaks there is little to keep price from falling toward $715. The long-term bull trend remains intact above $640 with SPY well above structural support. As long as price holds above key structural levels, this remains a broader dip-buying environment. Absent a catalyst, resistance sits at $735, $738, $740, $745, while support rests at $733, $728, $725, $720. We favor shorting rallies near $738 given the Put-heavy setup and the weak close. Bitcoin dropped 5.61% to close below $75,895, while the MAG stocks had a mostly red day across the board led by Tesla down 10.77%, and sustained weakness across both leadership groups would be required to signal a deeper pullback. The VIX closed at 26.99, up 62.49%, suggesting elevated fear given the sharp selloff and the uncertainty around Friday's jobs data. SPY broke sharply lower in the session and now needs to stabilize to repair its short-term structure, with longer-term structural support near $640.
Market State Indicator (MSI) Forecast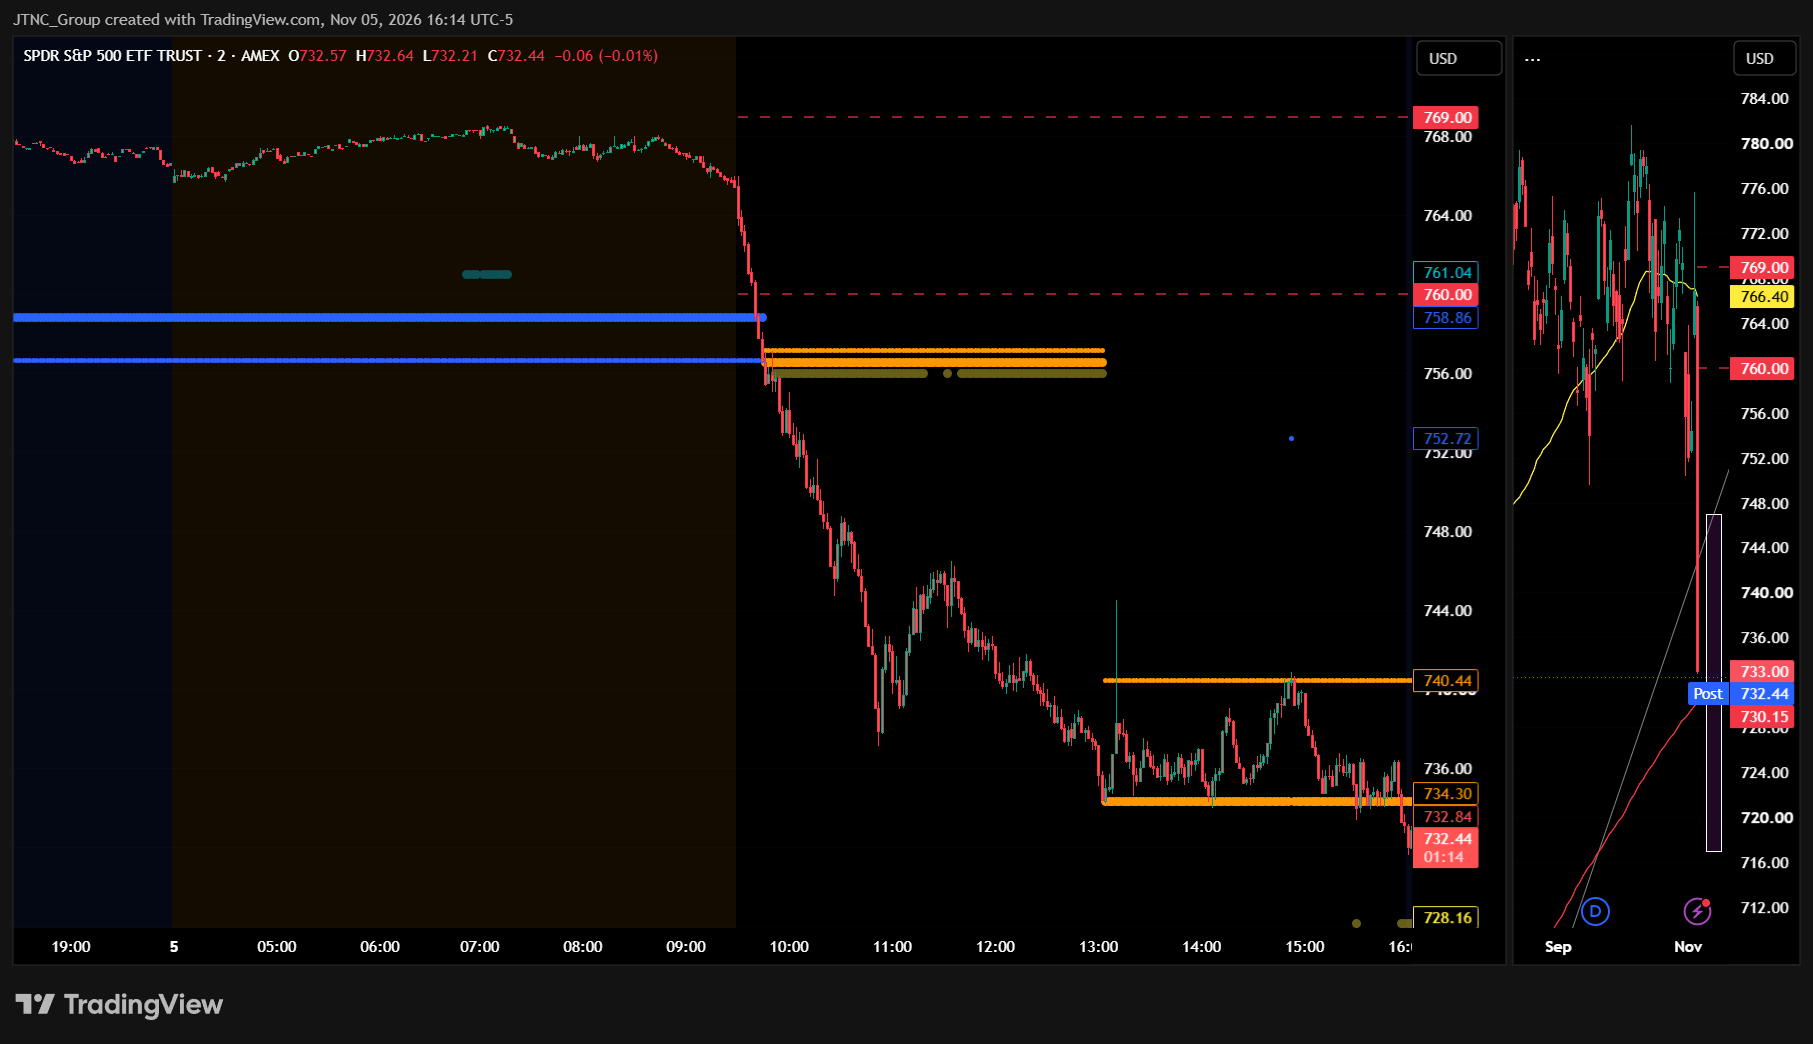
Current Market State Overview:
The MSI ended Thursday in a Bearish Trending Market State with SPY closing at $733.15. Because SPY closed below MSI support, $734.3 now flips to resistance for Friday's session, with $740.44 MSI resistance above it. The day started on a very different note. SPY held a Bullish Trending state in the premarket near $758.86, with extended targets visible above near $761.04. The MSI did not rescale overnight, but by the open the market started to fall, and the MSI rescaled into a very narrow bearish state.
With extended targets printing below during the AM session, the herd pushed price lower all day. The MSI rescaled lower again in the PM session and stayed Bearish Trending into the close, now in a wide $6.14 range. Extended targets were still printing below at the close, near $728.16. The drubbing on SPY was bad, but QQQ got close to limit down 7% territory, an absolute bloodbath. The market wasn't positioned for this even as early as the open, so plenty of people were hurt, and real technical damage has been done.
SPY broke its long-term trend line, and while it is still just above the 200 DMA, it's only a matter of time before it gets there. The last time we saw a selloff this size was Liberation Day, and before that it was 2020 and Covid. Covid set up a rally that lasted four years, and this may do the same thing. We would not step in right here, but another day or two from now it may be a good time to dip your toes. For Friday, the wide bearish MSI with extended targets below is forecasting a strong continuation lower, with the bears keeping up the pressure and downside momentum likely to persist. The expected range is huge, so caution is warranted. MSI support is $734.3 with resistance at $740.44.
Key Levels and Market Movements:
Wednesday we stated, "Bears want to see a bit of profit taking overnight that tests $758.86 MSI resistance turned support near $760," and added, "A failure there with the MSI rescaling lower and extended targets printing below would put $756.68 and $755.60 in play and signal the gap is filling," while also noting, "If $758.86 breaks with the MSI rescaling lower and extended targets printing below, that level flips back to resistance, and traders can sell rallies into it while targeting $756.68 and $755.60."
The bears got their script, and it turned into something far uglier than a gap fill. SPY looked fine in the premarket, holding a Bullish Trending state near $758.86 with extended targets visible above. It opened at $765.47 and tagged its high at $765.97, and that was the last good moment of the day. Shortly after the open the selling hit hard. The MSI rescaled into a very narrow Bearish Trending state with extended targets printing below, and SPY cut through $758.86, $756.68, and $755.60 like they weren't there. The entire election gap was gone and the selling kept going.
The first trade came right after that open reversal. With the MSI flipped to a narrow bearish state and extended targets printing below, the move was to sell the rally into MSI resistance and target $756.68 and $755.60. Those levels didn't even slow price down. The second trade set up in the PM session when the MSI rescaled lower again into a wide bearish state. Selling a test of $740.44 MSI resistance targeted $734.3 support, and with extended targets printing below there was no reason to cover early. SPY broke through $734.3, hit a low at $732.71, and closed at $733.15, below the range with extended targets still printing below near $728.16. At minimum it was a 2-for-2 session for traders following the framework.
SPY fell 4.39% on volume of 105.45 million shares, well above average, so this was real liquidation, not a quiet drift. The VIX jumped 62.49% to 26.99, back above 20, and fear is clearly back in the driver's seat. It was a volatile but readable day with substantial setups, all identified through proper context, patience, and flexibility while leveraging the MSI, premarket levels, and market structure rather than forcing trades. The MSI continues to prove its reliability as the cornerstone of our trading process.
Trading Strategy Based on MSI:
Friday has heavy economic data, with Average Hourly Earnings m/m, Non-Farm Employment Change, and the Unemployment Rate at 8:30 AM ET, followed by Prelim UoM Consumer Sentiment and Prelim UoM Inflation Expectations at 10:00 AM ET. That can introduce significant volatility, so traders should be ready to trade what they see rather than predict. The MSI closed in a wide Bearish Trending state with extended targets printing below, which points to a strong continuation lower on Friday. With SPY closing below the range, $734.3 now acts as resistance, with $740.44 above it. There is no MSI support beneath, so Thursday's $732.71 low, the extended targets near $728.16, and the 200 DMA are the levels below.
Bulls want to see overnight price hold Thursday's $732.71 low and reclaim $734.3. From there they need to push through $740.44 toward the premarket levels above, with the MSI rescaling higher and extended targets printing above. Given the damage done Thursday, that is a tall order and would likely need help from the jobs data. Bears want to see $734.3 hold as resistance and price press below $732.71 toward the $728.16 extended targets and the 200 DMA. If the MSI keeps rescaling lower with extended targets printing below, the long-term trend line break gets confirmed in a hurry.
The primary setup for Friday is selling rallies into $734.3 MSI support turned resistance, targeting $732.71 and then $728.16 and the premarket levels below, since there is no MSI support underneath. A rally that stretches to $740.44 and fails is a higher-quality short with the same targets. A failed breakdown below $728.16 that quickly reclaims the level could offer a quick long, but the bias favors shorts until the MSI shifts. A reclaim of $740.44 with the MSI rescaling higher and extended targets printing above would be the first sign the bears are losing control. With the jobs report hitting before the open and the expected range this large, size down and let the MSI confirm before pressing. For those itching to buy this flush, patience still applies. Another day or two may give a better spot to dip your toes.
The long-term bull trend remains intact above $640 and failed breakouts and failed breakdowns continue to offer the highest-probability setups. Remain flexible, avoid trading during Ranging Market States unless a clear failed breakout or breakdown presents itself, and ensure all trades are fully aligned with MSI signals. Providing real-time insights into market control, momentum shifts, and actionable levels, the MSI when integrated with our Pre-Market and Post-Market Reports continues to sharpen execution precision and elevate trade quality. If you haven't yet integrated MSI and our model levels into your process, now is the time. Contact your representative to get started as these tools are designed to support consistency and enhance performance.
Dealer Positioning Analysis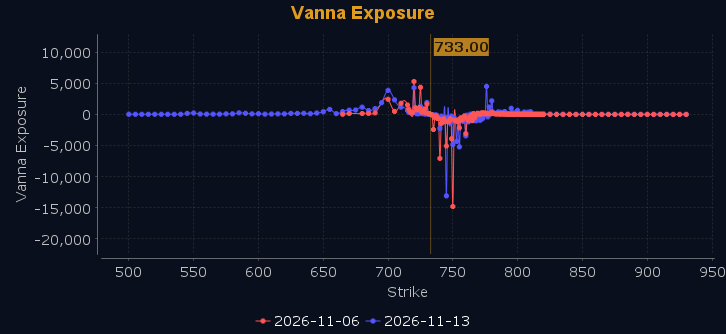
Dealers are selling SPY $761 to $790 and higher strike Calls while buying $734 to $760 Calls in very large size, indicating the Dealers' desire to participate in any relief rally on Friday. SPY closed just shy of the 200 DMA on Thursday after losing over 4.4%, which came right after a rally of more than 1.5% on Wednesday. No support held on Thursday, which is typical in a negative gamma market. The ceiling for Friday appears to be $770. To the downside, Dealers are buying $733 to $690 and lower strike Puts in a 4:1 ratio to the Calls they're selling, displaying real concern that prices could move lower. There is a Call wall at $760 and a Put wall at $755, but neither is expected to hold on repeated attempts to break through. There is little below to support price, though $730 and $725 may at least stall further declines. Gamma is heavily negative, so Dealers will press the trend rather than defend it. That said, there will be a day when we see a face-ripping short squeeze that could reverse half of Thursday's losses with ease, so be careful, scale down in size, and use wide stops and targets until this settles. The bears are completely in control, with above $760 bullish and below $750 bearish, and chop and traps in between. Dealer positioning is unchanged at neutral/slightly bearish.
Looking Ahead to Next Friday:
Dealers are selling SPY $761 to $795 and higher strike Calls while buying $734 to $760 Calls in very large size, indicating the Dealers' belief that a short squeeze is likely to develop over the coming week. The ceiling for the week appears to be $776. To the downside, Dealers are buying $733 to $685 and lower strike Puts in a 4:1 ratio to the Calls they're selling, so they remain heavily hedged against further downside. There is a Call wall at $776 which will provide resistance, with a Put wall at $745 that will offer only temporary support given the heavily negative gamma. There is little support lower, and while $730 and $720 may slow any continued descent, they will not hold on repeated attempts to break through. Below $750 is bearish and above $765 is bullish, with chop and traps in between. For the week Dealer positioning is unchanged at bearish. We advise reviewing Dealer positioning daily for directional clues. These positions evolve quickly and tracking them is essential for staying ahead of shifting market sentiment.
Recommendation for Traders
Short rallies near $738, targeting $733 and $728, with stops above $740.
With the jobs report at 8:30 AM ET, expect big swings early, so keep size small and review the premarket analysis posted before 9 AM ET for any changes in the model's outlook and Dealer Positioning.
Good luck and good trading!
