
Market Insights: Wednesday, November 4th, 2026
Market Overview
Wall Street threw a party Wednesday after Democrats won control of both chambers of Congress in a seismic midterm election, setting up a divided government that investors clearly welcomed. The Dow jumped 3%, or more than 1,500 points, for its best single-day showing since President Trump paused his sweeping tariff rollout in April 2025, while the S&P 500 gained 1.5% and the Nasdaq climbed 1.4% in a broad post-election relief rally. Not everyone got an invite, though. Markets quickly priced in the risk that ballot measures and newly elected officials could restrict data center construction, which dragged down chip stocks like Nvidia (NVDA) and Micron (MU). Investors rotated out of semiconductors, this year's high fliers, and into other big tech names, with Apple (AAPL) and Microsoft (MSFT) both hitting all-time highs. Consumer Discretionary led the S&P 500 as Amazon (AMZN) rallied 7%, followed closely by Communication Services as Alphabet (GOOGL) rose more than 4%. Financials (XLF) also rallied, along with defensive groups like Consumer Staples (XLP), Real Estate (XLRE), and Health Care (XLV), showing breadth well beyond the AI trade. Investors will also watch for policy moves on housing and pharmaceuticals, though Yahoo Finance's Jared Blik pointed out Tuesday that midterms tend to shape stocks in the near term but don't move markets much over the long haul. On the economic front, ISM and S&P data showed US services activity expanded at a slower pace in October as businesses kept wrestling with elevated costs, while ADP's report pointed to "pretty solid job growth" in private-sector hiring.
Earnings kept the action going. AMD (AMD) posted a third-quarter beat, McDonald's (MCD) struggled with slowing same-store sales growth, and Duolingo (DUOL) soared nearly 30%, recovering almost all of its year-to-date losses. The language app's daily active users jumped 29% year over year to 64.9 million, paid subscribers grew 14% to 13.1 million, and management said it will "gradually" lean "more into monetization in ways that preserve the quality of our free experience." William Blair analysts led by Ralph Schackart said the quarter "begins to address the primary investor concern" about whether rising engagement can turn into stronger monetization, noting DAU growth accelerated for a second straight quarter, subscription bookings reaccelerated meaningfully, and management expects paid-subscriber growth to bottom in a couple of quarters. The other big loser of the day was oil, which had a far rougher time than chips. WTI crude plunged more than 7.7% to below $90 a barrel, giving up about $15 since Friday's $104 close and putting it on pace for its worst week since April 2020 as traders bet the election clears the way for an end to the Iran war. Brent sat near a two-month low, gasoline futures were on track for their lowest close since March 10, which is welcome news for drivers, and energy stocks (XLE) fell more than 5%, with refiners taking the biggest hit. Still, crude remains about 50% above where it started the year, US diesel stockpiles are at their lowest since 2003, and the Wells Fargo Investment Institute says fuel supplies "remain constrained by the war." Nationwide's Mark Hackett noted oil is retreating "on hopes for a deescalation in the Iran conflict, even as the diplomatic signals remain ambiguous," so traders will be watching closely to see whether WTI settles under $90 at 2:30 p.m. ET.
SPY Performance
SPY opened at $762.99, a big gap up from yesterday's close of $754.44. The bulls came out swinging, and this time they kept punching. The open blew straight past yesterday's high of $757.07, the first test we flagged, and landed right in the neighborhood of the $763.85, $764.44, and $766.62 cluster we said buyers needed to reclaim. SPY dipped to a session low of $762.64 just after the open, barely below where it started, and that was the closest sellers ever got to filling the gap. From there, buyers pushed SPY to a session high of $769.22, clearing the entire resistance cluster. SPY finished at $766.81, giving back a little from the peak but closing above $766.62 and well above its open.
SPY gained 1.65%, its strongest move in a while and exactly the kind of follow-through yesterday's quiet bounce was missing. For the second straight session, the low came early and never got retested, and for the second straight session SPY closed above its open. That turns a one-day win into an actual pattern. This time the bulls brought volume with them. Turnover climbed to 56.95 million shares, near average and a big jump from yesterday's thin trading. That's the conviction we said was missing, and it gives today's breakout real credibility. The fear gauge confirmed it. The VIX plunged 19.59% to close at 16.75, crashing through the 20 level that had been hanging over the market. Traders dumped their protection in a hurry, which tells you the mood flipped from defensive to risk-on in a single session.
The bulls took the wheel today. The gap left behind is the key thing to watch now. Today's low of $762.64 is the first line of support, and holding above it keeps the gap open and the breakout intact. Below that, yesterday's high of $757.07 marks where the gap would fill, with $752.41 as deeper support. A slide back under $757.07 would turn today's breakout into a fakeout and hand momentum back to the sellers. On the upside, today's high of $769.22 is the next hurdle, and a clean push through it would open the door to new highs. The combination of a big gap that held, a higher close, solid volume, and a VIX back below 20 makes today clearly bullish. Some consolidation after a move like this would be healthy, but dips toward the gap are likely to attract buyers. Yesterday the bulls kept the crack from getting wider, and today they patched it.
Major Indices Performance
The Dow led the charge with a massive 3.03% gain, its strongest showing in this recent stretch, as buyers piled back into blue-chip names with real conviction. Industrials, financials, and consumer-facing giants all caught a bid as a steep slide in crude eased fears about energy costs squeezing corporate margins. When oil prices drop that hard in a single day, old-economy companies with big transportation and input costs benefit immediately, and the Dow's makeup put it in the perfect position to capitalize. This wasn't a defensive hideout move like we've seen in recent sessions. It was a broad, confident risk-on rally where the Dow simply had the most fuel.
The Russell 2000 came in second with a 1.54% gain, extending its winning streak to three straight sessions. Small-caps have quietly become one of the most consistent groups on the board, and the plunge in crude gave smaller domestic companies another tailwind, since they tend to feel energy price swings more than larger firms. With fear draining out of the market, investors were willing to step further out on the risk curve, and small-caps rewarded them. Three green days in a row shows buyers are building positions here, not just trading them.
The Nasdaq brought up the rear with a 1.44% gain. Finishing last on a day like this isn't a sign of weakness, since tech still posted a strong session and stacked a second straight gain after snapping its losing streak. Megacap leadership was mixed, though, and a couple of heavyweight laggards kept the index from keeping pace with the broader rally. The S&P 500 landed between the Dow and the Russell 2000, powered by gains spread across nearly every corner of the market. The VIX plunged 19.59% to close at 16.75, breaking well below the key 20 level and signaling that fear has been flushed out in a hurry. With only Unemployment Claims on Thursday's calendar, traders don't have a major catalyst to knock this momentum off course, so the path of least resistance looks higher for now.
Notable Stock Movements
Microsoft led the Magnificent Seven for the second straight session, and this time it wasn't just a bounce. It was a statement. The software giant surged as much as 6.68%, more than doubling the gain from its previous run at the top of the group. Back-to-back leadership from Microsoft carries real weight because it shows the buying wasn't a one-day relief rally. Investors are piling back into one of the market's most trusted heavyweights with growing conviction, and that kind of follow-through is exactly what you want to see when a recovery is trying to take hold.
The group put up another mostly green day, building on last session's turnaround. The exceptions were NVIDIA and Tesla, with Tesla taking the biggest hit after falling as much as 3.34%. That's two straight sessions in the red for Tesla, so its weakness is starting to look like more than a one-off stumble. NVIDIA joining the laggards is worth watching too, since it's usually one of the group's momentum leaders. On the bright side, Apple found its footing after leading the losses last time, which takes away one of the concerns hanging over the group. With most of the heavyweights pushing higher for a second day, confidence in big tech looks like it's firming up rather than fading.
The broader market went well beyond a tech story. The Dow exploded 3.03%, easily outpacing the Nasdaq's 1.44% gain, while the Russell 2000 climbed 1.54%. When blue chips, tech, and small caps all rally hard together, that's broad buying, not just rotation from one corner to another. The VIX collapsed 19.59% to 16.75, finally breaking back below that key 20 level and signaling that fear is draining out of the market fast. Thursday brings Unemployment Claims at 8:30 AM ET, which probably won't cause much of a stir. If Microsoft keeps leading and Tesla and NVIDIA can stop the bleeding, big tech has a clear path to extend this rally. But if those two laggards keep sliding, they could become a drag on the group's momentum.
Commodity and Cryptocurrency Updates
Crude oil got hammered, plunging 7.67% to close at $88.72. After a quiet session that hinted the selling might be fading, sellers came roaring back and knocked the black gold firmly below $90. A drop this sharp suggests some of the geopolitical risk premium that had been propping up prices is starting to unwind, and traders who rode the rally are rushing to lock in gains. Even after the slide, crude remains well above $70 and continues to defy longer-term model expectations, with supply disruptions and geopolitical tensions still keeping prices elevated. Thursday's Unemployment Claims report isn't likely to shift the energy picture much, so supply headlines will stay in the driver's seat. A sustained move this far above $70 keeps inflation concerns alive and could complicate Fed policy if energy prices stay high.
Gold roared back, jumping 3.30% to close at $4,070. That wipes out the prior session's slip and puts the yellow metal back above the key $4,000 level that bulls needed to reclaim. The move is notable because gold rallied even as fear eased across the broader market, which shows demand for the metal goes beyond simple safe-haven buying. Inflation uncertainty, steady central bank purchases, and ongoing geopolitical tensions continue to support the long-term case. Retaking $4,000 makes a strong argument that the recent drop was a flush rather than the start of a deeper correction. Now bulls need to hold this level and build on it, while a quick slip back below $4,000 would put sellers back in the conversation.
Bitcoin extended its rebound, climbing 3.56% to close above $80,096. That marks a second straight green day and pushes the crypto back above the $80,000 psychological level that had anchored the base-building story. Strong risk appetite across the market gave Bitcoin plenty of fuel, once again showing it trades like a risk asset tied to overall sentiment. Reclaiming $80,000 goes a long way toward repairing the recent damage and gives bulls real momentum to work with. With only Unemployment Claims on Thursday's calendar, Bitcoin will likely keep taking its cues from the broader risk tone. Holding above $80,000 would confirm the pullback is over, while a slip back below would reopen the door to the downtrend.
Treasury Yield Information
The 10-year Treasury yield fell 1.17% today to close at 4.890, wiping out yesterday's jump and pulling rates back from the edge of the 5% line. Yesterday's spike had bonds flirting with serious-risk territory, but today's drop gave stocks the breathing room they needed. The 10-year still hasn't escaped the danger zone, but the momentum swung back toward bond buyers, and it took some of the immediate rate pressure off equities.
Measured against each threshold, the picture improved meaningfully. The 4.5% level where equity valuations start to feel the squeeze is now 39 basis points below today's close, and the 4.8% mark that usually triggers broader selling moved back within reach at just 9 basis points away. The 5% serious-risk flag now has 11 basis points of cushion, up from just 5 yesterday. The gap to 5.2%, where the framework calls for a 20% or greater correction, widened to 31 basis points, pushing the worst-case scenario further out than it was a day ago.
Stocks welcomed the relief in a big way. The Dow surged 3.03%, flipping yesterday's rate-driven weakness into a powerful rally as value names got the break they needed. The Nasdaq added 1.44% and the Russell 2000 climbed 1.54%, so rate-sensitive small caps and growth stocks both joined the party. Fear drained out of the market too, with the VIX plunging 19.59% to 16.75. Gold jumped 3.30% to $4,070, but that move looks more like a response to falling yields than a flight to safety. The biggest help for bonds came from crude, which collapsed 7.67% to $88.72. A drop that steep eases inflation expectations, and that's exactly the kind of force that keeps pulling yields lower.
Thursday brings Unemployment Claims at 8:30 AM ET, which is unlikely to move bonds much on its own, so the 10-year will likely take its cues from oil and overall risk appetite. The level to watch now shifts to 4.8%. A close below it would get the 10-year out of the selloff zone and give stocks a much friendlier backdrop. A bounce back toward 4.95% or higher would put the 5% threat right back on the table and test whether today's equity rally has real staying power.
Previous Day’s Forecast Analysis
Heading into Wednesday, our AI model projected a maximum range for SPY of $745 to $768, with the Put side dominating in an expanding band. The model called for trending price action with intermittent chop, and the ISM Services PMI at 10:00 AM ET was flagged as the macro catalyst most likely to produce significant volatility in the first hour and finally break SPY out of its recent box. Because Tuesday's modest gain left SPY below the middle of the projected range and just under first resistance at $755, and because the band tilted toward puts, the forecast carried a bearish bias. The VIX had dropped 1.99% to 20.73, a modest easing of fear, but its perch above 20 with a major data release on deck suggested sellers had not given up control.
The key battleground was the $750 to $755 zone. On the upside, $755 was the first resistance, and a clean push through it opened the door to $758, then $760 and $765, with $768 marking the top of the range. On the downside, losing $750 was expected to send price toward $745, the bottom of the range and heavy support. Below that sat $740, and a break there could quickly lead to $735. The bigger picture stayed healthy, with structural support near $640 and the long-term bull trend intact.
The favored trade was shorting a failed rally into $755 to $758, targeting $750 and then $745, with stops above $760 or just above $758 for aggressive traders. A conviction break below $745 called for shorting a failed retest from underneath, targeting $740 and $735, with stops just above $750 and most profits taken into $740. On the long side, buying a dip at $750 that held was the best setup, targeting $755, $758, and runners toward $760, with stops below $745. A reclaim of $760 after a strong ISM print would flip the lean and set up a retest buy targeting $765 and $768, with stops below $758. Traders were told to trade at roughly half size through the open, use stops in the 0.75-1% range, and let the data settle before committing capital. The overall edge favored fading rallies into resistance until bulls proved they could hold above $758.
Market Performance vs. Forecast
Wednesday's session delivered a powerful rally that carried SPY to the very top of the model's projected maximum range of $745 to $768 and briefly beyond it. SPY opened at $762.99, climbed to a high of $769.22, dipped to a low of $762.64 and closed at $766.81, up 1.65%. The forecast leaned bearish based on the Put-heavy band, but it also flagged the ISM Services PMI at 10:00 AM ET as the macro catalyst most likely to break SPY out of its box. The release did exactly that. The model does not account for unpredictable external events, and the shift in risk appetite surrounding Wednesday's session drove price action beyond the model's base case scenario. The forecast's core call that this catalyst could "finally break the stalemate" proved spot on, and the model's expectation of trending price action showed up clearly in a session that pushed steadily higher and finished near its best levels.
The key levels mapped the move with precision. The forecast stated plainly that if buyers reclaimed $760 with conviction, "the bearish lean fades and a run toward $765 and $768 is on the table." That is exactly how the day unfolded. SPY opened above $760 and never looked back, with the session low holding well above that level all day. Price then tagged $765 and reached $768, the top of the projected range, before stretching just over $1 past it. The model's upper boundary acted as a reliable ceiling for nearly the entire move, and the close settled back inside the range. The $750 to $755 battleground and every downside level at $745, $740 and $735 went untouched, confirming that the long-term bull trend above structural support near $640 remains firmly in control.
On the falling market side, the favored short at a failed rally into $755 to $758 never activated because price opened above that zone and never returned to it. With no trigger, no capital was put at risk on the bearish setups. The breakdown trade below $745 also stayed dormant. On the rising market side, the playbook laid out the breakout scenario above $760 with targets at $765 and $768, and both targets were reached during the session. The session low held above $760, so traders waiting for a clean retest of that level as support may have needed to adapt to a market that never pulled back that far. Stops below $758 were never threatened. The guidance to start longs light and add once the tape confirmed direction fit a session where the direction became obvious early and held.
The VIX dropped 19.59% to 16.75, a sharp collapse in fear that pushed it well below the 20 mark. The rising market scenario specifically called for the VIX to keep sliding below 20.73 as confirmation for longs, and that signal fired in a big way. Volume ran near average, showing real participation behind the breakout rather than a thin drift higher. The advice to keep size at half of normal through the open and let the data settle before committing capital positioned traders to recognize the breakout once it confirmed. The model identified the catalyst, mapped the trigger level that would flip the bias, and named the exact targets bulls reached. The framework adapts as conditions shift, and Wednesday showed how well-defined alternate scenarios keep traders ready to capture opportunity in either direction.
Premarket Analysis Summary
The premarket analysis, posted before the opening bell, set up Wednesday's session with SPY at $759.80 in a call-dominated tape, with the tone flipping positive after an overnight gap that ran straight through $755 and landed right on $760. The bias hinged on $760, the defining level, a major round number, the heaviest concentration on the board, and Friday's break level turned gate. Holding above it would keep the gap intact with the tape pinning and grinding higher, while losing it cleanly would start the gap fill. The expected move ran from $749 to $767, about eight points, and the notes cautioned that a call-dominated tape tends to pin to levels rather than run through them. Upside targets stepped through $761 as the first target, then $765 as the next decision point, $767 as the expected move top and a battleground where price should stall, and $770 as max upside, a major round number with heavy interest and the level bulls needed to call the pullback over. On the downside, $758 was the first level to watch, with $755 as the floor of the gap and yesterday's gate, $753 as the point of last hope, and $750 as max downside, where last week's selling finally stopped.
The downside map never came into play. SPY opened at $762.99, already above the $761 first target, and the low of $762.64 never came close to testing the $760 gate. Buyers drove price through the $765 decision point and past the $767 expected move top to a high of $769.22, stalling just short of the $770 max upside. SPY then eased back into the close, finishing at $766.81, right beneath the expected move top, up 1.65% on 56.95M shares of near-average volume. The VIX dropped 19.59% to 16.75, a sharp unwinding of fear that confirmed the risk-on tone. The key takeaway is that the gap not only held but extended, with bulls owning every level above $760 and nearly reaching the $770 line that would call the pullback over. Bulls now need a close above $767 and a push through $770 to confirm the recovery, while a slip back under $765 would put $761 and the $760 gate back in focus.
Validation of the Analysis
Wednesday's session followed the premarket script almost line for line, with SPY defending the defining level and climbing straight into the max upside zone the notes had circled. The notes were written with spot at 759.80, sitting right on $760, "the defining level." SPY opened at $762.99, $3.19 above spot and already past $761, the first target overhead. The notes made the bullish case simple: "hold above it and the gap holds with the tape pinning and grinding higher." Buyers never let $760 come into question. SPY's session low was $762.64, holding $2.64 above that line and staying clear of $761 all day. With the gate secured from the opening bell, the upside staircase opened up quickly.
The notes said "Hold 760 and 761 then 765 come quickly," and that is exactly how it played out. SPY pushed through $765, "the next decision point," and then through $767, where the expected move topped out. The rally peaked at $769.22, $2.22 beyond the top of the 749 to 767 expected move and just 78 cents shy of $770, our "max upside" and "the level bulls really need to call this pullback over." Price couldn't get through it. SPY stalled beneath that major round number and slipped back into the close, finishing at $766.81, up 1.65%, just 19 cents below $767. That lands right on the level the notes described as a "battleground where price should want to stall." The notes warned participants were "bracing for larger swings," and the session delivered a strong move. Even so, the call-dominated tape still respected the ceiling at $770 instead of running through it. The VIX dropped 19.59% to 16.75, a sharp drop in fear that confirmed the gap was holding, and near-average volume pointed to steady conviction rather than a blow-off.
The trading value came from knowing that $760 was the line to lean on and $770 was the wall. The first setup was the long once SPY opened above $761 with $760 defended underneath. That gave traders a mapped path to $765, a 2.36-point move off the session low. Traders who stayed with the move toward $767 picked up 4.36 points from the low, with risk tucked neatly under $760. The second opportunity was the fade near $770. With max upside sitting just overhead and the top of the expected move already exceeded, there was no reason to chase. Shorting the stall delivered a 2.41-point pullback back beneath $767 into the bell. The map also kept traders disciplined on the downside. With $760 never threatened, there was no reason to press shorts toward $758, $755, or $753. A session that held the defining level, climbed target by target, and turned just below max upside shows how precisely these levels framed the day. Heading into Thursday, bulls need to reclaim and hold $767 and finally break $770 to end the pullback for good. Bears need to push price back under $765 and then through $761 to put the $760 gate back in play.
Looking Ahead
Thursday's economic calendar is light, with just one release on deck: weekly Unemployment Claims at 8:30 AM ET. It's a medium-impact report, but it carries real weight because it's the freshest read on the labor market, the part of the economy the Fed watches most closely when deciding on rates. Since it hits before the opening bell, it will likely set the tone for pre-market trading and the first stretch of the session. A low claims number would signal that employers are still holding onto workers, which supports the growth story but could cool hopes for Fed easing. A jump in claims, especially one that breaks out of the recent range, would raise questions about whether the job market is starting to crack. That could revive rate-cut bets while also stirring recession worries. Watch continuing claims alongside the headline figure, since a steady climb there shows laid-off workers are having a harder time finding new jobs, a trend that often matters more than a single week's initial filings.
With no other data scheduled after the open, the rest of Thursday will likely come down to positioning, fresh headlines, and how traders keep digesting this week's moves. Light calendars can cut both ways. Sometimes they bring calm, range-bound trading, but they can also leave the market more sensitive to surprise headlines, since there's no big scheduled catalyst to anchor price action. If the claims number comes in near expectations, don't be surprised if the session drifts without much conviction. A big miss in either direction, on the other hand, could spark a sharper move that carries through the afternoon. Either way, avoid overreacting to the first move right after the release, since knee-jerk reactions to claims data often fade once the open brings in more volume. Keep position sizes manageable, use stops, and let the market show its hand before committing fresh capital.
Market Sentiment and Key Levels
Wednesday belonged to the bulls, and this time it was a much cleaner win. Buyers took control early, pressed the advantage all session, and finished near the top of the day's range. That's the kind of close that tells you demand didn't fade into the bell. The rotation picture got even more interesting. The Dow led the charge with a 3.03% surge, while the Russell 2000 added 1.54% and the Nasdaq gained 1.44%. When blue chips, small caps, and tech all rally together, that's broad participation, not just a handful of names doing the heavy lifting. Mega-cap leadership was mostly green, which gave the cap-weighted averages plenty of fuel. Across other assets, Bitcoin jumped 3.56% and gold climbed 3.30%. Crypto rallying signals a healthy appetite for risk, though gold's strong move hints that some traders are still hedging their bets. The real headline was fear getting crushed. The VIX dropped 19.59% to 16.75, falling back below the 20 threshold that hung over Tuesday's bounce. That's a significant reset in sentiment. Participation was also steadier than Tuesday's light trade, which makes this move easier to trust. Bulls are firmly in control heading into Thursday.
SPY finished just above first support at $765, and that level is now the floor bulls need to defend. On the upside, first resistance sits at $770, and a push through there opens the door to $772, followed by $775 and $778 if momentum keeps building. On the downside, losing $765 likely sends SPY toward $763, then $759 and $755. If $755 gives way, there is little to keep price from falling toward $750. Zoom out and the bigger picture looks even better than it did a day ago. The long-term bull trend remains intact well above structural support at $640, and Wednesday's rally broke SPY out of the tight box it had been stuck in for several sessions. As long as key structural levels hold, this remains a dip-buying environment. Thursday's projected maximum range runs from $762 to $774, with the Call side dominating in an expanding band that points to trending price action mixed with intermittent chop. The flip from Put-side to Call-side control is a meaningful shift, and it backs up what the tape showed. The economic calendar is quiet, with Unemployment Claims at 8:30 AM ET unlikely to move the market. That means price action will likely be driven by follow-through, or the lack of it. Watch whether breadth holds up and whether mega-caps and crypto can extend their gains, since continued strength there would confirm the breakout has legs. Yields and energy prices remain background factors that could cool things off if inflation worries resurface. After a move this sharp, a pullback to test the breakout wouldn't be a surprise, so we favor buying dips near $765. Let any early weakness play out before stepping in, keep position sizes sensible even with the VIX back in calmer territory, and treat a decisive break below $763 as the signal to step aside from the long side.
Expected Price Action
Thursday's session brings actionable intelligence generated by our AI model, which projects SPY's maximum range at $762 to $774. With the Call side dominating in an expanding band, the model is calling for trending price action with intermittent chop. Thursday brings Unemployment Claims at 8:30 AM ET, but that release is unlikely to move the market, so price action should be driven by positioning and momentum rather than headlines. Wednesday's powerful rally broke SPY out of its recent box, and it finished just below the middle of Thursday's projected range while holding above the model's first support at $765. Sitting on support with a Call-heavy tilt to the band gives us a bullish bias heading into Thursday. The VIX dropped 19.59% to 16.75, a dramatic collapse in fear that puts it well back below 20. Buyers have clearly seized control, and sellers will need a real catalyst to take it back.
The key battleground for Thursday is the $765 to $770 zone. $770 is the first resistance and a major round number bulls need to clear to keep the trend running. A clean push through $770 opens the door toward $772, with $774 marking the top of the model's range and $775 and $778 sitting just beyond. On the downside, losing $765 likely sends price toward $763, with $759 below that. The lowest support sits at $755, and if $755 gives way there is little to keep price from falling toward $750. The bigger picture remains healthy, with SPY well above structural support near $640 and the long-term bull trend intact. As long as price holds above key structural levels, this is still a dip-buying market on a broader timeframe.
In the short run, the playbook favors buying dips near $765. A pullback into $765 that holds sets up a long with $770 and $772 as targets. A break above $770 that holds likely turns Thursday into a trend day toward $772 and the $774 range top. If $765 fails, let price come down to $763 or $759 before stepping back in, since chop is part of the forecast and early shakeouts can reverse quickly. If $755 cracks, step aside rather than try to catch a falling knife, because $750 can come quickly. With fear draining out of the market and no major data to derail it, Thursday sets up as a test of whether bulls can turn Wednesday's breakout into follow-through.
Trading Strategy
The VIX dropped 19.59% to 16.75, a sharp unwind of fear that pulls it well back under the 20 mark and tells us traders are finally comfortable leaning into risk again heading into Thursday. Unemployment Claims hit at 8:30 AM ET, but that report is unlikely to move the market, so the opening bell should carry more weight than the data itself. With fear draining this fast and no major catalyst on deck, traders can return to normal position size, keeping stops in the tighter 0.5-0.75% range from entry. The Call side controls an expanding band, and the model's call for trending action with intermittent chop means the path higher may not be smooth. Expect pullbacks inside the trend, and use them rather than fear them.
In a rising market scenario, buying a dip at $765 that holds and firms up is our favored trade and the cleanest setup on the board. A pullback into first support that stabilizes is the primary trigger, especially if the VIX keeps sinking below 16.75 while buyers defend the level. The first profit target is $770, with $772 next as price works into resistance. Runners can press toward $774, the top of the projected range, so treat that as the stretch target on a strong trend-up day. Stops on longs belong below $762, the projected low, and aggressive traders can tighten to just under $763. If bulls clear $770 and hold it, don't chase the pop. Buy a clean retest of $770 as support instead, targeting $772 and then $774. Stops on that breakout trade belong below $765. Since a push beyond $774 would take price outside the projected range, take most profits there and let only a small runner ride toward $775 and $778.
In a falling market scenario, shorting a failed rally into $772 to $774 is the best bearish setup, particularly if the VIX bounces back off 16.75 while price stalls near the top of the range. A push into that zone that rolls over is the trigger. The first profit target is $770, with $765 next if sellers keep pressing. Stops on shorts belong above $775. If $765 gives way with conviction, short a failed retest of $763 from underneath, targeting $759 and then $755. Stops on that breakdown trade belong just above $765. Because a move below $762 pushes price outside the projected range, take most profits into $759 and keep only a small runner toward $755. If $755 cracks, there is little support until $750, but with calls in charge, any short should stay light and be treated as a quick trade, not a position to marry.
The long-term bull trend remains intact above $640, and this is still a broader dip-buying environment, so the $765 zone is where we want to be a buyer. The collapse in fear and broad participation behind the rally put the edge firmly with the bulls, which makes shorts a tactical fade at best. Scale out in layers into resistance, respect your stops, and keep buying weakness into support until sellers prove they can take back $763.
Model’s Projected Range
SPY's projected maximum range for Thursday is $762 to $774, with the Call side dominating in an expanding band that suggests trending price action with intermittent chop. On the economic front, Thursday, November 5 brings Unemployment Claims at 8:30 AM ET, which is unlikely to move the market. SPY closed at $766.81, up 1.65%, after opening at $762.99, dipping to a low of $762.64 early and then pushing to a high of $769.22 before settling just off the top of the day. SPY is trading near our model's first support at $765, and with no single headline driving the action, the macro backdrop remains in the background while buyers stay firmly in control. If SPY breaks above $770, the next target is $772, but if $765 gives way, look for a slide toward $763, and if the lowest support at $755 breaks, there is little to keep price from falling toward $750. The long-term bull trend remains intact above $640 with SPY well above structural support. As long as price holds above key structural levels, this remains a broader dip-buying environment. Absent a catalyst, resistance sits at $770, $772, $775, $778, while support rests at $765, $763, $759, $755. We favor buying dips at $765. Bitcoin rallied 3.56% to close above $80,096, and the MAG stocks put up a mostly green day led by Microsoft, which gained as much as 6.68%, with Tesla the lone laggard, falling as much as 3.34%, so both leadership groups showed strength that supports the broader rally. The VIX closed at 16.75, down 19.59%, suggesting a significant reduction in fear as buyers stepped in with conviction and pushed SPY higher across the session. SPY closed within its rising trend channel, holding well above structural support near $640.
Market State Indicator (MSI) Forecast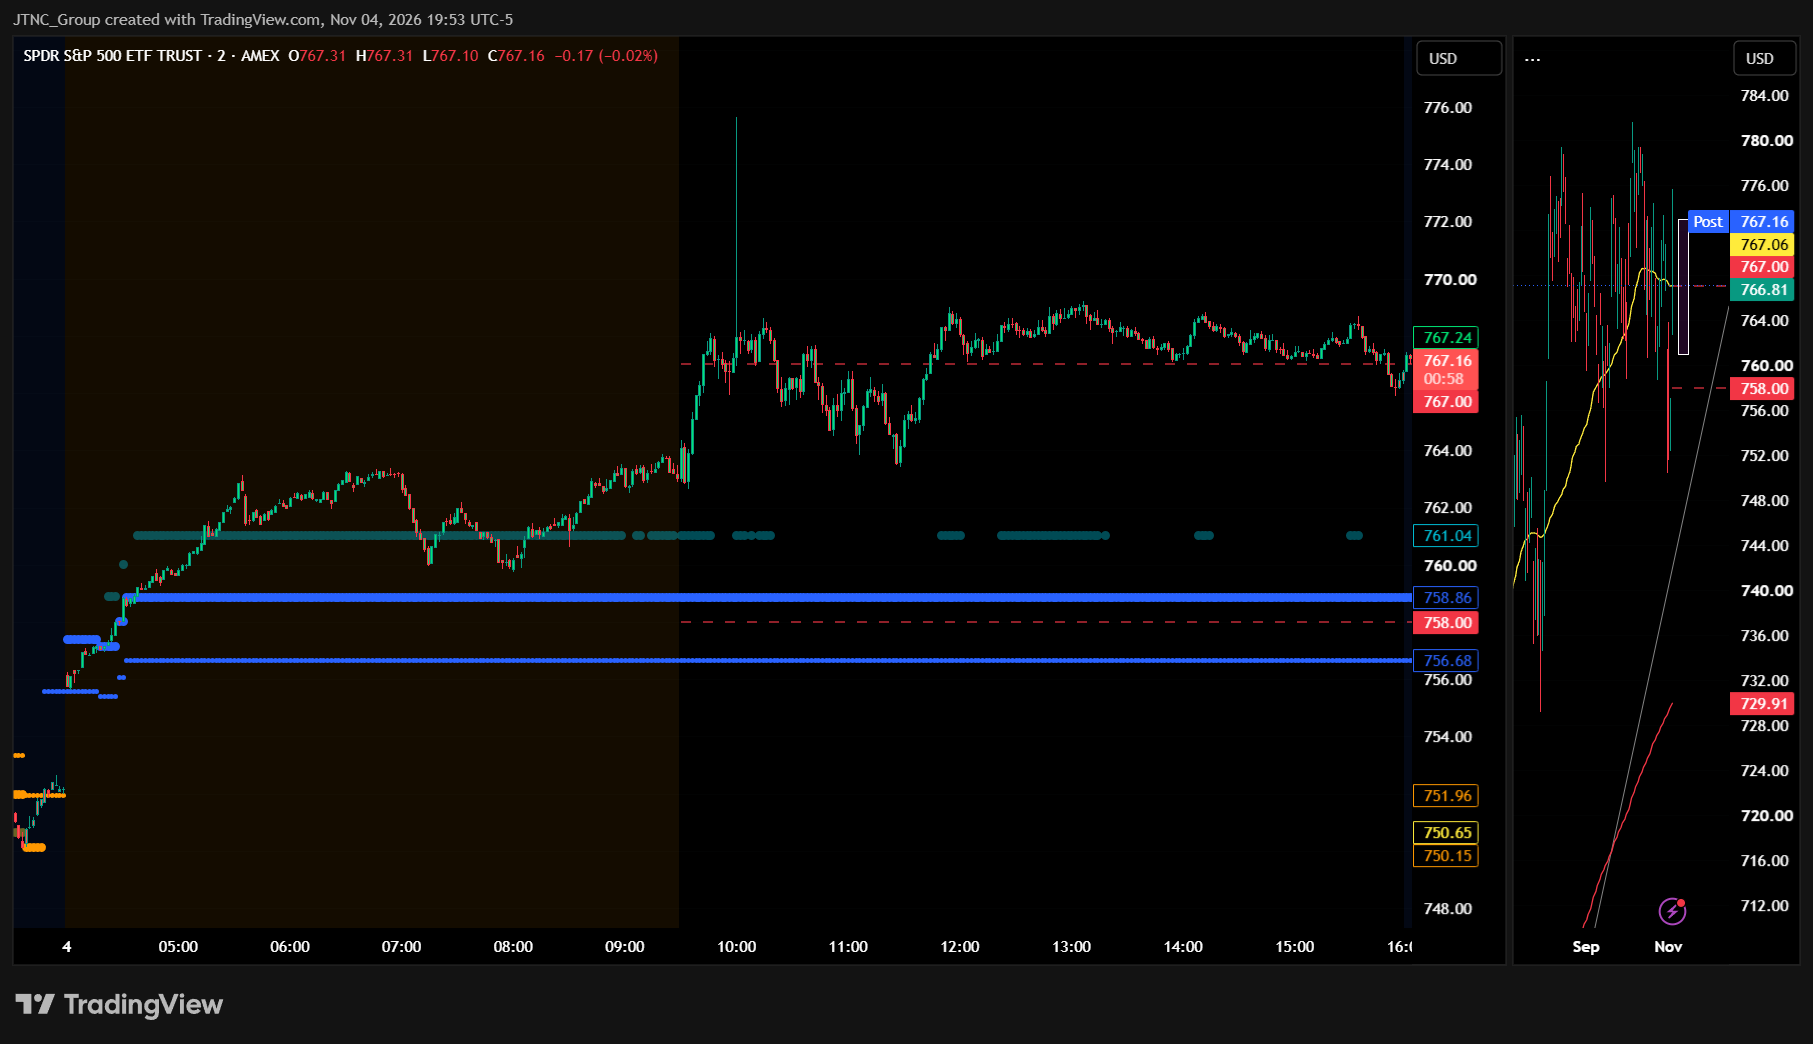
Current Market State Overview:
The MSI ended Wednesday in a Bullish Trending Market State with SPY closing at $766.81. Because SPY closed well above MSI resistance, $758.86 now flips to support for Thursday's session, with $756.68 MSI support beneath it. The MSI rescaled higher several times overnight once the election results were in, and extended targets printed above in the premarket and for much of the day session. But the MSI stopped rescaling early in the premarket and instead remained in a very narrow $2.18 bullish state into the close. That implied price would find a level where it would stall, and that level was $770, the Call wall we identified in Tuesday's Dealer Positioning. It held. Price didn't fall far, but that was the end of the move, and for the entire afternoon SPY chopped sideways in a tight range. No extended targets were printing at the close.
For Thursday, the MSI without extended targets above is implying more sideways than strongly higher prices. That said, the bulls are showing their horns, and with a break above $770 new highs are not far behind. It would not surprise us to see a bit of profit taking overnight, with SPY testing MSI resistance turned support closer to $760.
Key Levels and Market Movements:
Tuesday we stated, "Bulls want to see overnight price hold $753.21 and build on Tuesday's gains," and added, "From there they need to reclaim $755.6 and push back toward $757 major resistance with the MSI rescaling higher and extended targets printing above," while also noting, "A clean break of $757 would open the door to $760." The bulls got their script and then some. Once the election results were in, the MSI rescaled higher several times overnight into a Bullish Trending state with extended targets printing above, and SPY gapped right through $755.60, $757, and $760 before the open. It opened at $762.99 and put in its low at $762.64 just after the bell, so that clean break of $757 did far more than open the door to $760.
From there the MSI did something telling: it stopped rescaling. It held a very narrow bullish state with extended targets printing above through the morning, which is the MSI's way of saying the trend is intact but running out of room. SPY climbed to the $770 Call wall, topped out at $769.22, and that was the end of the move. It didn't fall far, but it spent the entire afternoon chopping sideways in a tight range before settling at $766.81, right at its 50 DMA.
That made it a one-trade day. The trade was buying the dip after the open with the MSI in a bullish state and extended targets printing above, targeting the $770 Call wall. Once SPY reached it, profits were taken, and the sideways chop that followed offered nothing worth chasing. One trade, and it was a good one.
SPY gained 1.65% on volume of 56.95 million shares, near average, so the rally came with real participation. The VIX dropped 19.59% to 16.75, back below 20, so traders are clearly breathing easier. It was an easy day to read and execute, with the setup identified through proper context, patience, and flexibility while leveraging the MSI, premarket levels, and market structure rather than forcing trades. The MSI continues to prove its reliability as the cornerstone of our trading process.
Trading Strategy Based on MSI:
Thursday brings Unemployment Claims at 8:30 AM ET, a medium-impact release, and the calendar is otherwise light, with Friday's jobs report the next real catalyst. The MSI closed in a very narrow Bullish Trending state with no extended targets printing above, which implies more sideways than strongly higher prices on Thursday. With SPY closing well above the range, $758.86 now acts as support, with $756.68 beneath it, and there is no MSI resistance overhead, so the $770 Call wall and Wednesday's $769.22 high are the levels above.
Bulls want to see overnight price hold above Wednesday's $762.64 low and stay near the $766.81 close. From there they need to push through $769.22 and break $770 with the MSI rescaling higher and extended targets printing above. If that happens, new highs are not far behind. Bears want to see a bit of profit taking overnight that tests $758.86 MSI resistance turned support near $760. A failure there with the MSI rescaling lower and extended targets printing below would put $756.68 and $755.60 in play and signal the gap is filling.
The primary setup for Thursday is buying a dip into the $760 to $758.86 area that holds, targeting the $766.81 close and then $769.22 and $770. A failed breakout at $770 without extended targets printing above offers a quick short back toward $766.81 and $762.64. A clean break above $770 with extended targets printing above is the signal to trade with the trend, targeting the premarket levels above since there is no MSI resistance overhead. If $758.86 breaks with the MSI rescaling lower and extended targets printing below, that level flips back to resistance, and traders can sell rallies into it while targeting $756.68 and $755.60. In a very narrow state the MSI can rescale quickly, so let it confirm before pressing.
The long-term bull trend remains intact above $640 and failed breakouts and failed breakdowns continue to offer the highest-probability setups. Remain flexible, avoid trading during Ranging Market States unless a clear failed breakout or breakdown presents itself, and ensure all trades are fully aligned with MSI signals. Providing real-time insights into market control, momentum shifts, and actionable levels, the MSI when integrated with our Pre-Market and Post-Market Reports continues to sharpen execution precision and elevate trade quality. If you haven't yet integrated MSI and our model levels into your process, now is the time. Contact your representative to get started as these tools are designed to support consistency and enhance performance.
Dealer Positioning Analysis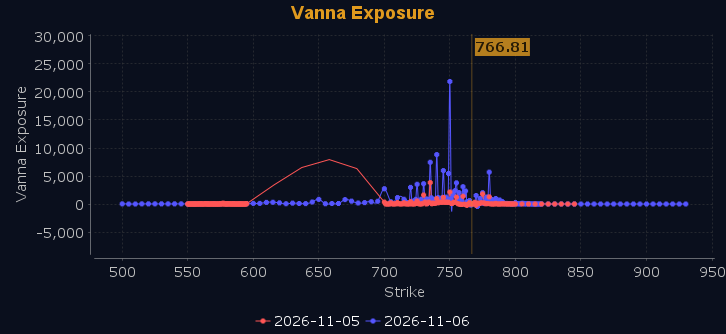
Dealers are selling SPY $767 to $799 and higher strike Calls while buying $770 Calls in very small size, indicating a modest desire to participate in any continuation of the rally on Thursday. SPY reached the $770 Call wall on Wednesday, where it found resistance. We told you Tuesday the Call wall at $770 would hold, and it did almost to the penny. Dealers have not adjusted their hedges, which implies little fear that the market will move significantly lower from these levels. The ceiling for Thursday appears to be $775. To the downside, Dealers are buying $766 to $700 and lower strike Puts in a 4:1 ratio to the Calls they're selling, displaying continued concern that prices could move lower. There is a Call wall at $770 which will act as resistance and a Put wall at $765 which will act as support, and with gamma positive at these levels, Dealers will defend them. Above $770 is bullish and below $765 is bearish, with chop and traps in between. Expect more ranging behavior on Thursday given the tight range between those levels. Dealer positioning is unchanged at slightly bearish.
Looking Ahead to Next Friday:
Dealers are selling SPY $767 to $805 and higher strike Calls and are not buying Calls at any strike, nor are they selling ATM Puts, implying they are unsure which way the market may trade into Friday. They were ready for Wednesday's rally, as we stated Tuesday. The ceiling for the week appears to be $780. To the downside, Dealers are buying $766 to $705 and lower strike Puts in a 4:1 ratio to the Calls they're selling, so they remain heavily hedged. There is a Call wall at $776 which will provide resistance, with a Put wall at $745 which will provide temporary support. Gamma is currently positive, so a move to $776 will likely be met with heavy resistance and is likely to mean revert. But gamma shifts to negative should price dip below $764, so the levels below that are unlikely to hold. Below $760 is bearish and above $770 is bullish, with chop and traps in between. For the week Dealer positioning is unchanged at bearish. We advise reviewing Dealer positioning daily for directional clues. These positions evolve quickly and tracking them is essential for staying ahead of shifting market sentiment.
Recommendation for Traders
Buy dips near $765, targeting $770 and $772, with stops below $763.
Unemployment Claims at 8:30 AM ET shouldn't move much, but keep size disciplined and review the premarket analysis posted before 9 AM ET for any changes in the model's outlook and Dealer Positioning.
Good luck and good trading!
