Market Insights: Friday, November 14th, 2025
Market Overview
Stocks closed mixed on Friday, capping off a volatile week that saw one of the sharpest selloffs in over a month followed by an attempted stabilization in equities. The S&P 500 slipped 0.01%, the Dow lagged with a 0.65% decline, and the Nasdaq edged up 0.13% as large-cap tech staged a partial recovery. Friday’s session started weak but regained ground throughout the day, as investors weighed ongoing uncertainty around the Federal Reserve’s next move and braced for the long-delayed September jobs report, now scheduled for release next Thursday.
The market mood remains unsettled. The end of the six-week government shutdown this week has restored some policy stability, but delayed economic data continues to cloud the Fed’s outlook. Rate cut odds for December have collapsed to below 50%, down from 95% just one month ago, after multiple Fed officials, including Minneapolis Fed President Neel Kashkari, voiced concerns about lingering inflation. Traders are now increasingly cautious about assuming a dovish pivot, which has added to market volatility and risk-off positioning.
Tech shares, which led Thursday’s brutal selloff, attempted a comeback. Nvidia rebounded 1.82% to lead the Magnificent Seven, while Tesla and Microsoft also finished higher after early weakness. Tesla notably reversed a sharp morning selloff that briefly sent it below $400 before going green. Apple and Meta were the weakest of the group, continuing their recent declines. Elsewhere, Bitcoin extended its slide, dropping 4.38% to close below $94,500, its lowest level in over six months. The recent slide has now taken crypto more than 20% off its October highs.
With the September jobs report now confirmed for next Thursday and FOMC minutes coming Wednesday, the path ahead will likely remain volatile and reactionary. Markets appear caught between the desire to stabilize and the lack of a clear macro catalyst to define direction. Barring a decisive breakout, traders should expect range-bound action dominated by headline risk and fading intraday momentum.
SPY Performance
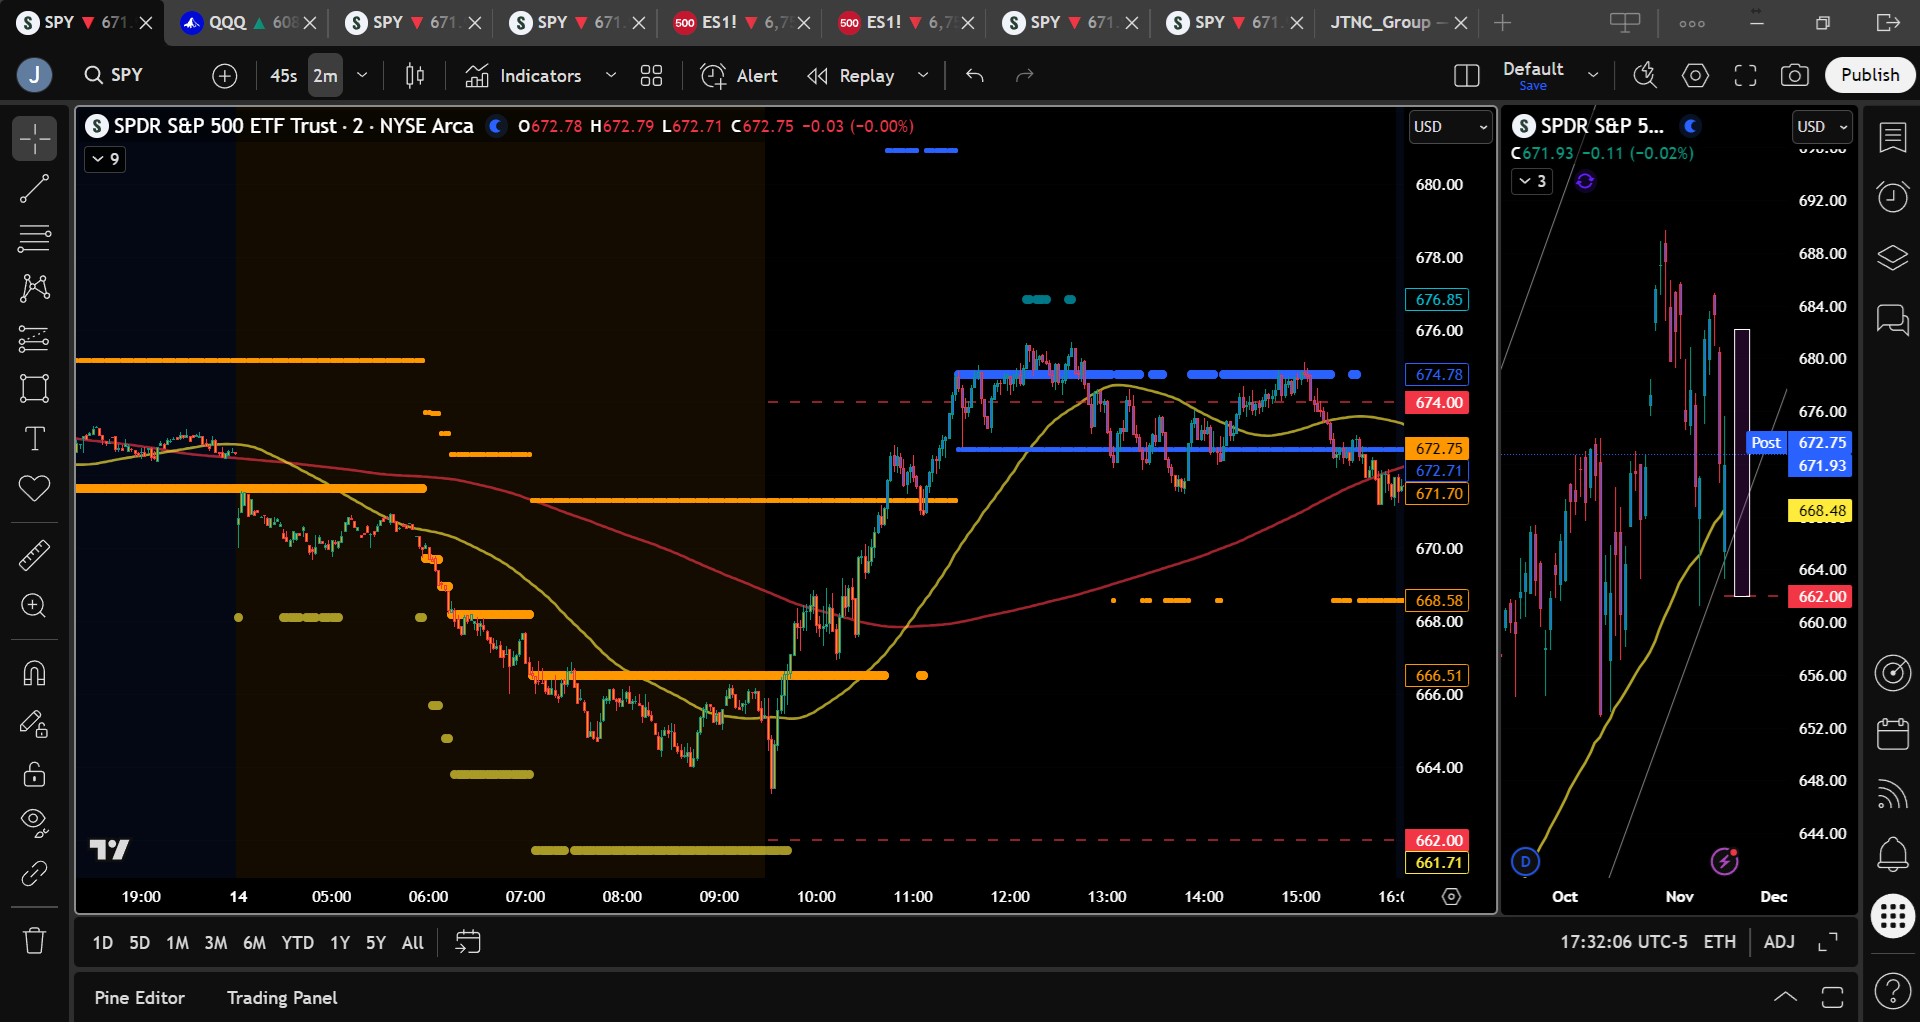
SPY opened at $665.34 and tested support early, falling to $663.27 before reversing higher. Buyers stepped in near last Friday’s lows and helped push SPY to an intraday high of $675.66 before settling at $671.94, down just 0.01% on the day. Volume surged to 90.25 million shares, well above average, confirming strong participation. Although SPY closed below the $680 pivot for the third straight session, the recovery off the lows suggested the bulls were not yet ready to cede full control.
Major Indices Performance
The Nasdaq managed a 0.13% gain, reversing some of Thursday’s sharp losses, while the S&P 500 closed essentially flat, down just 0.01%. The Dow underperformed with a 0.65% loss, weighed by weakness in financials and industrials. The Russell 2000 outpaced its large-cap peers with a 0.17% gain, as small caps bounced from deeply oversold conditions.
Notable Stock Movements
Most of the Magnificent Seven finished red again on Friday, but Tesla, Microsoft, and Nvidia bucked the trend. Nvidia led with a 1.82% gain, regaining leadership status after falling sharply earlier in the week. Tesla posted a strong reversal after breaking below $400, while Microsoft closed modestly higher. Meta was flat on the day, while Apple and Alphabet posted mild losses. The group’s mixed performance signals a market still grappling with whether leadership names are in a durable correction or just pausing for consolidation.
Commodity and Cryptocurrency Updates
Crude oil gained 2.03% to settle at $59.88, pushing closer to the long-anticipated $60 target. Our model has projected this level for weeks and maintains the view that as long as oil holds above $56, a rally toward $70 remains in play. Gold fell sharply, dropping 2.58% to $4,086 as real yields and the dollar rose. Bitcoin declined another 4.38% to $94,487, continuing its breakdown from the October peak. The total drawdown now exceeds 20%, placing crypto firmly in correction territory. That said, we have begun to build a position in Bitcoin at this level and will continue to add as price drops or rallies back to $100K.
Treasury Yield Information
The 10-year Treasury yield climbed 1.27% to close at 4.149%, reflecting continued skepticism that the Fed will ease policy soon. While still below the 4.5% red zone for equities, this latest bounce in yields remains a headwind. A move above 4.8% would likely trigger more aggressive equity selling, while 5% remains a danger threshold that could lead to a 20% or greater correction.
Looking Ahead
Next week brings long-awaited macro data. Wednesday’s FOMC minutes and Thursday’s September jobs report are the first major releases post-shutdown and are likely to set the tone for the rest of November. Until then, markets may continue to chop in a broad range, defined by SPY’s resistance near $680 and support around $662. If SPY can reclaim $675–$677 early next week and hold, bulls may regain short-term control. But failure to defend $665 would raise the risk of a test below $660, especially if leadership names and crypto extend their weakness. Sentiment remains fragile, and technical levels will be critical for gauging direction in the absence of new economic data.
Market Sentiment and Key Levels
SPY closed above the redrawn lower boundary of its bull channel from the April lows, a positive technical development that suggests the broader bullish structure remains intact despite near-term damage. However, Friday marked the third consecutive close below $680, which keeps the short-term tone neutral to bearish. Resistance sits at $675, $679, and $680. Support lies at $670, $667, $665, and $660. A breakout above $680 could reset bullish momentum, while a break below $665 opens the door to $662 and potentially $659. The VIX eased 0.85% to 19.83, still elevated but pulling back slightly after the reversal off Friday’s lows.
Expected Price Action
SPY’s projected range for Monday is between $665 and $678. The Put side continues to dominate, pointing to a high likelihood of trending action with brief pauses. Price rebounded sharply from the $663.50 zone Friday morning and may attempt a move to $675 early next week. If bulls can build on Friday’s recovery and reclaim $675–$677, a test of $680 is likely. But failure at those levels could turn into a fade, with price retesting $665 or lower. The market is still waiting on a catalyst to resolve the current tug-of-war.
Trading Strategy
Trade the levels, not the bias. Bulls need a close above $677 to regain short-term control. Sellers will look to fade moves into $675–$680 unless volume and leadership confirm a breakout. Buying dips into $665 or $662 remains viable for tactical longs if intraday reversal signals confirm. Momentum remains fragile, and failed breakouts and breakdowns offer the best setups. Keep size tight and stops tight, as whipsaws remain a risk.
Model’s Projected Range
SPY’s projected maximum range for Monday sits between $662 and $682.25, with the Put side dominating in a wide and expanding band that signals trending action with brief periods of chop. With no economic data due until Wednesday’s FOMC Minutes, traders should continue to expect headline driven volatility. Overnight the market moved lower, breaking the 50 DMA and closing in on last Friday’s lows. Yet dip buyers once again stepped up at $663.50 right at the open and pushed SPY back up to close down just 0.02% at $671.93, creating another strong recovery in a market that appeared ready to break last Friday’s lows. A second close below $680 gives the bears short term control and suggests last week’s decline may not have been a one off event. Volume was fifty percent higher than average which may be viewed as a positive sign given the recovery staged by the bulls. It is still too early to determine direction, so it is likely that bulls and bears continue their battle within a wide range until an external catalyst moves the needle. The broader bull trend remains intact above $640, and the bears need significantly more downside to alter this long term structure. Overnight the bulls will attempt to push price to $675 where the first reaction will likely be a dip that must be bought to keep bullish momentum alive. If the bears push SPY back to the day’s lows a second bounce is likely but repeated tests of that level raise the odds of failure which could send price below last Friday’s lows at $661 and possibly start a bear trend, something our model does not currently see as a strong probability. Absent a major catalyst, resistance sits at $675, $679, and $680, while support sits at $670, $667, $665, and $660. Gains are likely to be capped near $680 on Monday while a break of $665 could send SPY toward $660 where support becomes thin. Crypto once again fell sharply along with most Mag stocks except Tesla, Microsoft, and Nvidia. We have warned that sustained weakness in leadership and in crypto could trigger the ten to fifteen percent correction we have been anticipating yet three days of selling is still not enough to confirm this, although continued weakness would be an early warning sign. The VIX fell 0.85% to 19.83, hovering near danger levels for equities but easing on the rally off the lows. SPY closed above the redrawn lower boundary of its bull channel from the April lows, with the model weakening the prior unsustainable trajectory but not enough to redraw the trend as bearish, leaving the broader bull structure intact.
Market State Indicator (MSI) Forecast
Current Market State Overview:
The MSI ended the session in a Ranging Market State, with SPY closing at the upper end of the range. There were extended targets both above and below the MSI today but virtually none for the entire afternoon session. Overnight with SPY moving lower to the 50 DMA and below, extended targets printed the entire time until 10 am when they stopped printing and SPY found a bottom and reversed. The MSI overnight and into the open rescaled lower several times in a wide bearish state indicating the herd was pushing price lower. But after the dip was bought, the MSI rescaled to a wide ranging state then to a narrow bullish state with extended targets which saw SPY test major resistance at $675. A slight dip into the close was enough to push the MSI back to a ranging state implying some sideways trading on Sunday and in the premarket which may test both today’s highs and lows, but once which will generally remain within a wide range between $660 and $680. MSI support is $668.58 with resistance at $674.78.
Key Levels and Market Movements:
On Thursday we wrote, “Price now appears poised for further weakness and is likely to test last Friday’s lows,” and noted, “For Friday we favor selling rallies into $680 and shorting clean breaks below $670,” while also adding, “We will also consider long entries on failed breakdowns that break today’s lows and recover quickly.” With this context, and with the MSI opening in a wide bearish state with extended targets below, our initial plan was to look for a short near MSI resistance to ride the trend toward last Friday’s lows at $661.50. But with SPY already trading near $663.20 at the open, there was no structure to lean on for a short. What did set up instead was a textbook failed breakdown at $664, followed by a rapid recovery, exactly the long setup described above. As soon as extended targets stopped printing, we went long off MSI support at $666.50 and set T1 at MSI resistance at $671.30. T1 was hit before 11 am so we set T2 at the premarket level of $674, which also hit, leaving us trailing ten percent of the position with a breakeven stop by noon. The MSI later rescaled to a bullish state, hinting at the possibility of a push toward $680, but SPY spent the entire afternoon locked in a tight range instead. We exited the remainder of our position around 3 pm at $675 and called it a day. One and done to finish a very profitable week, thanks again to having a clear plan, maintaining patience and discipline, and staying fully aligned with MSI signals, market structure, and our broader trading framework. The MSI continues to prove its reliability as the cornerstone of our trading process.
Trading Strategy Based on MSI:
Fear is creaping into the market as extreme valuations, inflation risks, and the possibility of a more hawkish Fed are no longer supportive for equities. November and December are typically the strongest months of the year, but markets tend to inflict maximum pain and it is entirely possible that this year the two best seasonal months become the two worst. That said, today delivered another dip that was aggressively bought on heavy volume. Still, with price holding below $680, the tug-of-war has begun, and the bears hold a slight near-term edge. We expect price to retest today’s highs and lows in the coming days. A break below today’s lows will open the door to $661.50, and if that level fails, price likely drops to $650 and eventually tests $640, our “line in the sand” where long-term bull control must hold. Until that break occurs, the bulls remain present and strong, and traders should also be prepared for any rally that develops. A break back above $680 is required for the bulls to regain control. For Monday we favor selling rallies into $680 and shorting clean breaks below $670 while also considering long entries on failed breakdowns that break today’s lows and recover quickly. We will only take this long setup on the next test, as repeated tests weaken support and increase the probability of a breakdown. We still lean toward the broader bullish case, but in the near term the bears are in control and must be respected until price reclaims $680. With significant economic data scheduled in the coming weeks, market direction short term depends heavily on White House headlines and evolving macro developments. As this flow of information ramps back up, volatility is expected to rise, requiring traders to stay flexible, disciplined, and focused on trading what they see. With the VIX near 20, risk remains paused until price stabilizes, and any sustained move above 23 will turn the market decisively bearish and accelerate downside momentum. The key structural threshold for the broader bull market remains $640, and only a decisive break below that level would shift long-term control to the bears. Failed breakouts and failed breakdowns continue to offer the highest-probability setups, so remain flexible, avoid trading during Ranging Market States, and ensure all trades are fully aligned with MSI signals. Providing real-time insights into market control, momentum shifts, and actionable levels, the MSI when integrated with our Pre-Market and Post-Market Reports continues to sharpen execution precision and elevate trade quality. If you haven’t yet integrated MSI and our model levels into your process, now is the time. Contact your representative to get started as these tools are designed to support consistency and enhance performance.
Dealer Positioning Analysis
Summary of Current Dealer Positioning:
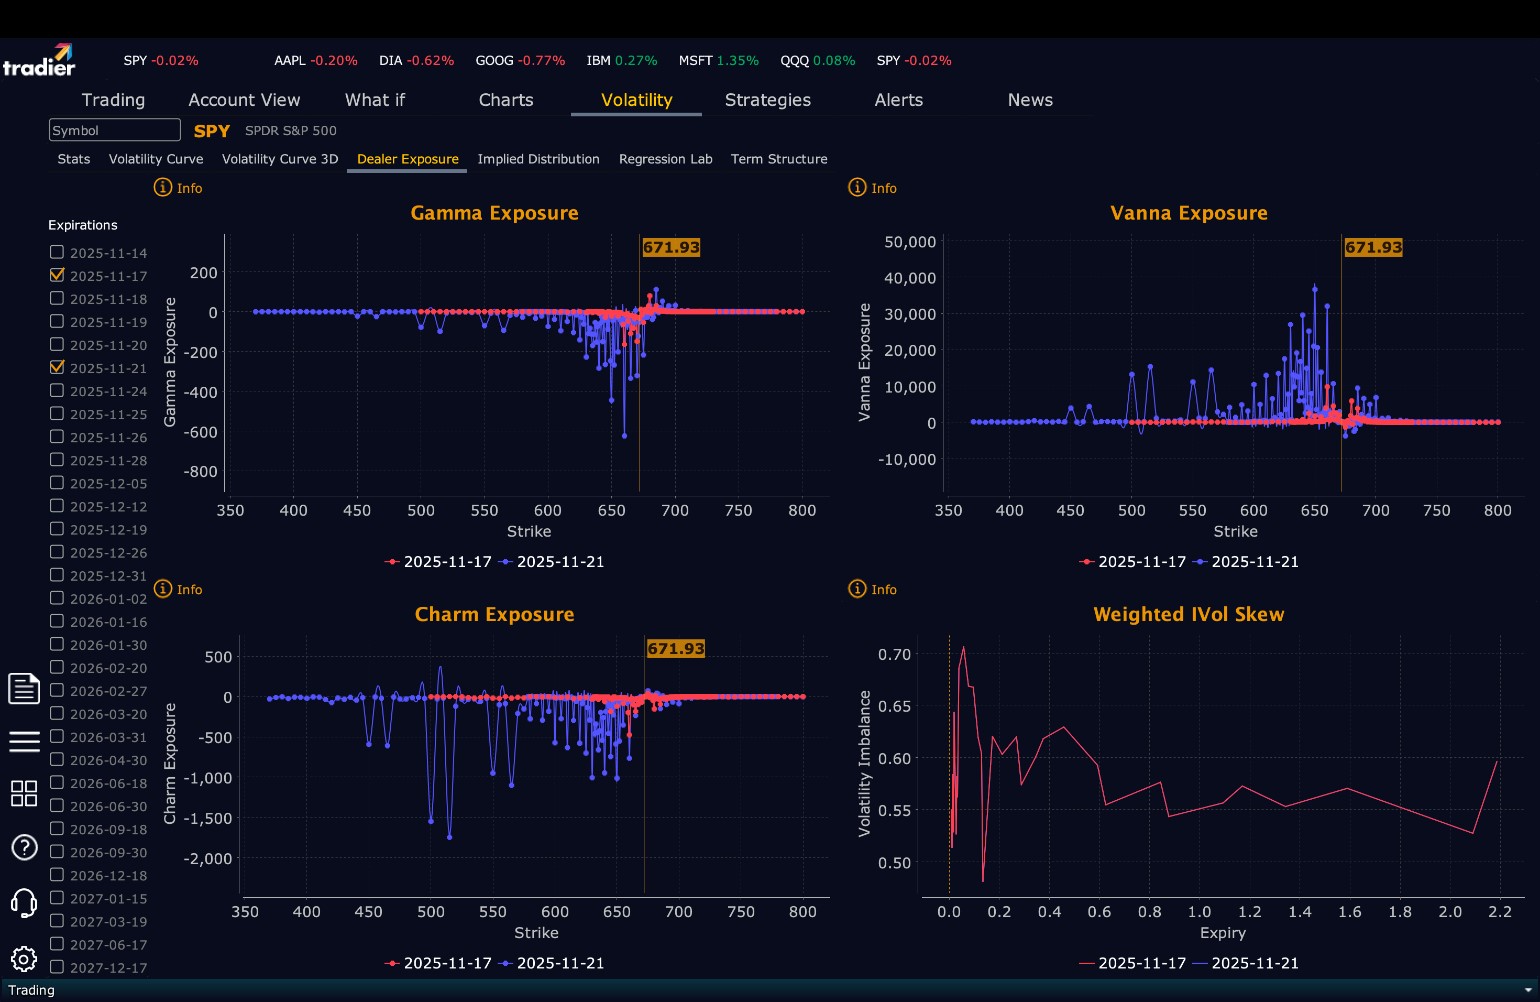
Dealers are selling SPY $676 to $705 and higher strike Calls while also buying $672 to $675 Calls implying the Dealers’ desire to participate in any rally on Monday. The ceiling for Monday appears to be $680. To the downside, Dealers are buying $671 to $600 and lower strike Puts in a 3:1 ratio to the Calls they’re selling/buying displaying little concern that prices could move much lower on Monday. Dealer positioning is unchanged from neutral/slightly bearish to neutral/slightly bearish.
Looking Ahead to Next Friday:
Dealers are selling SPY $676 to $705 and higher strike Calls while also buying $672 to $675 Calls implying the Dealers desire to participate in any rally next week. The ceiling for the week appears to be $685. To the downside, Dealers are buying $671 to $600 and lower strike Puts in a 6:1 ratio to the Calls they’re selling/buying, reflecting a market that continues to add hedges implying the Dealers belief that price may move lower. For the week Dealer positioning is unchanged from bearish to bearish but more so. We advise reviewing Dealer positioning daily for directional clues. These positions evolve quickly and tracking them is essential for staying ahead of shifting market sentiment.
Recommendation for Traders
Maintain flexibility and respect both sides of the range. Strength into $675–$677 remains a tactical short zone unless bulls break out with strong volume. Dips into $665 or $662 may offer long setups on reversal signals. Avoid directional bias and trade with discipline as volatility remains elevated. Failed breakouts and failed breakdowns offer the highest reward setups. Trade what you see, not what you think.
Good luck and good trading!
