
Market Insights: Thursday, October 8th, 2026
Market Overview
Stocks lost their footing Thursday as an oil spike revived inflation worries and chip stocks sold off on fresh AI jitters. The Dow managed to squeak out a 0.1% gain, but the S&P 500 fell 0.5% and the Nasdaq tumbled 1.3%, sliding further from Wednesday's record highs. The tech pain kicked off after the Financial Times reported that OpenAI's annualized revenue was $20 billion lower than previously estimated. That sent semiconductor giants like Nvidia, Micron, and Intel lower in afternoon trading. The Philadelphia Semiconductor Index dropped as much as 4% before trimming losses, while Arm Holdings, Intel, and Marvell Technology each fell more than 6% and Micron shed more than 5%. Oil kept markets on edge too. Brent and WTI pared gains to $104 and $91 per barrel before slipping further to $103 and $90. That pullback came after President Trump posted that "we are having productive discussions with the Islamic Republic of Iran" and that the US "will not be attacking Iran at any time prior to the Midterm Elections to be held in the United States on November 3rd." His comments followed an earlier report that he was considering a strike before the vote. As oil came off its highs, bond yields stabilized, with the 10-year easing to 5.23% and the 30-year at 5.61%. It's a reminder that the real risk from rising yields isn't just higher borrowing costs but what happens when they move too far, too fast.
Crypto felt the squeeze as well. Bitcoin sank to its lowest level in roughly three weeks before paring losses, falling 2% to around $81,000 as rising oil prices and bond yields weighed on the token. CoinGlass data showed traders liquidated $974 million in crypto over the past 24 hours, and the slide dragged Coinbase, Strategy, and Robinhood down about 1% each. On the bright side, initial jobless claims ticked down to 197,000 for the week ending Oct. 3, a sign that layoffs remain low. Investors are also gearing up for third-quarter earnings season, with PepsiCo serving as the appetizer. FactSet estimates S&P 500 earnings grew 29.5% in Q3, and if that figure holds, it would mark the third straight quarter of earnings growth above 25%.
SPY Performance
SPY opened at $774.86, gapping down below yesterday's close of $777.26 and starting the session under the $776.61 level. Buyers tried to fill that gap early and pushed SPY to a session high of $777.09, but the rally stalled just shy of the prior close, the same kind of rejection we saw a day earlier. Sellers then took over and drove SPY through the $773.61 support level and below the key $772.65 breakout line, reaching a session low of $770.44. That's where things got interesting. Buyers stepped back in and pulled SPY off the lows, reclaiming both $772.65 and $773.61 before the bell. SPY finished at $773.93, near the middle of the day's range but still below the $776.61 level.
SPY fell 0.42%, marking its second straight down day. Volume rose to 40.35 million shares, near average and a clear step up from the prior session's light participation. That shift deserves attention. Yesterday's pullback looked like easy profit-taking on fading volume, but today's heavier selling suggests sellers are getting a bit more serious. Still, the recovery off the lows softens that message. The candle has another long lower wick, showing that buyers keep showing up when SPY dips, even after support briefly gave way. The VIX rose 2.19% to close at 15.41, pushing back above the 15 level. That's not alarming on its own, but it signals traders are starting to pay a little more for protection as the market cools off. The bigger picture remains constructive but less comfortable than it was a day ago. SPY briefly broke below its breakout level, yet it couldn't hold there, and closing back above $772.65 keeps the uptrend technically intact. Going forward, today's low of $770.44 is now the most important support to watch, since another test of that area on heavier volume could open the door to a deeper pullback. On the upside, SPY needs to reclaim $776.61 and then push through $777.26 to show that buyers have regained control. Back-to-back failures just below the prior close show that sellers are defending that zone, so clearing it would be a meaningful win for the bulls. Until that happens, expect some choppy back-and-forth as the market works off its recent run.
Major Indices Performance
The Dow took the top spot, edging up 0.1% and bouncing back after yesterday's drop snapped its four-session winning streak. Energy came back to the rescue as crude ripped higher, giving the old-economy names the lift they lacked last session. It wasn't a big move, but finishing green while tech got hit shows blue chips can still act as a shelter. Value buyers returned just one day after stepping away, which keeps the rotation story alive even if it's moving in fits and starts.
The Russell 2000 squeaked out a 0.03% gain, ending its two-day losing streak after back-to-back sharp declines. Small-caps got some breathing room as borrowing-cost pressure eased a bit, giving rate-sensitive names a chance to stop the bleeding. A flat finish isn't a comeback, but holding steady on a day when growth stocks cracked is a quiet sign that sellers in the riskier end of the market may be running out of steam. Traders will want to see real follow-through before calling a bottom.
The Nasdaq was the clear laggard, sliding 1.25% for its second straight loss and giving up the leadership role it held yesterday. Mega-cap tech went from defender to drag, with heavy selling in chip names pulling the whole index lower. That's a sharp reversal from the shallow dip last session, and it turns what looked like a breather into something traders need to watch more closely. The S&P 500 landed in between, weighed down by its heavy tech exposure. The VIX rose 2.19% to close at 15.41, showing nerves are creeping back as growth leadership stumbles with Friday's consumer sentiment and inflation expectations data on deck.
Notable Stock Movements
NVIDIA took the hardest hit in the Magnificent Seven, sliding 2.94% to lead the group lower. In the last session NVIDIA was already sitting out the rally, and today that hesitation turned into real selling. When the market's favorite AI name posts the biggest drop in the group, traders notice. It suggests money is coming out of the crowded AI trade, at least for now, and that kind of move can drag sentiment across the whole tech complex.
The group finished mostly red, with Apple the lone bright spot, up 1.11%. That means Amazon's two-day leadership streak came to an end, and Meta added a third straight losing session to its recent slide. Apple holding green while the rest sold off shows investors still want some mega-cap exposure but are getting pickier about where they park it. Apple tends to act as a defensive play within big tech, so the rotation into it looks more like caution than confidence. One green name out of seven is not a healthy picture for a group that usually carries the market.
The wider market made the tech weakness obvious. The Nasdaq fell 1.25%, while the Dow eked out a 0.1% gain and the Russell 2000 edged up 0.03%. That's a sharp reversal from the prior session, when tech was the safe harbor and small caps took the beating. This time the money rotated out of growth and into the rest of the market. The VIX rose 2.19% to 15.41, so nerves are creeping higher but nowhere near panic. With the Prelim UoM Consumer Sentiment and Inflation Expectations hitting Friday morning, big tech needs a steady read to regain its footing. If NVIDIA bounces and the selling stays contained, this looks like a healthy rotation. If the weakness spreads to Apple too, the bears will have a much stronger case.
Commodity and Cryptocurrency Updates
Crude oil snapped right back, jumping 2.78% to close at $90.73. That more than erased the prior session's mild dip and pushed prices to fresh highs for this run, a clear sign that buyers are still firmly in control. Crude has rallied well above $70 and far beyond longer-term model expectations, and the geopolitical tensions and supply disruptions behind this move show no signs of fading. Every pullback keeps getting bought, which tells you the market is still pricing in real risk to supply. If energy prices stay this elevated, they will keep feeding into inflation and could seriously complicate the Fed's path on rate policy.
Gold bounced back with conviction, rising 1.39% to close at $4,198. That recovered nearly all of the prior session's losses and put the metal back within striking distance of recent highs. The quick rebound shows dip-buyers are still willing to step in when prices pull back, which is a healthy sign during a consolidation phase. The long-term drivers remain firmly in place: inflation uncertainty, steady central bank buying, and a constant stream of geopolitical headlines all continue to support demand. If gold can build on this move and hold above recent support, the setup for the next leg higher looks increasingly constructive.
Bitcoin's losing streak rolled on, falling 1.60% to close above $81,944. That makes five straight down days, and while today's drop was a bit smaller than the prior session's, sellers remain firmly in charge. Buyers still aren't showing up with any real urgency, and the cryptocurrency continues to grind toward the lower end of its recent range. That kind of steady bleeding can wear down confidence over time. Until Bitcoin can string together a few solid green sessions and reclaim lost ground, the path of least resistance looks lower rather than higher.
Treasury Yield Information
The 10-year Treasury yield pulled back today, falling 0.87% to close at 5.230. That's a bigger drop than the brief dip we saw earlier this week, and it gave the bond market some breathing room after yesterday's push higher. One session doesn't make a trend, though. The 10-year is still parked in the most dangerous zone on the framework, and sellers have shown they're quick to return after every pause.
Measured against each threshold, the cushion shrank but didn't disappear. The 4.5% level where equity valuations start to feel the squeeze now sits 73 basis points below today's close. The 4.8% mark that usually sparks broader selling is 43 basis points back. The 5% line for serious risk is cleared by 23 basis points. Most importantly, the 10-year sits just 3 basis points above 5.2%, the level where the framework calls for a 20% or greater correction. That's the thinnest margin we've seen in this run, and one more decent move lower would push the 10-year back under the correction line.
The equity reaction was split. Small caps finally caught a break, with the Russell 2000 edging up 0.03% to snap a two-day losing streak, and the Dow added 0.1%. That fits the playbook, since rate-sensitive names are usually the first to steady when borrowing costs ease. The Nasdaq told a different story, sliding 1.25% as tech sold off for reasons that had nothing to do with rates. That's a reminder that falling yields don't automatically rescue stocks when leadership is cracking. The VIX rose 2.19% to 15.41, so options traders added a bit of protection even as the bond market calmed down.
Friday brings the Prelim UoM Consumer Sentiment and Prelim UoM Inflation Expectations, both at 10:00 AM ET, and the inflation piece matters most for bonds. With energy prices running hot, a jump in consumer inflation expectations could send the 10-year right back toward the 5.31% high from this run. A softer reading might be enough to knock yields below 5.2% and ease the correction warning. Watch that 5.2% line closely, because a close beneath it would be the first real crack in this rate surge. Real relief still requires a sustained move below 5%. Small caps got a breather today, but they'll need the bond market to keep cooperating to turn it into anything more.
Previous Day’s Forecast Analysis
Thursday's forecast from our AI model projected a maximum SPY range of $773 to $782. With the Call side dominating an expanding band, the model called for trending price action with intermittent chop. The bias heading into the session was neutral to slightly bearish because SPY had settled just below the midpoint of the projected range after Wednesday's contained pullback. That cautious lean was offset by the Call-heavy band and a quiet fear gauge, with VIX down 0.27% to 14.97. The forecast described Wednesday's dip as more of a breather than a breakdown. It also warned that price was starting the day right on top of first support, which left little cushion if FOMC Member Waller's 4:30 AM ET remarks surprised the market. Unemployment Claims at 8:30 AM ET were not expected to move things.
The key resistance was $780, a major round number and the heaviest overhead level in the premarket setup. A break above it targeted $782, with $785 and $787 as further resistance where supply was expected. On the downside, $775 was the line to defend. It was Monday's breakout level and the floor of the entire run. Below that, the levels to watch were $772, $770 (the old two-week ceiling turned floor), and $768, with a slide toward $765 possible if $768 failed. Structural support near $640 kept the broader dip-buying thesis intact.
The trading strategy favored the long side. The plan was to buy dips at $775 and treat a drive through $780 as the cleanest long trigger. Targets were $782, then $785, with runners aiming for $787, and stops went below $773. Shorts were the secondary setup, fading a stall at $780 with targets of $775 and $772 and stops above $782. A break of $772 was shortable at reduced size toward $770 and $768. Bear-side size was to stay at roughly half the bull side. Overall position sizing was set at 80-90% of normal until the Waller reaction was priced in. A VIX move above 16 would call for tighter stops, and a move through 17 would mean cutting size toward half.
Market Performance vs. Forecast
Thursday's session followed the forecast's cautious lean. The model entered the day with a neutral-to-slightly-bearish bias, and SPY finished lower, confirming that the directional call was on target. The forecast warned that price was starting the day sitting right on top of the model's first support, with little cushion if Waller surprised. It also said a clean break below $775 likely sends price sliding toward $772, with $770 next. That roadmap played out closely. SPY opened at $775 territory's doorstep, at $774.86, and sellers carried price through $772 and down to a session low of $770.44. That dipped beneath the bottom of the projected $773 to $782 range. The model does not account for unpredictable external events, and the early Fed commentary the forecast flagged as the day's wildcard introduced volatility that exceeded the model's base case scenario. Even so, the forecast identified $770, the old two-week ceiling turned floor, as the spot where bulls should make a real stand, and that is exactly where buyers showed up. SPY bounced off that zone and closed at $773.93, down 0.42% and back inside the projected range.
On the rising market side, the forecast's emphasis on patience paid off. The cleanest long trigger required a pullback that held $775 and then drove through $780. That sequence never developed. The session high of $777.09 stalled well short of $780, so the $782, $785 and $787 targets stayed out of reach. Because the long setup never triggered, the stop below $773 never came into play. The warning not to chase without a clean retest of $780 kept bull-side traders out of a session that never built upside momentum.
The falling market scenario was framed as the secondary setup, and it delivered. The $780 fade level was never reached, but the breakdown short below $772 at reduced size triggered just as the playbook described. Sellers pressed price to within striking distance of the $770 target before buyers stepped in. The $768 level and the $765 runner target went untested, which supports the forecast's view that a deeper selloff was not the base case. The advice to cover in layers into support and not overstay fit a session where dip-buyers defended the forecast's support structure on near-average volume.
The VIX rose 2.19% to 15.41, pushing back above 15 but staying below the 16 line the forecast set as the trigger for reducing net long exposure and tightening stops. That kept the 80-90% position sizing guidance in force all session. The guidance to skip the first premarket spike and let the open confirm direction was well suited to a day that started under pressure. The slightly bearish bias, the $775 breakout level, the $772 breakdown trigger, the $770 floor and the $780 ceiling all gave traders clear reference points in a Fed-influenced session. The framework continues to adapt to shifting conditions and gives traders a reliable structure for managing risk and spotting opportunity in the sessions ahead.
Premarket Analysis Summary
The premarket analysis, posted before the opening bell, framed the expected move between $766 and $779, with $780 marked as max upside and $766 as max downside. The tape stayed put-dominated for a second straight session, with spot at $773.85 after another gap lower. This time, price slipped through $775 and the floor of last week's breakout, a sharper move than Wednesday's dip that got bought straight back to $777. That earned a cautious, bearish-leaning bias. The analysis noted that the expected move priced more room below than above, and that two gap-downs in a row were putting the buy-the-dip pattern to the test with one session left in the week. The defining level was $774, right where spot was sitting and the heaviest concentration on the board. Holding above it would let Wednesday's recovery repeat, while losing it cleanly would hand sellers the ball. Above $774, $775 was where the tape would begin to repair, $777 was Wednesday's close and the next decision point, $778 was the heaviest resistance bulls really needed, and $780 stood as max upside. On the downside, $773 was the first level to watch, and $772 was the heaviest battle below, where a clean break could get ugly fast. Under that, $770 was the point of last hope as the old two-week ceiling turned floor, and $766 sat at the bottom of the expected move with heavy support just beneath it.
The session gave both sides a turn and ended right back on the pivot. SPY opened at $774.86, just above the $774 line, and buyers got their shot at the upside script. Price reached $777, the decision point, and topped out at a high of $777.09. It never got close to the $778 resistance, and $780 stayed well out of reach. Sellers had their own run, too. They pushed through $773 and broke the $772 battle zone, and the drop accelerated just as the analysis warned a put-dominated tape would. The slide finally stopped at a low of $770.44, holding the $770 point of last hope by less than a point and keeping $766 out of play. SPY closed at $773.93, down 0.42%, on 40.35M shares of near-average volume. The VIX rose 2.19% to 15.41, a modest bump in caution after the deeper flush. Finishing a hair under the $774 pivot left neither side with a clean win. Buyers defended $770, but they couldn't recover the breakout zone. Heading into Friday, a reclaim of $774 and $775 puts $777 back in focus, while another break of $772 would likely send price straight back to test $770.
Validation of the Analysis
Today's session was a clean demonstration of the premarket framework mapping out both halves of a two-sided tape. The analysis called $774 "the defining level" and "the heaviest concentration on the board," and it laid out a simple rule: "hold above it and yesterday's recovery can repeat, lose it cleanly and sellers have the ball." SPY opened at $774.86, right on top of that pivot, and the session spent the day swinging around it in both directions. On the upside, the notes said "Hold 774 and 777 is the test," and that test arrived almost to the penny. SPY printed a high of $777.09, tagging $777, the level flagged as "yesterday's close and the next decision point." It never reached $778, which the analysis named "the heaviest resistance overhead and the level bulls really need," and $780 at the top of the board was never in play. Bulls got their test and failed it exactly where the map said the real work would begin.
The downside script played out with the same precision. The analysis warned that "a clean break of 772 could get ugly fast" and that losing it meant "expect a fast trip to 770, then a real fight there." Sellers pushed SPY through $773 and $772 and drove it to a low of $770.44, just above $770, the "point of last hope" and "the two-week ceiling that turned into the floor of this run." That floor held, and the real fight the analysis promised showed up right where it was supposed to. Buyers defended the round number, $766 at the bottom of the expected move stayed untouched, and the whole session stayed inside the projected 766 to 779 range. SPY settled at $773.93, down 0.42% and finishing almost exactly on the $774 pivot that the analysis called the heart of the board. The VIX rose 2.19% to 15.41, a measured move that fit the put-dominated tone of the morning notes. Fear crept higher, but the reading confirmed a pressure test, not a panic.
The trading opportunities were well defined on both sides. Traders who respected the "hold 774" signal off the open had a clear long with $777 as the natural target, and the "next decision point" language told them exactly where to take profits before $778 resistance could do any damage. On the other side, the break of $772 was the short trigger, and the "fast trip to 770" call handed traders a precise target. That same $770 zone then became the long entry of the session. Buying near the "point of last hope" gave traders a tight risk point, and the bounce back to the $774 pivot captured a solid chunk of the day's $6.65 low-to-high range. Just as important, the framework kept traders disciplined at the extremes. With $770 holding and $778 never reached, there was no signal to bet on a collapse toward $766 or a breakout toward $780. The test at $777, the break of $772, the defense of $770, and the close back on $774 all lined up with the levels the analysis laid out before the bell.
Looking Ahead
Friday's calendar is light on blockbuster data, but traders still get one important checkpoint on the consumer. At 10:00 AM ET, the University of Michigan releases its Prelim Consumer Sentiment reading alongside its Prelim Inflation Expectations survey. Both are rated medium impact, but they arrive together and give Wall Street a fresh look at how everyday Americans feel about their finances, the job market, and the direction of prices. Consumer spending drives a huge share of the economy, so a strong sentiment number would suggest households are still willing to open their wallets, which could support retail and consumer discretionary names. A weak reading would raise worries that people are pulling back. The inflation expectations piece may matter even more, because the Fed watches it closely. If consumers expect prices to keep climbing, it could cool hopes for further rate cuts and pressure rate-sensitive areas like tech and small caps. A drop in expectations would do the opposite.
Since neither release is high impact and both land 30 minutes after the open, the first half hour of Friday's session will likely trade on positioning and leftover momentum from Thursday. Once the numbers hit at 10:00 AM ET, expect a quick reaction that could reshape the tone for the rest of the day. Give the market a few minutes to digest the data before jumping in, since early moves on survey releases can reverse quickly. Heading into the weekend, it also makes sense to think about how much risk you want to carry over two days without trading. Keep positions sized sensibly, stay disciplined with stops, and let the price action confirm your view before committing.
Market Sentiment and Key Levels
The bears took control of Thursday's session, though the damage stayed contained and the bigger bull trend is still standing. SPY slipped modestly after an early push higher faded, and while buyers did step in off the lows to trim the losses, sellers set the tone for most of the day on near-average volume. The real story was under the surface. The Nasdaq absorbed the heaviest blow, falling 1.25%, while the Dow eked out a 0.1% gain and the Russell 2000 finished essentially flat with a 0.03% gain. That is a sharp reversal from Wednesday, when tech held up best and small caps lagged. This time money rotated out of megacap growth and into steadier corners of the market. That kind of rotation is not outright panic, but when the leadership group that has been carrying the rally starts to stumble, the market loses its most reliable engine. Bitcoin's slide adds to the risk-off undertone. Fear is starting to creep back in, too. The VIX rose 2.19% to 15.41, a sign that traders are reaching for protection heading into Friday's data.
SPY remains trapped in the $772 to $775 box that has defined recent trading, and first resistance sits at $775. A clean break above that level should target $778, with $780 and $785 waiting if buyers regain momentum. On the downside, first support at $772 is the line to watch. Losing $772 opens the door toward $770, followed by $767 and $765. If $765 gives way, there is little to keep price from falling toward $760. For longer-term bulls, the uptrend remains firmly intact well above structural support at $640, so the broader backdrop is still a dip-buying environment as long as those key levels hold. Friday's projected maximum range runs from $769 to $779, with the Put side dominating in an expanding band that points to trending price action mixed with intermittent chop. The key catalysts are the Prelim UoM Consumer Sentiment and Prelim UoM Inflation Expectations, both due at 10:00 AM ET and rated medium impact, so expect a possible jolt mid-morning. With energy prices climbing and yields still elevated, a hot inflation expectations reading could quickly test $772, while a softer print could give buyers the spark they need to finally clear $775. With the Put side in control, we favor shorting rallies near $775 rather than buying into weakness. Keep stops disciplined above $778, watch whether tech weakness spreads into the broader market, and let price prove it can break out of this tight box before adding size.
Expected Price Action
Friday's session brings actionable intelligence generated by our AI model, which projects SPY's maximum range at $769 to $779. With the Put side dominating in an expanding band, the model is calling for trending price action with intermittent chop. The calendar is light early, but the action picks up mid-morning. Prelim UoM Consumer Sentiment and Prelim UoM Inflation Expectations both hit at 10:00 AM ET. Both are rated medium impact, but the inflation expectations number could jolt the tape if consumers are bracing for higher prices. Thursday's session marked a second straight gap lower. This time sellers pushed through the floor of last week's breakout, and tech leadership dragged on the tape. The buy-the-dip pattern that rescued Wednesday is now being tested with one session left in the week. SPY settled just below the midpoint of the projected range, which gives us a neutral-to-slightly-bearish bias heading into Friday. That cautious lean is reinforced by the Put-heavy band and a fear gauge that ticked higher. VIX rose 2.19% to 15.41, a sign that traders are starting to pay up for protection. Price is still boxed in the tight $772 to $775 range that has defined recent trading, and the consumer data gives the market a real shot at breaking out of it.
The first test for Friday is $775, the level where the tape begins to repair and exactly where we favor shorting rallies. If buyers push through, the next target is $778, which was the heaviest resistance overhead in the premarket setup and the level bulls truly need. Beyond that, $780 and $785 stand as overhead resistance where any extended rally should run into supply. On the downside, $772 is where the heaviest battle sits, and a clean break there could get ugly fast. Losing it likely sends price sliding toward $770. That's the old two-week ceiling that turned into a floor, and it's the point of last hope for bulls. Below there, $767 comes into view. If the lowest support at $765 gives way, there is little to keep price from falling toward $760. The bigger picture remains healthy, with SPY trading well above structural support near $640, so this is still a dip-buying market on a broader timeframe. In the short run, the playbook is simple. Watch the 10:00 AM reaction to the consumer data, because it may decide which side of the box breaks. A push above $775 that holds opens the path toward $778. A failure at $775 keeps the short-the-rally trade in play. Losing $772 means a trip toward $770 could come quickly, and in a Put-dominated tape, breaks tend to accelerate rather than stall.
Trading Strategy
The VIX rose 2.19% to 15.41, popping back above the 15 line it had been hugging. That's not panic, but it tells us traders are starting to pay up for protection as tech leadership wobbles. The key event is the Prelim UoM Consumer Sentiment and Inflation Expectations reports, both at 10:00 AM ET. A hotter inflation expectations number could hit an already nervous tape, while a soft read could spark a relief bounce. Keep position sizing in the 80-90% of normal range until the 10:00 AM reaction is fully priced in. A VIX push through 16 is the signal to cut net long exposure and tighten stops to the 0.5-0.75% range from entry, while a jump through 17 means cutting size toward half. Don't trade the first spike off the data. Let the market show its hand before you commit capital.
In a rising market scenario, $772 is the level bulls have to defend, but treat longs as the secondary setup today. A dip that holds $772 and then reclaims $775 is the cleanest long trigger, since breaking above that ceiling flips the tight box in the bulls' favor. The first profit target is $778, with a secondary target of $779 at the top of the projected range if momentum builds and the VIX slips back below 15. Runners can aim for $780, but treat that as a bonus since it sits beyond the projected range. Stops on longs belong below $769, the bottom of the projected range, because losing that level means the floor is giving way. With the Put side in control, keep bull-side size at roughly half the bear side, and don't chase a breakout into $778 without a clean retest of $775.
In a falling market scenario, shorting rallies near $775 is our preferred setup. A bounce that stalls at $775 and rolls over is the primary short trigger, especially if the VIX holds above 15 while price struggles to make headway. The initial profit target is $772, with $770 in play if sellers press through first support. Stops on shorts belong above $779 to guard against a squeeze through the top of the projected range. If the 10:00 AM data sparks a selloff and $770 breaks, that move is shortable on a retest, targeting $767 and then $765. Should $765 give way, there's little to keep price from sliding toward $760, but that's a runner target only, not the base case. With the Put side dominating an expanding band, bear-side size can lead. Cover in layers into support, because the long-term bull trend remains intact above $640 and dip-buyers have been quick to step in. A VIX that drops back below 15 is your cue to take profits and step aside.
Model’s Projected Range
SPY's projected maximum range for Friday is $769 to $779, with the Put side dominating in an expanding band that suggests trending price action with intermittent chop. Friday brings the Prelim UoM Consumer Sentiment and Prelim UoM Inflation Expectations, both due out at 10:00 AM ET and rated medium impact, so expect a possible jolt mid-morning as traders digest the consumer's mood and inflation outlook. SPY closed at $773.93, down 0.42%, after opening at $774.86, pushing up to a high of $777.09, then sliding to a low of $770.44 before recovering some ground into the close on lighter-than-average volume. SPY remains in the $772 to $775 range that has defined recent trading, with the consumer inflation expectations data giving the market a macro test on whether price can finally break out of this tight box. If SPY clears first resistance at $775, the door opens for a move toward $778, but if first support at $772 gives way, price likely slides toward $770, and if the lowest support at $765 breaks there is little to keep price from falling toward $760. The long-term bull trend remains intact above $640 with SPY well above structural support. As long as price holds above key structural levels, this remains a broader dip-buying environment. Absent a catalyst, resistance sits at $775, $778, $780, $785, while support rests at $772, $770, $767, $765. With SPY closing just under the top of its range and the Put side in control, we favor shorting rallies near $775. Bitcoin fell 1.60% but closed above $81,944, while the MAG stocks had a mostly red day led lower by NVIDIA down 2.94%, with Apple the lone bright spot, up 1.11%. Sustained weakness across both leadership groups would be required to signal a deeper pullback. The VIX closed at 15.41, up 2.19%, suggesting elevated fear given the intraday selling and weakness in tech leadership heading into Friday's data. SPY closed in the middle of its recent sideways range, with structural support near $640.
Market State Indicator (MSI) Forecast
Current Market State Overview:
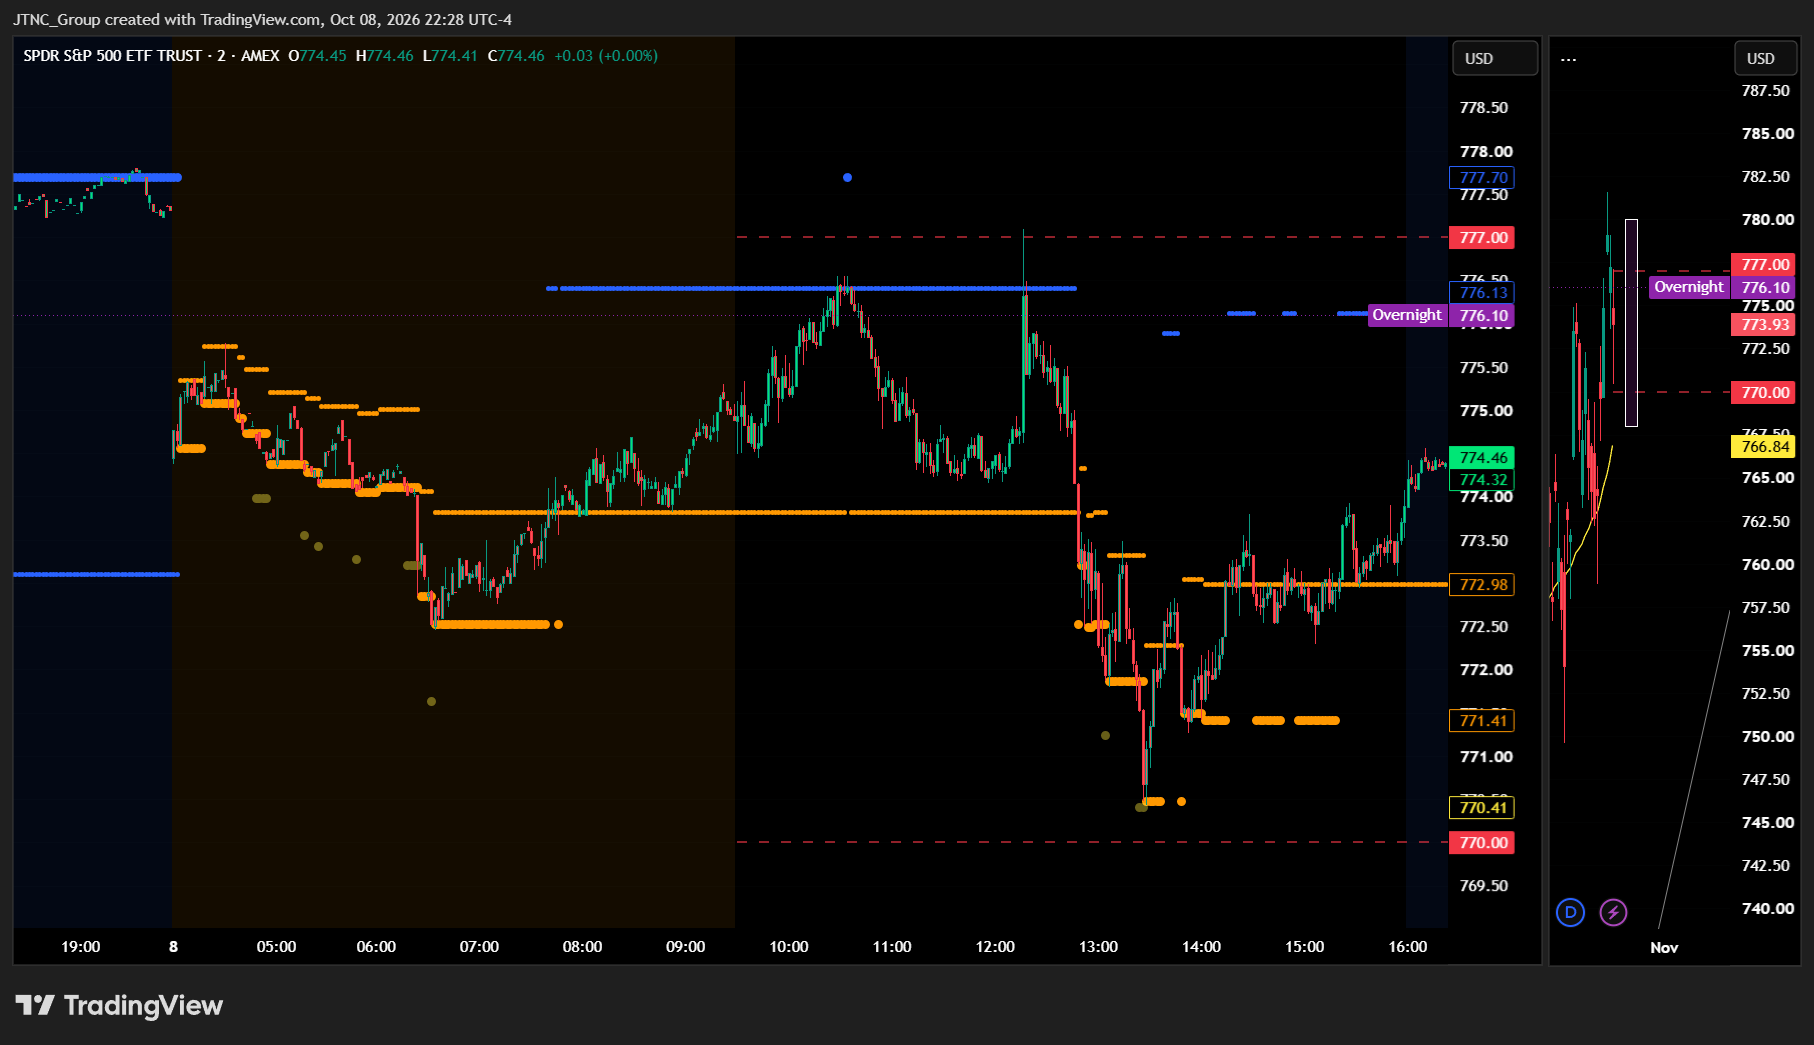
The MSI ended in a Ranging Market State with SPY closing at $773.93. Because SPY finished above the $772.98 MSI resistance, that level now flips to support for Friday's session. Extended targets were not printing at the close. Extended targets were visible below in premarket as price slid lower. During the regular session, extended targets printed above briefly in the AM session as SPY rallied. They then printed below in the PM session as the selloff took hold. The MSI opened overnight in a Bearish Trending state, shifted to Ranging by the open, turned bearish again in the PM session, and returned to Ranging for the close.
The rescaling told the story of the day. Premarket saw rapid rescaling lower as extended targets below drove price down. By the open, the MSI had rescaled into a Ranging state, and SPY surged from $773 to $776 by late morning. Without sustained extended targets above, the rally failed at major resistance near $777. That set off another round of rapid rescaling lower in the PM session, and SPY dropped sharply from $776 all the way down to $770. Once the extended targets below stopped printing, SPY found a base, and the MSI rescaled higher into a tighter Ranging state for the rest of the session.
The MSI now sits in a moderate $1.57 range. That is on the narrow side and points to consolidation more than a big directional push. For Friday, the MSI is forecasting a slow grind lower. Without extended targets at the close, the downside may be limited and is likely to find support at key levels below. With SPY still below all-time highs, the bulls need a clean break above $777 with extended targets to get the uptrend moving again. MSI support is $771.41 with resistance at $772.98.
Key Levels and Market Movements:
Wednesday we stated, "Bulls want to see overnight price hold above $774.5 and stay near the $777.26 close, then push through $777.7 MSI resistance and take out Wednesday's $779.10 high," and added, "The primary setup for Thursday is buying a dip toward $774.5 or $773.1 MSI support, or buying a failed breakdown back above $773.1, targeting $777.7 and then Wednesday's $779.10 high," while also noting, "Only if $773.1 breaks with the MSI rescaling lower and extended targets printing below would a short toward $770.7 and $770 make sense." The bulls didn't get the overnight hold near the close. The MSI flipped from Bullish Trending to Bearish Trending in premarket, and extended targets below dragged price lower through a series of rapid rescales. SPY still opened at $774.86, just above the $774.5 level.
The MSI was Ranging at the open, and the first trade came straight from Wednesday's plan. Buyers stepped in on the dip toward the $773 area near support, and SPY pushed from $773 to $776 through the AM session. Extended targets printed above near $777.70, but only briefly. Without follow-through, SPY topped out at a session high of $777.09. That was right at major resistance near $777 and short of both $777.7 and Wednesday's $779.10 high. The failed breakout at $777 was the second trade. Once the extended targets above faded, selling into that failure back toward $774.5 and $773.1 paid off quickly.
The third trade came in the PM session. The MSI turned bearish with rapid rescaling lower, $773.1 broke, and extended targets printed below. That was exactly the condition Wednesday's plan required for the short toward $770.7 and $770. SPY dropped sharply to a session low of $770.44, just above $770 major support, before the extended targets below stopped printing. From there, SPY found a base, the MSI rescaled higher into Ranging, and price recovered to close at $773.93.
SPY fell 0.42% on volume of 40.35 million shares. That is near average and well above Wednesday's light turnover, which shows real participation in the selloff. The VIX rose 2.19% to 15.41, a modest pickup in fear that fits a market losing some of its footing near the highs. At minimum it was a 3-for-3 session for traders following the framework. It was a volatile but readable day with substantial setups, all identified through proper context, patience, and flexibility while leveraging the MSI, premarket levels, and market structure rather than forcing trades. The MSI continues to prove its reliability as the cornerstone of our trading process.
Trading Strategy Based on MSI:
Friday has heavy economic data with Prelim UoM Consumer Sentiment and Prelim UoM Inflation Expectations both at 10:00 AM ET, which can introduce significant volatility, so traders should be ready to trade what they see rather than predict. The MSI closed Ranging with a moderate $1.57 width, and Thursday's 0.42% drop leans the bias lower. Without extended targets at the close, though, Friday is shaping up as a slow grind lower. Any downside may be limited and is likely to find support at key levels below. With SPY closing above $772.98, that old MSI resistance now acts as support, and $771.41 sits just underneath it.
Bulls want to see overnight price hold above $772.98 and stay near the $773.93 close, then push back through $776 and retest $777 major resistance. A clean break above $777 with extended targets printing above would open the door to Wednesday's $779.10 high and Tuesday's $781.62 all-time high. Without that, any bounce is likely to stall. Bears want to see $772.98 fail, then lose $771.41 MSI support with the MSI rescaling lower and extended targets printing below. That would press price back toward Thursday's $770.44 low and $770 major support. Two straight failures near the highs give the bears an edge, but the lack of extended targets at the close suggests they won't get a runaway move.
The primary setup for Friday is selling a rally that fails near $776 or $777, targeting $772.98 and then $771.41 MSI support. A failed breakdown below $771.41 that reclaims the level could offer a quick long back toward $772.98 and $774.5. That may be the spot where Friday's grind lower finds its footing. If the UoM data sparks a rescale lower with extended targets printing below, stay short toward $770.44 and $770 and don't fight it. Only a reclaim of $777 with the MSI rescaling higher and extended targets printing above would flip the bias back to the long side.
The long-term bull trend remains intact above $640 and failed breakouts and failed breakdowns continue to offer the highest-probability setups. Remain flexible, avoid trading during Ranging Market States unless a clear failed breakout or breakdown presents itself, and ensure all trades are fully aligned with MSI signals. Providing real-time insights into market control, momentum shifts, and actionable levels, the MSI when integrated with our Pre-Market and Post-Market Reports continues to sharpen execution precision and elevate trade quality. If you haven't yet integrated MSI and our model levels into your process, now is the time. Contact your representative to get started as these tools are designed to support consistency and enhance performance.
Dealer Positioning Analysis
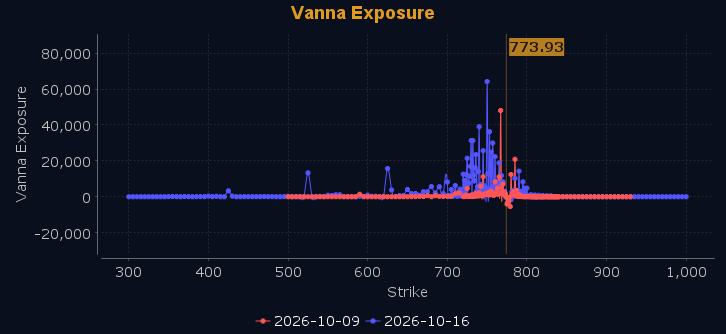
Dealers are selling SPY $775 to $805 and higher strike Calls, indicating the Dealers' belief that any rally on Friday will run into supply before it gets very far. The bigger story is on the Put side, where Dealers are selling large quantities of $765 to $773 Puts near the money. That signals they believe Friday has more upside than downside, and Dealers do not sell ATM Puts unless they believe there is a floor in the market at $765. They aren't buying Calls to chase a move higher. Instead, they're leaning on heavy Put selling to express that view. The ceiling for Friday appears to be $778, with $775 acting as heavy resistance, and above that there is little to keep the market from new all time highs. To the downside, Dealers are buying $764 to $720 and lower strike Puts in a 3:1 ratio to the Calls they're selling, displaying real concern that prices could move lower even as they bet on a floor. Should SPY fail to hold $773, $770 comes into play, though the market is likely to move no lower than $765 without an external catalyst. Below $762 is bearish and above $764 is bullish, with everything in between full of chop and traps. Dealer positioning is unchanged at bearish.
Looking Ahead to Next Friday:
Dealers are selling SPY $775 to $810 and higher strike Calls, indicating the Dealers' belief that the rally will eventually stall out at higher levels. At the same time, they are selling $765 to $773 Puts broadly into October 16, which shows strong conviction that prices will keep grinding higher this week, and Dealers do not sell ATM Puts unless they believe there is a floor in the market at $765. They have reduced their hedges and seem to believe October will bring new all time highs. The ceiling for the week appears to be $785. To the downside, Dealers are buying $764 to $700 and lower strike Puts in a 4:1 ratio to the Calls they're selling, displaying enough concern that prices could move lower to keep the overall picture cautious despite the bullish Put selling. There is major support at $770 and $765, with major resistance at $775 to $778, above which there is little to keep the market from new all time highs. Below $762 is bearish and above $764 is bullish, with the range in between being choppy and trap filled, so patience is key there. For the week Dealer positioning is unchanged at bearish. We advise reviewing Dealer positioning daily for directional clues. These positions evolve quickly and tracking them is essential for staying ahead of shifting market sentiment.
Recommendation for Traders
Short rallies near $775, targeting $772 and $770, with stops above $778. Stay nimble around the 10:00 AM sentiment data.
Keep size light and review the premarket analysis posted before 9 AM ET for any changes in the model's outlook and Dealer Positioning.
Good luck and good trading!
