
Market Insights: Monday, October 5th, 2026
Market Overview
Stocks kicked off what should be a relatively quiet week on a high note Monday, extending Friday's rally as investors weighed rising bond yields, uncertainty over the eurozone economy, and the approaching earnings season. The Dow added 0.2%, the S&P 500 rose 0.7% and moved closer to its own record high, and the tech-heavy Nasdaq gained 1% to post a fresh record. Long-dated Treasury yields pushed higher and are hovering near their highest levels since 2002, but that wasn't enough to derail the rally, as pared-back Fed rate-hike bets and expectations that the central bank will hold steady at its next meeting kept buyers in control. The calendar was light, with S&P Global and ISM purchasing managers' indexes leading the releases. The ISM services index showed activity still expanding in September, though at a slower pace, slipping to 54.9 from 55.4 in August, while its prices index flashed fresh cost pressure by climbing to 74 from 72.6. The market has stayed remarkably resilient through the bond market turmoil and the ongoing Middle East war, though Brent crude holding above $100 per barrel has investors on edge. Some strategists see plenty of reasons for a pullback, while others think the rally has more room to run. Later this week, Levi Strauss, Applied Digital, PepsiCo, and Delta Air Lines report before Q3 earnings season kicks off in earnest in mid-October. Wall Street analysts are head over heels for stocks heading in, with FactSet data showing 60% of S&P 500 stocks now carry a Buy rating, the highest level on record, which leaves next to no margin for error if results or guidance come up short.
Nvidia led the Nasdaq to its record, trading near $237 per share and closing at an all-time high for the first time since May, topping its prior record close of $235.74 set on May 14. The AI chip heavyweight has become the touchstone of the AI boom, with record profits and revenue fueling investments across AI developers like OpenAI, Anthropic, and xAI, as well as neocloud provider CoreWeave and optical networking names Coherent and Lumentum. Taiwan Semiconductor also touched intraday all-time highs after Elon Musk acknowledged early-stage talks about a potential collaboration on his Terafab semiconductor initiative. Tech journalist Tim Culpan wrote in a recent newsletter that "TSMC is exploring ways to work with Elon Musk's Terafab to help the startup chipmaker run its new semiconductor factories in Texas," and Musk responded on X over the weekend, "Just discussions, but something may come of it." Brazilian stocks were the other big story, surging after Flávio Bolsonaro took a surprising though narrow lead over current President Luiz Inácio Lula da Silva in the first round of Brazil's general election. Neither candidate won a majority, setting up a runoff later this month. Fintech PicS jumped as much as 26%, Nubank parent Nu Holdings and energy giant Petrobras each climbed over 13%, and MercadoLibre, Latin America's largest e-commerce company, rose 9%. JPMorgan upgraded Brazilian stocks to "overweight" earlier in the day, pointing to a more favorable political backdrop that could drive a period of outperformance.
SPY Performance
SPY opened at $769.69, right in line with yesterday's close, so there was no gap this time and no early drama. That quiet start didn't last long. SPY dipped only a few cents to a session low of $769.63 before buyers took over and never really let go. From there it was a steady climb to a session high of $776.61, cleanly breaking through yesterday's high of $772.65. That's the exact level we flagged as the signal that the pullback is fully behind us, and the bulls cleared it with room to spare. SPY finished at $774.83, giving back a little from the peak but closing well in the upper portion of the day's range.
SPY gained 0.67%, its third straight green close. Volume came in at 44.79 million shares, near average and a step up from the prior session. That's a healthy sign, because rising participation on a breakout day suggests real buyers are behind the move rather than just short covering. The candle tells the story even better than the numbers. SPY opened almost at its low and closed near its high, building a strong green body that wipes out yesterday's concern about the small red candle. Traders who sold the early pop yesterday were clearly outnumbered today. The one wrinkle is the VIX, which rose 1.37% to close at 15.52 even as SPY pushed higher. That's a small move and the VIX is still sitting at a calm level, but it does show some traders are quietly adding protection after a strong three-day run. It's not a red flag on its own, though it's worth keeping an eye on if it keeps creeping up while prices rise. The bigger picture looks solid. The recent flush now looks more and more like a shakeout, and SPY has moved from defending its lows to making fresh short-term highs. Going forward, yesterday's high around $772.65 becomes the first support level to watch, since old resistance often turns into new support after a breakout. As long as SPY holds above it, the bulls stay firmly in control. A push above today's high would extend the rally, while a slide back below today's low would suggest the breakout ran out of steam and put the recent range back in play.
Major Indices Performance
The Nasdaq held onto its leadership role, climbing 1.05% for a second straight session of strong gains. Tech didn't quite match the prior day's surge, but back-to-back moves of this size show that buyers are still hungry for growth exposure. Mega-cap names once again carried the load, with broad strength across the group keeping the index pointed higher. When the heavyweights keep pulling in the same direction, the Nasdaq has a clear runway, and that's exactly what traders got.
The Russell 2000 extended its winning streak to three sessions, adding 0.5%. That's a smaller gain than last time, but small-caps keep finding buyers even as borrowing costs continue to creep higher, a headwind that would normally knock rate-sensitive names off balance. The pace cooled, but the broadening story is still alive, and three straight green days suggest real staying power rather than a short-lived bounce.
The Dow brought up the rear again with a modest 0.18% gain, its third straight advance but its weakest in that run. Blue chips got no help from energy as oil slid for a second session, leaving the index to lean on scattered strength elsewhere. The S&P 500 finished between tech's strength and the Dow's slow grind. The VIX rose 1.37% to close at 15.52, a notable tell that some traders were quietly hedging even as stocks pushed higher. All three indices finished green, but the tilt toward growth and the uptick in fear make this a rally worth watching closely.
Notable Stock Movements
Tesla led the Magnificent Seven for a second straight session, climbing 2.20% to post the biggest gain in the group. That's a smaller jump than the prior day's surge, but follow-through was exactly what bulls wanted to see, and they got it. Back-to-back leadership from a high-beta name like Tesla tells us traders aren't just taking quick profits and running. They're sticking with the trade, and that kind of conviction usually means risk appetite is still healthy.
The rest of the group mostly followed along, with the Magnificent Seven finishing mostly green once again. The only exceptions were Amazon and Apple, with Apple bringing up the rear at a 0.24% loss. That's hardly a breakdown. It's more like a couple of names catching their breath while the rest of the leadership group kept pushing. Two straight days of big tech moving mostly in the same direction is the kind of broad strength that gives a rally real staying power.
Tech's grip on the market showed up in the indices too. The Nasdaq led the way with a 1.05% gain, well ahead of the Russell 2000's 0.5% climb and the Dow's modest 0.18% advance, so tech was clearly steering the ship. The one thing that stood out was the VIX, which rose 1.37% to 15.52 even as stocks moved higher. That suggests some traders were quietly hedging their bets while riding the rally. Big tech is still carrying the load, but bulls will want to see Apple and Amazon rejoin the party before calling this an all-clear.
Commodity and Cryptocurrency Updates
Crude oil slipped for a second straight session, falling 1.56% to close at $89.69. Back-to-back declines suggest the recent profit-taking is gaining some traction, but crude is still trading well above $70 and far ahead of longer-term model expectations. The geopolitical tensions and supply disruptions that powered this rally are still in play, so this looks more like a cooling-off period than a true reversal. Energy prices remain elevated, and if crude stays parked at these levels for an extended stretch, it will keep adding to inflation pressures and could seriously complicate the Fed's path on rate policy.
Gold edged lower again, dipping 0.15% to close at $4,156. The move was small, but it marks a second straight losing session and shows buyers are still hesitant to step in with real conviction. The metal remains stuck in its consolidation phase, and this kind of quiet drift is common while the market tests for a solid floor. The long-term case for gold hasn't changed, with inflation uncertainty, steady central bank buying, and a steady stream of geopolitical headlines all offering support. Investors will want to see buyers defend current levels before expecting the next push higher.
Bitcoin extended its pullback, falling 0.95% and closing below $85,660. That makes two straight down days after the recent breakout attempt, and the lack of follow-through keeps crypto locked in a cautious, range-bound pattern. Selling pressure hasn't been severe, but buyers also aren't showing the urgency needed to spark a real recovery. Bitcoin will need to put together a run of consistent green sessions to prove it can break free of this sideways grind rather than just bouncing within it.
Treasury Yield Information
The 10-year Treasury yield kept climbing today, rising 0.64% to close at 5.310. That's a second straight gain and another new high for this run, pushing the 10-year even deeper into the most dangerous zone on the framework. With no economic data to react to, this move came purely from bond sellers pressing their advantage. There was no headline to blame, and that makes the steady grind higher even more telling.
Measured against each threshold, the cushion keeps getting wider. The 4.5% level where equity valuations start to feel the squeeze now sits 81 basis points below today's close. The 4.8% mark that usually sparks broader selling is 51 basis points back. The 5% line for serious risk is cleared by 31 basis points. Most importantly, the 10-year now sits 11 basis points above 5.2%, the level where the framework calls for a 20% or greater correction. Each session that yields push further from that line makes the correction signal harder to dismiss.
Stocks once again refused to take the hint. The Nasdaq gained 1.05%, and small caps added 0.5%, even though those rate-sensitive names are supposed to struggle when borrowing costs rise. The Dow lagged with a 0.18% gain. There was one subtle shift, though. The VIX rose 1.37% to 15.52, which means some traders were quietly buying protection even as stocks moved higher. That's the first crack in the calm we flagged yesterday. When volatility firms up alongside rising yields and a rally, it suggests at least part of the market is starting to respect the pressure building in bonds.
Tuesday brings no economic news, so yields will trade on momentum and positioning again. Watch whether the 10-year holds above 5.31% or keeps pushing to fresh highs. Another leg up would put real strain on the equity rally, especially if the VIX keeps creeping higher. A drop back below 5.2% would ease the correction warning, but real relief still requires a sustained move under 5%. Until then, stocks are rallying against a bond market that keeps saying the opposite.
Previous Day’s Forecast Analysis
Heading into Monday, our AI model projected SPY's maximum range at $763 to $775, with the Call side dominating an expanding band. That setup pointed to trending price action with intermittent chop. With an empty economic calendar, the forecast called for a session driven purely by technicals. Because SPY had settled a touch above the midpoint of the projected range after Friday's gap held, the outlook carried a modestly bullish bias. That lean was supported by the Call-heavy band and a calmer fear gauge after the VIX dropped 6.04% to 15.40. The tight $768 to $771 box that had defined recent trading was expected to steer the action.
On the upside, $771 was flagged as the first test and the level buyers needed to clear. A breakout there opened the door to $773 and then the $775 ceiling, with $777 marked as overhead resistance outside the projected range where heavy supply was expected. On the downside, $768 was the line to defend and the preferred spot to buy dips. A clean break below it was expected to bring $765 into play quickly, followed by $763 at the bottom of the range and then $760 as the next cushion. If $755 gave way, there was little standing in the way of a slide toward $750. The broader trend was described as healthy, with structural support near $640.
The trading strategy favored the long side. Position sizing could run at 70-80% of normal with the VIX below 16, and traders were advised to let the opening range form before committing full size. The cleanest long trigger was a pullback that held $768 and then drove through $771. Targets were set at $773 and $775, with runners aimed at $777, and stops belonged below $765. The plan warned against chasing into $773 without a clean retest of $771. The secondary short setup was fading a stall at $771, targeting $768 and then $765, with stops above $773. A breakdown through $768 was shortable at reduced size toward $765 and $763. Bear-side size was to stay at roughly half the bull side, and the plan called for trimming exposure if the VIX popped back through 16 and cutting size toward half above 17.
Market Performance vs. Forecast
Monday's session delivered the trending upside move the forecast anticipated. The model called for trending price action with intermittent chop, a modestly bullish bias and a Call-dominated band, and the tape followed that script from start to finish. SPY opened at $769.69, inside the tight $768 to $771 box, and buyers never let price slip meaningfully below that opening level. The session low of $769.63 held well above the $768 line the forecast identified as the level buyers needed to defend. From there, bulls cleared the $771 ceiling, pushed through the $773 first target and reached a session high of $776.61. That high sat slightly above the model's $775 ceiling. The model does not account for unpredictable external events, and even on an empty economic calendar, trending momentum stretched price a bit beyond the base case scenario. Even so, the forecast had already flagged $777 as overhead resistance where any rally should run into heavy supply, and that call held, with SPY topping out just beneath it. SPY closed at $774.83, up 0.67% and back inside the projected $763 to $775 range.
On the rising market side, the playbook worked. The forecast named a break of the $771 ceiling as the move that would hand momentum to the bulls, and that breakout opened the path to $773 and $775 exactly as described. The $773 first target and the $775 secondary target were both reached. The $777 runner target came within a hair of being tagged, and the forecast's advice to treat anything beyond it as a bonus fit a session that stalled just below that supply zone. The morning dip never came close to $768, which showed how firmly dip-buyers controlled the tape. The $765 long stop was never in play, and the advice to let bull-side size lead was rewarded with a steady climb.
The falling market scenario was framed as the secondary setup, and the session showed why. Price drove through $771 instead of stalling there, so the short-side trigger never got the rollover it required. Any trader who attempted the fade had a stop defined above $773, so risk management protocols protected capital the moment buyers pressed higher. Keeping bear-side size at roughly half the bull side also limited exposure on the less likely side of the trade. The $768 breakdown never happened, and the $765, $763, $760, $755 and $750 levels all went untested. The forecast's reminder that the long-term bull trend remains intact and that dip-buyers keep stepping in proved to be the defining theme of the day. Near-average volume showed orderly, steady participation behind the advance.
The VIX rose 1.37% to 15.52, staying below the 16 line the forecast flagged as the signal to trim net long exposure and tighten stops. That kept the 70-80% position sizing guidance in force all session. The fear gauge didn't slide toward 15 the way the secondary-target condition preferred, but it stayed calm enough for buyers to keep working without interruption. The $768 support, the $771 breakout line, the $773 and $775 targets, the $777 supply zone and the bullish bias all gave traders clear, actionable guidance on a day driven purely by technicals. The framework continues to adapt to shifting conditions and gives traders a reliable structure for managing risk and spotting opportunity in the sessions ahead.
Premarket Analysis Summary
The premarket analysis, posted before the opening bell, framed the expected move between $761 and $775, with $775 marked as max upside and $761 as max downside. The tone had flipped from the prior two sessions, with the Put side now dominating the tape. Spot sat at $769.37, essentially flat after Friday's push stalled right beneath $770. That earned a cautious, bearish-leaning bias, and the analysis warned that in a put-heavy tape the downside tends to move faster than the upside. The defining level was once again $770, a major round number that had capped every attempt for two weeks. A clean reclaim and hold would flip the tone, while failure there would leave the pocket beneath spot exposed. Above $770, $771 was where the tape would begin to repair, $772 was the heaviest resistance overhead and the level bulls really needed, and $773 was the next decision point before the $775 cap. On the downside, $768 was the first level to watch, with $767 just below as the next decision point. Under that, $765 was flagged as the point of last hope and the heaviest battle on the board, while $761 sat at the bottom of the expected move with a major round number right beneath it.
The bears never got their chance, and the put-heavy setup turned out to be fuel for the bulls instead. SPY opened at $769.69, still just shy of the $770 gate, but buyers took it out early and never looked back. Price climbed through $771, broke through the heavy $772 resistance, cleared $773, and blew past the $775 max upside to a high of $776.61. The low of $769.63 came right at the open, so $768, $767, $765, and $761 were never even tested. SPY closed at $774.83, up 0.67%, on 44.79M shares of near-average volume. The VIX rose 1.37% to 15.52, which is an unusual pairing with a rally like this and suggests some traders were still buying protection on the way up. The $770 ceiling finally broke with conviction after two weeks of rejections, and the close landed just under $775. That turns the old max upside into the level bulls need to hold if this breakout is going to stick.
Validation of the Analysis
Today's session showed how the premarket framework can map out a breakout before it happens. The analysis named $770 as "the defining level," the ceiling that had "capped every attempt for two weeks now," and stated plainly that "a clean reclaim and hold flips the tone." That is exactly how the day played out. SPY opened at $769.69, just beneath the gate, and the session low of $769.63 came only pennies below the open. From there, buyers took $770 and never gave it back. Once the gate opened, SPY moved up the ladder in order. It cleared $771, where the model said "the tape begins to repair," and then pushed through $772, which the analysis flagged as "the heaviest resistance overhead and the level bulls really need." The $773 decision point fell next, and price kept climbing toward $775, the top of the expected move.
The upside targets acted as a roadmap for the entire rally. SPY tagged a high of $776.61, pressing just beyond the $775 max upside before sellers pushed back. It then closed at $774.83, up 0.67%, settling right under that top target. Even with the intraday overshoot, the model's upper boundary worked as the magnet that defined where the day finished. The downside framework was just as useful, because its conditions were never triggered. The analysis set $768 as "our first level to watch" and laid out the bullish path directly: "Hold 768 and 770 gets another test." Buyers held well above $768, and $770 did more than get tested. It broke. As a result, $767, the $765 "point of last hope," and the $761 max downside all stayed quiet. The premarket warned that in a put-dominated tape the downside can move faster, but it also made clear that everything depended on the outcome at $770. The VIX rose 1.37% to 15.52 even as SPY rallied, a sign that traders kept buying protection on the way up. That fits the cautious positioning the morning notes described.
The trading opportunities were clearly defined from the opening bell. The playbook told traders exactly what to watch for, which was a reclaim and hold of $770. Longs taken on that reclaim had a step-by-step path through $771, $772, and $773, with each level offering a natural spot to trail stops or scale out. Traders who held for the $775 max upside captured a move of about five points from the gate, the bulk of the day's $6.98 range from low to high. Those who respected $775 as the expected move top also had a reason to lock in gains near the highs, before price slipped back to close below that level. Just as important, the framework kept traders out of the wrong trade. With $768 never threatened, there was no signal to short. The $770 gate decided the session, the upside targets fell in sequence, the downside stayed untouched, and $775 marked where the rally ran out of room, just as the analysis laid out.
Looking Ahead
Tuesday's economic calendar is completely empty, with no high-impact releases scheduled. There's no inflation report, no jobs data, and no Fed decision to move the market at 8:30 AM ET or anywhere else in the session. That gives traders a clean slate where price action will be driven by positioning, sector rotation, and whatever headlines cross the wires rather than a scheduled data catalyst. Without a big number to react to, the market will have to find its own direction, and that can reveal a lot about where real conviction sits.
Traders should use this quiet session to position carefully rather than chase moves. Tuesday will show whether Monday's action has real follow-through or fades once the market has had a full day to digest it. If buyers step in and defend key levels without a fresh catalyst, that's a sign of genuine strength. If the tape drifts lower on light participation, it suggests conviction is thin. Quiet days often bring choppy, range-bound trading, so avoid forcing trades in the middle of the range. Focus on clear technical setups, keep stops disciplined, and use the calm to sharpen your game plan for the rest of the week. On a no-data day, patience is often the best edge.
Market Sentiment and Key Levels
The bulls remain firmly in control, and Monday's session finally delivered the breakout the market had been waiting for. SPY opened right near its lows, buyers stepped in almost immediately, and the index climbed steadily before holding most of its gains into the close. That's a textbook trend day, and more importantly, it pushed price cleanly out of the $768 to $771 range that had boxed in trading for days. The Nasdaq once again led the way, small caps put in a respectable showing, and the Dow lagged behind. That mix tells us money is still flowing toward growth and risk rather than playing defense. There is one wrinkle worth watching, though. The VIX rose 1.37% to 15.52 even as stocks pushed higher, which means some traders were quietly buying protection into the rally. Rising fear alongside rising prices isn't a red flag on its own, but it suggests not everyone trusts this move, and that kind of hedging can show up right before a pause or a pullback. Volume was ordinary, so this was a clean breakout but not one backed by a flood of new buyers.
First resistance now sits at $777, just above where buyers ran out of steam. A decisive push through that level should open the door to $780, with $782 and $785 above that if momentum keeps building. On the downside, first support is $773, and SPY is sitting right on top of it heading into Tuesday. Losing $773 would likely send price back toward $771, the old top of the range that should now act as a floor, followed by $765 and $760. If $760 gives way, there's little to stop a slide toward $750. For longer-term bulls, the broader uptrend remains intact well above structural support at $640, so this is still a dip-buying environment as long as those key levels hold. Tuesday's projected maximum range runs from $770 to $779, with the Call side dominating in an expanding band that points to trending price action mixed with some intermittent chop. There's no economic news on Tuesday's calendar, so the market will trade purely on technicals, and flows and positioning will do the heavy lifting. Elevated yields remain the biggest background threat, and any renewed jump there could quickly cool this rally. With price breaking out but hedging activity picking up, we favor buying dips near $773 rather than chasing strength into $777. Keep stops disciplined below support, stay patient, and let price prove it can clear resistance before sizing up.
Expected Price Action
Tuesday's session brings actionable intelligence generated by our AI model, which projects SPY's maximum range at $770 to $779. With the Call side dominating in an expanding band, the model is calling for trending price action with intermittent chop. Tuesday's calendar is empty, with no economic news due out, so the market will trade purely on technicals. Monday's tape gave bulls a breakthrough they'd been chasing for two weeks. The $770 ceiling that had capped every rally finally gave way, and instead of stalling, buyers kept pressing and held most of the gains into the bell. SPY settled just above the midpoint of the projected range, which gives us a modestly bullish bias heading into Tuesday. That lean is backed by the Call-heavy band, though the fear gauge is flashing a small caution sign. VIX rose 1.37% to 15.52, a sign that some traders were quietly buying protection even as stocks climbed. With no headlines on deck, flows and positioning will do the heavy lifting, and price is starting the day sitting right on top of the model's first support.
The first test for Tuesday is $777, the resistance level buyers need to clear to keep the trend running. If bulls can push through $777, the next target is $780, just above the model's $779 ceiling, with $782 and $785 waiting as overhead resistance where any extended rally should run into heavy supply. On the downside, $773 is the line buyers need to defend, and it's exactly where we favor buying dips, since the Call side is in control and price is holding in the upper half of its range. A clean break below $773 opens the door to $771, and below that $770 marks the bottom of the projected range, the same level that acted as a ceiling for two weeks and should now act as a floor. If that floor cracks, $765 comes into play, and if the lowest support at $760 gives way, there's little standing in the way of a slide toward $750. The bigger picture remains healthy, with SPY trading well above structural support near $640, so this is still a dip-buying market on a broader timeframe. In the short run, the playbook is simple. A breakout above $777 hands momentum to the bulls and opens the path toward $780, a hold at $773 keeps the buy-the-dip trade alive, and losing $773 means a trip toward $771 and possibly a retest of $770 could come in a hurry with no economic data to change the story.
Trading Strategy
The VIX rose 1.37% to 15.52, a modest uptick that tells us traders were quietly buying protection even as buyers controlled the tape. That divergence is worth respecting but not fearing. With no economic news on Tuesday's calendar, the market will trade purely on technicals, and a fear gauge still parked below the 16 line keeps position sizing in the 70-80% of normal range. A push through 16 is the signal to trim net long exposure and tighten stops to the 0.5-0.75% range from entry, while a jump through 17 means cutting size back toward half. Without a macro catalyst, the opening hour may wander, so let the first range form before committing full size.
In a rising market scenario, $773 is the level to defend, and buying dips there is our preferred setup. A morning pullback that holds $773 and then drives through $777 is the cleanest long trigger, because clearing that ceiling would put price on a path toward the upper end of the projected range. The first profit target is $779 at the top of the projected range, with a secondary target of $780 if momentum builds and the VIX slips back toward 15. Runners can aim for $782 and $785, but treat anything up there as a bonus. Stops on longs belong below $771, since losing that level would mean the floor is cracking and price is heading toward the bottom of the projected range at $770. With the Call side dominating an expanding band, bull-side size can lead. Still, don't chase a breakout straight into $779 without a clean retest of $777. Trending days with intermittent chop reward patient pullback entries far more than paying up into resistance.
In a falling market scenario, $777 is the resistance to fade, but treat this as the secondary setup. A bounce that stalls at $777 and rolls over is a valid short trigger, especially if the VIX climbs above 16 while price struggles to make headway. The initial profit target is $773, with $771 in play if sellers press through first support. Stops on shorts belong above $780 to guard against a squeeze through the top of the projected range. If the market breaks $771 without a real bounce attempt, that breakdown is shortable at reduced size, targeting $765 and then $760. Should $760 give way, $750 comes into view, but that is a runner target only, not the base case. With the Call side in control, keep bear-side size at roughly half the bull side. Cover in layers into support and don't overstay. The long-term bull trend is intact above $640, and dip-buyers have repeatedly stepped in on these pullbacks. A VIX that stays below 16 still favors the bulls.
Model’s Projected Range
SPY's projected maximum range for Tuesday is $770 to $779, with the Call side dominating in an expanding band that suggests trending price action with intermittent chop. Tuesday brings no economic news due out so the market will trade on technicals. SPY closed at $774.83, up 0.67%, after opening at $769.69 and dipping to a session low of $769.63 before buyers took control and pushed it to a high of $776.61, holding most of those gains into the close. SPY is trading near our model's first support at $773, and with no major macro headline driving the tape, flows and positioning should do the heavy lifting. If $777 resistance breaks, price should target $780, while a break below $773 support opens the door to $771, and if the lowest support at $760 gives way there is little to keep price from falling toward $750. The long-term bull trend remains intact above $640 with SPY well above structural support. As long as price holds above key structural levels, this remains a broader dip-buying environment. Absent a catalyst, resistance sits at $777, $780, $782, $785, while support rests at $773, $771, $765, $760. We favor buying dips at $773. Crypto and the MAG names sent mixed signals, with Bitcoin slipping 0.95% to close below $85,660 while the MAG stocks put up a mostly green day led by Tesla up 2.20%, with Apple the lone laggard down 0.24%, so big tech leadership is still carrying the rally even as crypto cools off. The VIX closed at 15.52, up 1.37%, suggesting elevated fear given that traders were quietly buying protection even as SPY pushed higher. SPY continues to hold within its broader uptrend with structural support near $640.
Market State Indicator (MSI) Forecast
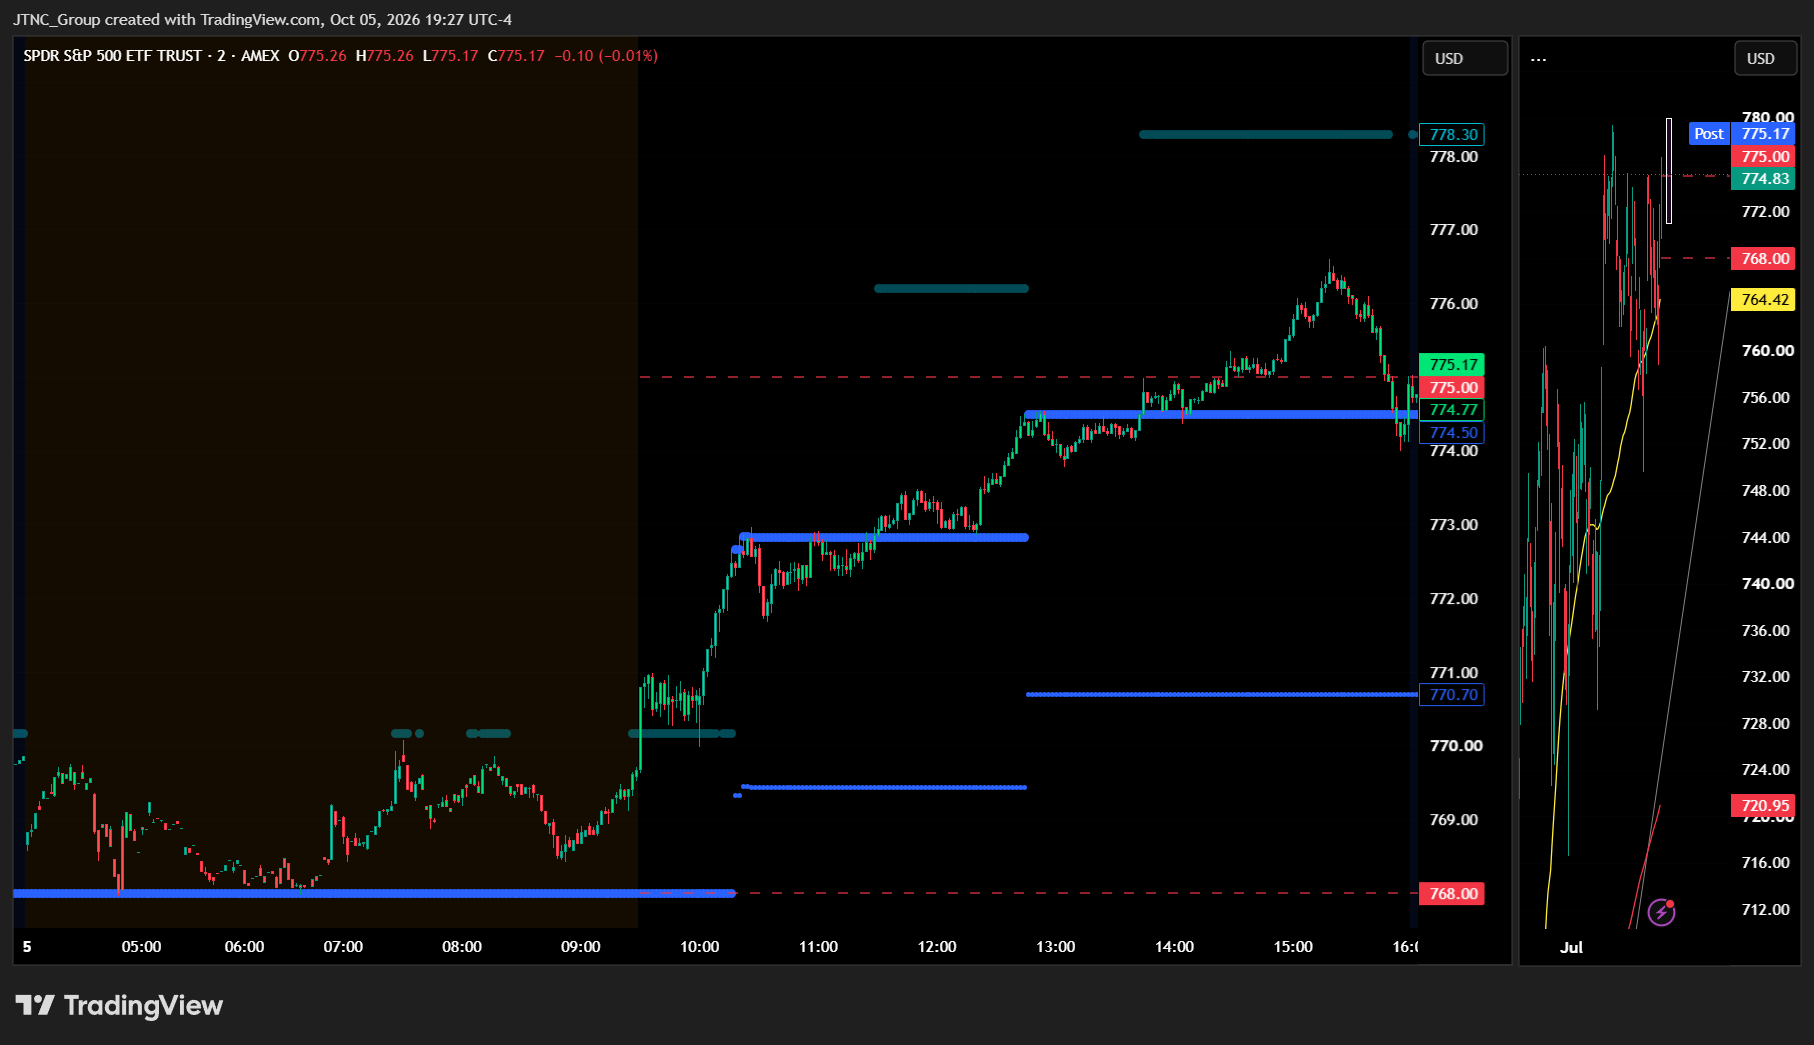
Current Market State Overview:
The MSI ended in a Bullish Trending Market State with SPY closing at $774.83. Because SPY closed above the MSI range, the $774.77 MSI resistance now becomes support heading into Tuesday, with $770.7 serving as the next line of support beneath it. Extended targets were printing above at the close. Earlier, extended targets printed above in premarket and carried into the open before the first rescale, which showed the bullish extension was already in place before the bell. They kept printing above through the AM session, again in the PM session, and into the close as the bulls stayed in charge all day.
The MSI rescaled higher overnight as traders bet the Federal Reserve would pause interest rate hikes after Friday's weaker than expected jobs report. The herd joined the move, and you could see it in the extended targets above that started overnight and never let up. During the regular session the MSI rescaled several times higher, and each new set of levels gave traders a clean spot to get long. With the MSI Bullish Trending all session and extended targets above, there was no reason to look for shorts. The job was to buy the dips and let the trend do the work.
The MSI now sits in a wide $4.07 range, which leaves plenty of room for price to keep moving. For Tuesday, the MSI is forecasting a strong continuation higher, with the bulls maintaining control and extended targets above suggesting upside momentum will persist. SPY pushed through $775 today, and if it can clear that level again it becomes support. The next stop is likely $777, and then a run at the all-time high. If $775 fails, $770 is major support. MSI support is $770.7 with resistance at $774.77.
Key Levels and Market Movements:
Friday we stated, "Bulls want to see overnight price hold $767.99, then push through $770 and break Friday's $772.65 high," and added, "Once it gives way, the next real test is $775," while also noting, "If price clears $772.65 with extended targets above, stay long and take profits into the $775 area rather than fading the move." The bulls checked every box. The MSI rescaled higher overnight on growing bets that the Fed will hit pause, and the premarket held Bullish Trending with both MSI lines near the $768 area. Overnight price held well above $767.99 and never came close to testing it.
SPY opened at $769.69, just under $770, and the session low of $769.63 printed right at the open. That was as weak as the bulls let it get. Friday's warning that $770 would not hold for long proved right, because price pushed through it quickly. Since the open hugged the session low, there wasn't a deep pullback to $767.99 to buy. Instead, the framework handed traders its setups through the rescales.
The first trade came in the AM session. The MSI rescaled higher, and when SPY pulled back to test the new MSI support, buyers stepped right in. With the MSI Bullish Trending and extended targets printing above, buying that test was the play. Price carried through Friday's $772.65 high, using the premarket levels as the guide since there was no MSI target above. The second trade showed up in the early PM session. The MSI rescaled higher again, and another dip to the fresh MSI support held, setting up a long that pushed SPY through $775 to a session high of $776.61. That was right where Friday's plan called for taking profits. Price eased back from the high but held above the new $774.77 MSI resistance, and extended targets printed above into the close as SPY settled at $774.83.
SPY gained 0.67% on volume of 44.79 million shares, near average and a bit heavier than Friday. The VIX rose 1.37% to 15.52, a slight move up alongside stocks that is worth keeping an eye on, but it did nothing to slow the bulls today. At minimum it was a 2-for-2 session for traders following the framework. It was an easy day to read and execute with substantial setups, all identified through proper context, patience, and flexibility while leveraging the MSI, premarket levels, and market structure rather than forcing trades. The MSI continues to prove its reliability as the cornerstone of our trading process.
Trading Strategy Based on MSI:
Tuesday has light economic news but the wide bullish MSI with extended targets above suggests continuation higher is the most likely outcome. With a Bullish Trending state, a wide $4.07 width, and extended targets printing above at the close, the MSI is forecasting a strong continuation higher. The bulls have control, and any pullback to $774.77 MSI resistance turned support is a buying opportunity.
Bulls want to see overnight price hold $774.77, then push back through $775 and take out Monday's $776.61 high. If $775 flips into support, the next stop is likely $777, followed by a test and possible break of the all-time high. Extended targets above at the close tell us the herd is still leaning long, so dips should be bought rather than faded. Bears want to see $774.77 fail, then lose $770.7 MSI support with the MSI rescaling lower and extended targets printing below. That would press price toward $770 major support and possibly back to $767.99. Bears have a long way to go, though, and nothing in Monday's action suggests they're ready to take over.
The primary setup for Tuesday is buying a dip to $774.77 support, or buying a failed breakdown back above it, targeting $775 and then Monday's $776.61 high. If price clears $776.61 with extended targets above, stay long and take profits into the $777 area and the all-time high rather than fighting the move. A deeper pullback into the wide range toward $770.7 MSI support would also be a buyable spot as long as the MSI stays Bullish Trending. A failed breakout above $776.61 could offer a quick short back toward $775, but the bias favors longs until the MSI shifts. Only if $770.7 breaks with the MSI rescaling lower and extended targets printing below would a short toward $767.99 make sense.
The long-term bull trend remains intact above $640 and failed breakouts and failed breakdowns continue to offer the highest-probability setups. Remain flexible, avoid trading during Ranging Market States unless a clear failed breakout or breakdown presents itself, and ensure all trades are fully aligned with MSI signals. Providing real-time insights into market control, momentum shifts, and actionable levels, the MSI when integrated with our Pre-Market and Post-Market Reports continues to sharpen execution precision and elevate trade quality. If you haven't yet integrated MSI and our model levels into your process, now is the time. Contact your representative to get started as these tools are designed to support consistency and enhance performance.
Dealer Positioning Analysis
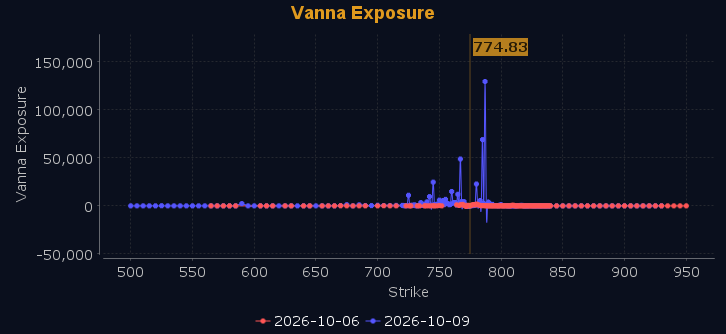
Dealers are selling SPY $775 to $805 and higher strike Calls, and they're no longer buying ATM Calls. However, they are selling ATM Puts at $772 to $774, which signals the Dealers' belief that prices will rise on Tuesday. Dealers do not sell ATM Puts unless they believe there is a floor in the market at $772. The ceiling for Tuesday appears to be $780. To the downside, Dealers are buying $771 to $705 and lower strike Puts in a 2:1 ratio to the Calls they're selling, displaying only mild concern that prices could move lower. Dealers have also reduced their hedges, which puts a very strong imprint on the current trend and tells us they're convinced prices will keep rising on Tuesday. Above $775 is bullish and below $770 is bearish, with everything in between acting as high-noise chop. Should SPY fail to hold above $775, expect the rally to be sold with a likely test of $770 or lower. Should $765 fail, Dealers will press shorts and push SPY back to last week's lows. A push above $775 will find little resistance on the way to the all-time highs. Dealer positioning is unchanged at bearish.
Looking Ahead to Next Friday:
Dealers are selling SPY $775 to $810 and higher strike Calls, and they're no longer buying ATM Calls or selling ATM Puts. Even so, they have reduced their hedges, which shows their belief that the market will keep grinding toward the all-time high and perhaps beyond this week. The ceiling for the week appears to be $787. To the downside, Dealers are buying $774 to $705 and lower strike Puts in a 2:1 ratio to the Calls they're selling, displaying only mild concern that prices could move lower. A move above $775 turns that resistance into major support, with little to stop SPY from reaching $780. Below $775 down to $770 is nothing but chop. A failure at $770, however, will push SPY toward the magnet at $765. For the week Dealer positioning is unchanged at neutral/slightly bearish. We advise reviewing Dealer positioning daily for directional clues. These positions evolve quickly and tracking them is essential for staying ahead of shifting market sentiment.
Recommendation for Traders
Favor buying dips near $773, targeting $777 and $780, with stops below $771.
Keep size modest and respect your stops. Review the premarket analysis posted before 9 AM ET for any changes in the model's outlook and Dealer Positioning.
Good luck and good trading!
