
Market Insights: Thursday, October 29th, 2026
Market Overview
Stocks slipped Thursday as Alphabet's third-quarter report sparked a sharp sell-off and brought AI jitters roaring back, weighing heavily on tech. The Dow fell almost 0.3% and the S&P 500 lost roughly 0.3%, while the Nasdaq dropped about 1.4%, snapping tech's positive run this week. Investors were sorting through Wednesday's Fed pause alongside results from Microsoft and Alphabet. Microsoft beat analyst expectations on both the top and bottom lines, but Alphabet's sales came up short. Even with cloud growth of 103%, worries about the Google parent's free cash flow and its return on AI spending hung around the stock's neck like an albatross, sending shares down nearly 13%. The damage spread across AI names. The iShares Semiconductor ETF (SOXX) skidded and software stocks (IGV) tumbled after outlooks from Fortinet and ServiceNow, both of which posted double-digit losses, deepened the AI anxiety. A rotation into defensive sectors like Healthcare (XLV), Financials (XLF), and Real Estate (XLRE) kept a lid on broader losses. That shift away from the market's biggest names has been building for two weeks, turning the Magnificent Seven into a drag on the major indexes. The Defiance Large Cap ex-MAG 7 ETF (XMAG), which tracks 493 large-cap stocks and excludes Apple, Alphabet, Microsoft, Amazon, Meta, Tesla, and Nvidia, has recently pulled ahead of the S&P 500 for the year. As of Thursday afternoon it was up more than 15%, compared with 13% for the S&P 500, while the Roundhill Magnificent Seven ETF (MAGS) was up less than 6%. If the group keeps lagging, Wall Street may need a new nickname for its favorite stocks, and the trend says a lot about how investors are positioning around the AI frenzy. All eyes now turn to Amazon, which reports after the bell and delivers another dose of hyperscaler earnings. On the macro side, the backdrop stays tricky. The Fed held rates unchanged Wednesday with two dissenters who favored a hike because of sticky inflation, and the Fed's preferred inflation gauge, the Personal Consumption Expenditures index, heated up in September to 3.6% year over year.
Plenty of other stocks moved on their own news. Eli Lilly popped 6% on strong third-quarter results for its GLP-1 drugs, while Caterpillar fell as much as 12% after its forecast failed to impress Wall Street. Sprouts plunged 22% after revealing a price-cutting strategy expected to weigh on profits into next year. Crocs went the other way, soaring 25% to its highest price in over two years as investors cheered a brighter 2026 sales outlook and a turnaround at HeyDude, whose third-quarter revenue rose 6.1% from a year earlier to $170 million, the struggling loafer brand's first sales increase in six quarters. In deal news, ADT agreed to be taken private by Thrive Holdings in an all-cash deal valuing the home security company at $7.6 billion. Thrive will pay $10 per share, a 45.6% premium over ADT's Oct. 27 close, and the stock soared 34% to around $9.93, on pace for its highest close since August 2021. Thrive is a private capital group founded by Josh Kushner and backed by OpenAI that focuses on buying enterprise businesses for the long haul and boosting their AI and tech capabilities. Looking toward Washington, Tuesday's midterms could put pharmaceuticals, housing, and AI data centers in the spotlight no matter who wins, since the 2026 campaign has featured bipartisan calls for action on all three. The criticism coming from Republicans is especially notable, signaling a more populist GOP and possible openness to deal-making in a new power-sharing setup. Democrats are strongly favored to win the House, which could raise the profile of these issues with or without President Trump's support. The Senate is less certain, though, and its 60-vote threshold means any action will need bipartisan buy-in regardless of the outcome.
SPY Performance
SPY opened at $768.79, gapping down from yesterday's close of $772.39 and starting the session below both $771.13 and $769.25, the first two support levels we flagged. The bulls lost their footing before the opening bell even rang. SPY tried to rally and reached a session high of $770.76, but it couldn't reclaim $771.13. Sellers then pressed harder and drove SPY down to a session low of $766.62. That sliced through $767.73 and briefly dipped just under $766.71, the level we said would undo much of the recent climb. That was the moment of truth, and buyers answered it. They stepped in, pushed SPY back up, and it finished at $769.49, back above $769.25 and above its open.
SPY lost 0.37%, ending its three-day winning streak. But for the fourth session in a row, it closed above its open. Even on a red day, buyers were the ones adding to gains during regular hours. The overnight gap did the damage, not the trading day itself. Volume tells a more complicated story. Turnover rose to 31.51 million shares. That's still below average, but it's the second straight session of rising participation. The catch is that this time the extra volume showed up on a down day. That's a subtle warning sign, because it suggests some traders were using the recent strength to sell. Even so, the VIX dropped 2.42% to close at 16.50, its fourth straight decline. The fear gauge falling while SPY slips is an unusual mix. It tells us traders saw today as a routine pullback, not the start of something worse, and they weren't scrambling to buy protection.
The bears won the day, but the bulls won the most important battle by refusing to close below $766.71. Today's low of $766.62 is now the line in the sand. A close beneath it would confirm that buyers are losing control, and a drop under $764.44 would put the bears back in the driver's seat. On the upside, SPY needs to reclaim $771.13 to get the recovery back on track, and a push through $773.35 would put the bulls firmly back in charge. Right now SPY is sitting in no man's land between those levels. The intraday bounce and the falling VIX lean bullish. The higher volume on a down day leans cautious. Until SPY either breaks out above $771.13 or breaks down below $766.62, expect some choppy back-and-forth. The trend hasn't broken, but it just showed its first real crack.
Major Indices Performance
The Russell 2000 grabbed the top spot with a 0.8% gain, and it did so on a day when most of the market was heading the other way. Small-caps have now strung together a solid run, and this session showed real conviction as money rotated out of crowded mega-cap tech and into the smaller, more domestically focused names. A slight easing in borrowing costs gave the group some breathing room. Crude held steady instead of spiking again, which removed one of the headwinds that weighed on small-caps last session. Outperforming while the rest of the market slipped is exactly the kind of leadership shift bulls like to see beneath the surface.
The Dow finished second with a 0.25% loss, a relatively mild dip that kept the blue chips well ahead of the tech-heavy indices. The old-economy names that make up much of the index didn't attract much fresh buying, but they also avoided the heavy selling that hit growth stocks. That kind of resilience suggests investors weren't running from risk altogether. They were simply repositioning, and the Dow's mix of industrials, financials, and defensive names gave it some insulation from the damage in tech.
The Nasdaq brought up the rear with a painful 1.38% drop, giving back its recent gains and then some. A steep collapse in one of the biggest tech heavyweights dragged the entire index lower, and mostly red action across the rest of the megacap group made it impossible for the Nasdaq to recover. When a single name with that much index weight gets hammered, it can overwhelm decent action elsewhere, and that's exactly what happened here. The S&P 500 slipped 0.37%, landing between the Dow and Nasdaq as tech weakness offset gains in the broader market. The VIX dropped 2.42% to close at 16.50, which tells us the selling looked more like rotation than panic. Traders now turn their attention to Friday's Employment Cost Index.
Notable Stock Movements
Alphabet was the biggest mover in the Magnificent Seven, but this time it was for all the wrong reasons. The stock collapsed 12.64% to lead the group's losses, a stunning reversal for a name that was the clear standout just one session ago. A drop that size from a mega-cap is rare, and it wipes out far more than a recent rally. It tells us sellers came in with serious force and weren't interested in waiting around. When a stock that had just shown leadership gets hit this hard, it shakes confidence across the whole group and forces traders to rethink how much they trust even the strongest names.
The group stayed mostly red for a second straight session, but the lineup shifted in a big way. Meta and Apple were the only names that finished green, while Alphabet, Nvidia, Microsoft, Amazon, and Tesla all closed lower. Meta's 1.96% gain was the surprise of the day. After being the weakest link in the group for several sessions, it finally found buyers and flipped into the top spot. That could be the floor traders were waiting for, though one strong day doesn't erase a losing streak. Apple bounced back into positive territory after slipping last time, which shows some money is rotating toward steadier names. Amazon lost the support it showed alongside Alphabet a session ago, and Microsoft extended its losing run to three days. Nvidia and Tesla stayed under pressure, which fits the cautious mood around high-growth names.
The broader market told a story of rotation rather than panic. The Nasdaq dropped 1.38% as big tech dragged it lower, and the Dow slipped 0.25%, but the Russell 2000 jumped 0.8%. That split shows money moving out of mega-caps and into smaller companies instead of leaving stocks entirely. The VIX also dropped 2.42% to 16.50, keeping fear comfortably below the key 20 level even with Alphabet's heavy selling. That's a sign traders see this as a shake-up within big tech, not a reason to run for the exits. Now attention turns to Friday, when the Employment Cost Index hits at 8:30 AM ET. A hot wage reading could keep pressure on growth names like Nvidia and Tesla, but a calm number could help Meta build on its comeback and give the rest of big tech a chance to steady itself after a rough session.
Commodity and Cryptocurrency Updates
Crude oil barely moved, edging up 0.01% to close at $102.79. After the prior session's big surge back above $100, this was a day of consolidation rather than follow-through, and the black gold held onto its gains without any real pullback. Crude has rallied well above $70 and far beyond longer-term model expectations, and the geopolitical tensions and supply disruptions fueling this run are still firmly in place. The fact that sellers couldn't make a dent shows the fear premium remains baked in. Friday's Employment Cost Index will give energy traders another read on whether rising costs are feeding into wages. A sustained move this far above $70 keeps inflationary pressure alive and could seriously complicate the Fed's rate path if energy prices stay elevated.
Gold slipped 0.47% to close at $4,032, snapping its three-day winning streak. It's not a major breakdown, but the yellow metal gave back some of its recent progress and drifted closer to the key $4,000 level. A modest pullback after a string of gains is normal, though bulls will want to see buyers defend this area quickly. The long-term case still looks solid, supported by inflation uncertainty, steady central bank buying, and ongoing geopolitical headlines. Friday's wage data could provide a fresh catalyst if it points to stickier inflation. If gold holds comfortably above $4,000, the uptrend stays intact. A clean break below that level, however, would shift momentum toward the sellers and raise questions about the strength of this rally.
Bitcoin lost some steam, falling 1.17% to close above $80,318. That ends a two-day winning streak and erases a good chunk of the recovery that pushed the crypto further from the $80,000 handle. The pullback came as tech leadership stumbled, a reminder that Bitcoin's independent strength has its limits when risk appetite cools. Still, the crypto managed to stay above that key psychological level, which keeps the base-building story alive for now. Bulls need to step back in quickly to prove the recent bounce wasn't just a short-lived relief rally. If Bitcoin can hold above $80,000 through Friday's macro data, the recovery could resume. Losing that level, though, would hand the advantage right back to the sellers.
Treasury Yield Information
The 10-year Treasury yield fell 1.11% today to close at 4.990, and just like that, bond buyers dragged it back under the 5% line one day after it broke through. That's exactly the move we said needed to happen fast, so give the bulls credit for this one. But let's not throw a party yet. A close 1 basis point below 5% isn't a retreat to safety. It's a step back from the ledge while still standing right on the edge of it.
Against each threshold, the picture improved only slightly. The 4.5% level where equity valuations start feeling pressure sits 49 basis points below today's close, and the 4.8% mark that usually kicks off broader selling is still 19 basis points back. The serious-risk flag at 5% technically flipped back off, but with just 1 basis point of cushion, it could flip right back on with one bad headline. The gap to 5.2%, where the framework calls for a 20% or greater correction, widened to 21 basis points. That's a little more breathing room, but not enough to call the danger over.
The strange part is that lower yields didn't give stocks the lift you'd normally expect. The Nasdaq slid 1.38% and the Dow dipped 0.25%, while the Russell 2000 gained 0.8%. Small caps are the most rate-sensitive corner of the market, so their bounce makes sense with yields easing, but the tech weakness had more to do with company-specific selling than rates. The VIX dropped 2.42% to 16.50, its fourth straight decline, so traders are still shrugging off the risk. Crude barely budged, up just 0.01% at $102.79, but at that level energy prices are still keeping inflation worries alive and giving bond sellers a reason to stay aggressive.
Friday brings the Employment Cost Index at 8:30 AM ET, and that's the next test for the 10-year. Wage growth feeds directly into inflation expectations, so a hot reading could shove the yield right back above 5% and put the 5.2% danger zone back in play. A cooler number would give bond buyers a shot at pushing the yield further down toward 4.8%, which would ease a lot of pressure on equities. The key level is still 5%, and the 10-year needs to build real distance below it. Until it does, rates remain the biggest threat hanging over this market.
Previous Day’s Forecast Analysis
Heading into Thursday, our AI model projected SPY's maximum range at $761 to $777, with the Put side dominating an expanding band. That setup pointed to trending price action with intermittent chop. Because Wednesday's quiet grind left SPY in the upper half of the projected range, with less room overhead than underneath, the forecast carried a bearish bias. The 8:30 AM ET trio of Advance GDP q/q, the Advance GDP Price Index q/q, and Core PCE Price Index m/m was flagged as the major volatility catalyst, especially in the first hour. The VIX had dropped 3.77% to 16.86, but the warning was that complacency ahead of a data dump can unwind fast.
The $772 to $775 zone was identified as the key battleground, with $772 as first support and $775 as first resistance. A clean push through $775 opened the door to $777, the top of the model's range, with $780 and $785 as stretch targets if the data came in friendly. On the downside, losing $772 pointed toward $770, then $767 and $765, which was called the last line of defense for bulls. A break of $765 left room for a slide toward $760. The broader bull trend was described as intact above structural support near $640.
The trading strategy favored fading strength. The top setup was shorting a failed rally into $777, with a rejection at $775 as a secondary entry. Targets were $772 and $770, then $767 and $765, with $761 as a stretch target. Stops belonged above $780, or just above $778 for aggressive traders. If $765 broke with conviction, the plan was to short a failed retest from underneath, targeting $760. On the long side, buying a dip into $767 to $765 was the cleaner setup, targeting $770 and $772, with stops below $761. A breakout and retest of $775 was another long option, aiming for $777. Traders were told to run half to two-thirds of normal size through the first hour, keep stops at 0.5-0.75% from entry, let the initial data reaction burn off, and keep longs lighter than shorts. The bears held a slight edge as long as $777 capped the upside.
Market Performance vs. Forecast
Thursday's session stayed entirely inside the model's projected maximum range of $761 to $777, with neither boundary ever coming into play. SPY opened at $768.79, climbed to a high of $770.76, dipped to a low of $766.62 and closed at $769.49, down 0.37%. The forecast called for a bearish bias, and the tape delivered exactly that, opening below the key $772 line and never reclaiming it. The model does not account for unpredictable external events like the market's read on the 8:30 AM ET release of Advance GDP, the GDP Price Index and Core PCE, and the forecast warned that this data trio could spark significant volatility. Instead, the reaction stayed contained, and the trending action with intermittent chop showed up as a slow drift lower followed by back-and-forth trade in a tight band.
The $772 to $775 battleground framed the session from the opening bell. The forecast said losing $772 would likely send price toward $770, followed by $767 and then $765, and that roadmap played out almost to the penny. Price opened below $772, and the session high stalled just above $770 rather than pushing back into resistance. The low printed just under $767, the second downside target, while $765, the point of last hope for bulls, was never threatened. The forecast said a break below $772 that held after the 8:30 AM releases would likely turn the day into a trend toward $767 and $765, and sellers held that line the entire session.
On the falling market side, the preferred short required a tag of $777 that stalled, with a $775 rejection as the secondary entry. Sellers did their work from lower levels, so neither trigger appeared, and the wider stops above $780 and $778 were never in danger. The bearish bias still proved correct, since the forecast's downside targets of $770 and $767 both came into play. On the rising market side, the $767 to $765 dip-buy was the setup that mattered. Price tagged that zone, held well above the $765 floor and bounced to tag the $770 initial profit target. The forecast flagged a VIX slipping toward 16 as the bullish confirmation signal for that trade, and fear eased in that direction as buyers stepped in. Stops below $761 were never close to being tested.
The VIX dropped 2.42% to 16.50, extending its slide even as SPY finished in the red, which shows that Thursday's dip was orderly rather than fearful. Below-average volume of 31.51M confirms the measured, controlled tone of the session. The rejection below $772, the push into $767 and the bounce off the dip-buy zone all unfolded across levels the forecast had already mapped. The framework adapts as conditions shift, and Thursday showed the value of preparing both scenarios ahead of a major data release. With the long-term bull trend intact above structural support near $640, it remains a reliable guide for managing risk and capturing opportunity in either direction.
Premarket Analysis Summary
The premarket analysis, posted before the opening bell, set up Thursday with SPY at $769.31 in a put-dominated tape, with the tone flipping back after Wednesday's push above $771 faded late and price slipped under $770 overnight. The bias hinged on $770, the defining level, a major round number, and the heaviest concentration near price, sitting directly overhead as the gate. Reclaiming and holding it would mark the overnight dip as a shakeout, while failing there would put the support band below in play. The expected move ran from $761 to $775, and the notes warned that with one session left in the week and a put-dominated tape, moves tend to accelerate once a level gives. Upside targets stepped through $771 as the spot where the tape begins to repair, $772 as the heaviest two-way battle on the board, $775 as the cap on the expected move, and $778 as max upside. On the downside, $768 was the first level and the top of a support band running to $765, the most important level below. Under that sat $763 as the point of last hope and $760 as max downside.
The session spent the whole day trapped between the gate and the support band. SPY opened at $768.79, just under $770 and right on top of the $768 level. Sellers pushed through $768 into the band, but the low printed at $766.62, comfortably above the critical $765 floor, so the fast trip to $763 never got started. Buyers then lifted price back over $770 to a high of $770.76, but the rally stalled just shy of $771 and never reached the $772 battle zone. SPY closed at $769.49, down 0.37% on 31.51M shares of below-average volume, finishing back under the $770 gate. The VIX dropped 2.42% to 16.50, a sign that traders weren't paying up for protection even on a red day. The key takeaway is that both edges held. The support band absorbed the selling, but $770 kept rejecting any lasting reclaim. Bulls need a hold above $771 to bring $772 into focus, while a break of $765 remains the trigger that could make things ugly in a hurry.
Validation of the Analysis
Thursday's session stayed inside the premarket map from start to finish, and the level the notes called "the defining level" once again set the terms of the day. The notes were written with spot at 769.31, and SPY opened at $768.79, just under the spot price and sitting right on top of $768, "the first level beneath spot." The notes framed the session around one question at $770, "the gate right above us": "reclaim and hold it and this was a shakeout, fail there and the band of support below gets tested." SPY did reclaim the gate intraday but could not hold it, and the band of support got exactly the test the notes described.
The upside ceiling showed up right where the notes put it. SPY printed a high of $770.76, pushing 76 cents through $770 but stalling just 24 cents short of $771, the level "where the tape begins to repair." Because that repair never came, $772, "the heaviest two-way battle on the board," stayed out of reach, and neither $775 nor the $778 max upside came into play. On the downside, the support band from $768 to $765 did its job with real precision. The session low came in at $766.62, slicing through $768 and landing squarely inside the band, yet it held $1.62 above $765, "the most important level below." Since $765 never gave way, the warning that a clean break "could get ugly fast" never triggered, and neither $763, "our point of last hope," nor the $760 max downside was touched. SPY closed at $769.49, down 0.37%, finishing just 18 cents above the premarket spot and 51 cents under the gate, which left the $770 question unresolved going into Friday. A range of just over four points sat comfortably inside the expected move of 761 to 775, and the notes' point that moves "accelerate rather than fade once a level gives" explains the quiet character of the day. The key levels on both sides held, so nothing got the chance to run. The VIX dropped 2.42% to 16.50 even with SPY lower, and below average volume confirmed that sellers never found the conviction to force a break.
The trading value came from knowing exactly where the floor and ceiling sat. Traders following the map had a clean long setup inside the $768 to $765 support band, with risk defined under $765 and $770 as the natural target, and price reached that target. Sellers had a setup too. The pop through $770 that stalled just under $771 offered a defined fade with a stop above $771 and a target back toward $768, and price traded down through that level during the session. The map also kept traders out of bad trades. With $765 holding firm, there was no reason to press shorts toward $763 or $760, and with $771 capping the move, there was no reason to chase longs toward $772 or $775. A session that tested the support band, held its most important floor, and stalled right under the repair level shows how tightly these levels framed the day. Going forward, the battle lines are clear: bulls need to reclaim $770 and push through $771 to put $772 back in play, while bears need to break $768 again and finally crack $765 to open the fast trip toward $763 and $760.
Looking Ahead
Friday's calendar is much lighter, with just one release on the docket. The Employment Cost Index q/q lands at 8:30 AM ET and carries a medium-impact rating. It may not grab headlines like GDP or PCE, but it deserves attention. The ECI is one of the most complete measures of labor costs in the economy, tracking wages, salaries, and benefits on a quarterly basis. The Fed watches it closely because rising labor costs can feed directly into stickier inflation, especially in the services sector. A cooler ECI reading would reinforce the case that wage pressures are easing. That would likely give rate-sensitive and growth names a tailwind into the weekend. A hotter-than-expected print, on the other hand, could revive worries that the labor market is still running too warm for inflation to settle down. That could weigh on stocks as investors rethink how much easing is realistic.
Friday is also the final trading session of October, so month-end rebalancing and portfolio window dressing could add some extra crosscurrents to the tape. That kind of flow can push certain names around for reasons that have nothing to do with the data, so don't read too much into odd moves in the afternoon. With only one medium-impact report on deck, the pre-market reaction at 8:30 AM ET will probably be more muted than what we've seen this week. A surprise in either direction could still spark a quick move in futures. Give the market the first 30 minutes after the opening bell to show its hand before committing new capital. Keep position sizes reasonable and stops in place, especially since traders may be reluctant to hold big bets over the weekend. If the morning direction holds through midday, that's a sign the ECI is driving real conviction. If it fades, the market is likely still digesting the broader picture and squaring up books for month-end. Either way, Friday offers a chance to reassess positioning and set up for the start of a new month.
Market Sentiment and Key Levels
Thursday tilted the scales back toward the bears, though it was more of a rotation story than an outright retreat. Sellers kept a lid on the tape all session, and while buyers did step in off the lows, the light participation suggests conviction was thin on both sides. The real action was under the surface. The Nasdaq slid 1.38% and the Dow slipped 0.25%, yet the Russell 2000 rallied 0.8%. When small caps climb while the tech-heavy index takes a sharp hit, it tells you money isn't fleeing stocks so much as shifting away from crowded mega-cap names and into the rest of the market. That's healthier than a broad selloff, but it also means the indexes lost their usual engine, and a sizable drag from big tech weighed heavily on the cap-weighted averages. Risk appetite cooled elsewhere too, with Bitcoin falling 1.17% and gold easing 0.47%. Interestingly, the VIX dropped 2.42% to 16.50 even as stocks drifted lower, a sign that traders view this as orderly repositioning rather than the start of something scarier. Bears hold a slight edge heading into Friday, but the strength in small caps and the calm volatility readings keep that edge from turning into real control.
SPY finished near the top of the tight $768 to $770 band that has boxed in recent trading, putting first resistance at $770 just overhead and first support at $768 right below. A push through $770 opens the door to $771, followed by $775 and $780 if momentum builds. On the downside, losing $768 likely sends SPY toward $766, then $760 and $758. If $758 gives way, there is little to keep price from falling toward $750. The bigger picture remains solid, with the long-term bull trend intact well above structural support at $640. That keeps this a broader dip-buying environment as long as key levels hold. Friday's projected maximum range runs from $757 to $771, with the Put side dominating in an expanding band that points to trending price action mixed with intermittent chop. That marks a second straight session of Put-side control, and notice how lopsided the range is, with far more room to the downside than the upside. The main event is the Employment Cost Index q/q at 8:30 AM ET. It's a medium-impact release, but with inflation already on everyone's mind, a hot wage reading could feed fears that price pressures are sticking around and push SPY through $768 early. A softer number could give buyers enough fuel to test the top of the range. Traders will also want to see whether the rotation into small caps continues, since sustained weakness in both mega-cap tech and crypto would be needed to signal a deeper pullback, while a rebound in the largest names would quickly take pressure off the indexes. Elevated yields and stubborn oil prices remain in the background as inflation concerns and will color how the market reacts to the wage data. With the Put side in control and SPY closing near the top of its range, we favor shorting rallies near $770. Keep stops tight above $775, let the 8:30 AM release settle before committing, and wait for a decisive break of $768 before pressing any short position lower.
Expected Price Action
Friday's session brings actionable intelligence generated by our AI model, which projects SPY's maximum range at $757 to $771. With the Put side dominating in an expanding band, the model is calling for trending price action with intermittent chop. The calendar is lighter than Thursday's but still has a spark at the open. The Employment Cost Index q/q hits at 8:30 AM ET, a medium-impact release that could stir up some movement early if wage pressures surprise in either direction. Thursday's slow drift left SPY finishing near the very top of Friday's projected range, which leaves almost no room overhead and plenty of room underneath. Combined with the Put-heavy tilt of the band, that gives us a bearish bias heading into Friday. The VIX dropped 2.42% to 16.50, so fear continues to cool, but a calm tape with sellers in control can turn quickly once support cracks.
The key battleground for Friday is the $768 to $770 zone that has boxed in recent trading. $770 is the first resistance and the gate bulls need to clear. A clean break through $770 should target $771, the top of the model's range, with $775 and $780 standing as stretch targets if the wage data comes in friendly. On the downside, losing $768 likely sends price toward $766, followed by $760 and then $758, the lowest support and the point of last hope for bulls. If $758 gives way, there is little to keep price from falling toward $750. The bigger picture remains healthy, with SPY well above structural support near $640 and the long-term bull trend intact, so this is still a dip-buying market on a broader timeframe.
In the short run, the playbook favors fading strength. A pop into $770 that stalls sets up a short with $768 and $766 as targets. A break below $768 that holds after the 8:30 AM release likely turns the day into a trend toward $760 and $758. If a soft wage read pushes SPY decisively through $771, step aside rather than fight it, because $775 can come quickly. Whichever side wins the fight at $768 or $770 likely sets the tone for how the week closes out.
Trading Strategy
The VIX dropped 2.42% to 16.50, slipping again even as stocks drifted lower, which tells you fear isn't building despite the soft tape. Still, the Put side controls an expanding band, and Friday's 8:30 AM ET Employment Cost Index release can stir things up right at the open if wage pressures surprise in either direction. It's a medium-impact report, so the reaction may be less violent than a major inflation print, but don't get careless. Keep size at roughly half to two-thirds of normal through the first hour, and keep stops in the 0.5-0.75% range from entry. Give the early reaction time to settle before pressing anything. The trending action with intermittent chop that the model expects means the first move off the open can easily fake out traders who jump in too fast.
In a falling market scenario, shorting a failed rally into $770 is our favored trade and the best risk-reward setup on the board, with $771 marking the projected ceiling for the session. A push into $770 to $771 that stalls and rolls over is the primary trigger, especially if the VIX reverses higher off 16.50 while price fails to hold gains. The first profit target is $768, with $766 next if sellers keep pressing. Runners can aim for $760 and $758, while the projected low at $757 should be treated as a stretch target on a heavy trend-down day. Stops on shorts belong above $775, and aggressive traders can tighten to just above $772. If price loses $758 with conviction, don't chase the flush. Short a failed retest of $758 from underneath instead, targeting $750 as the final stretch target, since there's little support in between. Scale out in layers into support, because data-driven drops can snap back hard once the selling dries up.
In a rising market scenario, buying a dip at $768 to $766 is the cleaner long setup. A pullback that tags that zone and holds is the primary trigger, particularly if the VIX keeps sliding while price firms up. The initial profit target is $770, with $771 in play if buyers take control. Stops on longs belong below $760, just under the next support shelf. If bulls punch through $771 and hold it, buy a clean retest of $771 as support, targeting $775 as the next ceiling. Anything beyond that toward $780 should be treated as bonus territory for runners only. With puts in charge of the band and the model favoring shorts near $770, longs should carry lighter size than shorts until the tape confirms direction. The long-term bull trend remains intact above $640, so deeper pullbacks will likely draw buyers. For now, the bears hold a slight edge as long as $770 caps the upside.
Model’s Projected Range
SPY's projected maximum range for Friday is $757 to $771, with the Put side dominating in an expanding band that suggests trending price action with intermittent chop. Friday, October 30 brings the Employment Cost Index q/q at 8:30 AM ET, a medium-impact release that could stir up some movement at the open if wage pressures surprise in either direction. SPY closed at $769.49, down 0.37%, after opening at $768.79, pushing up to a high of $770.76, and dipping to a low of $766.62 before buyers stepped back in to lift price off the lows into the close. SPY remains in the $768 to $770 range that has defined recent trading. If $770 resistance breaks, price should target $771, while a break below $768 support opens the door to $766, and if the lowest support at $758 gives way there is little to keep price from falling toward $750. The long-term bull trend remains intact above $640 with SPY well above structural support. As long as price holds above key structural levels, this remains a broader dip-buying environment. Absent a catalyst, resistance sits at $770, $771, $775, $780, while support rests at $768, $766, $760, $758. With SPY closing near the top of its range and the Put side in control, we favor shorting rallies near $770. Bitcoin slipped 1.17% but held above $80,318, while the MAG stocks had a mostly red day led lower by Alphabet down 12.64%, with Meta the standout exception, up 1.96%. Sustained weakness across both leadership groups would be required to signal a deeper pullback. The VIX closed at 16.50, down 2.42%, suggesting fear eased modestly even as stocks drifted lower. SPY continues to trade within its broader uptrend channel with structural support near $640.
Market State Indicator (MSI) Forecast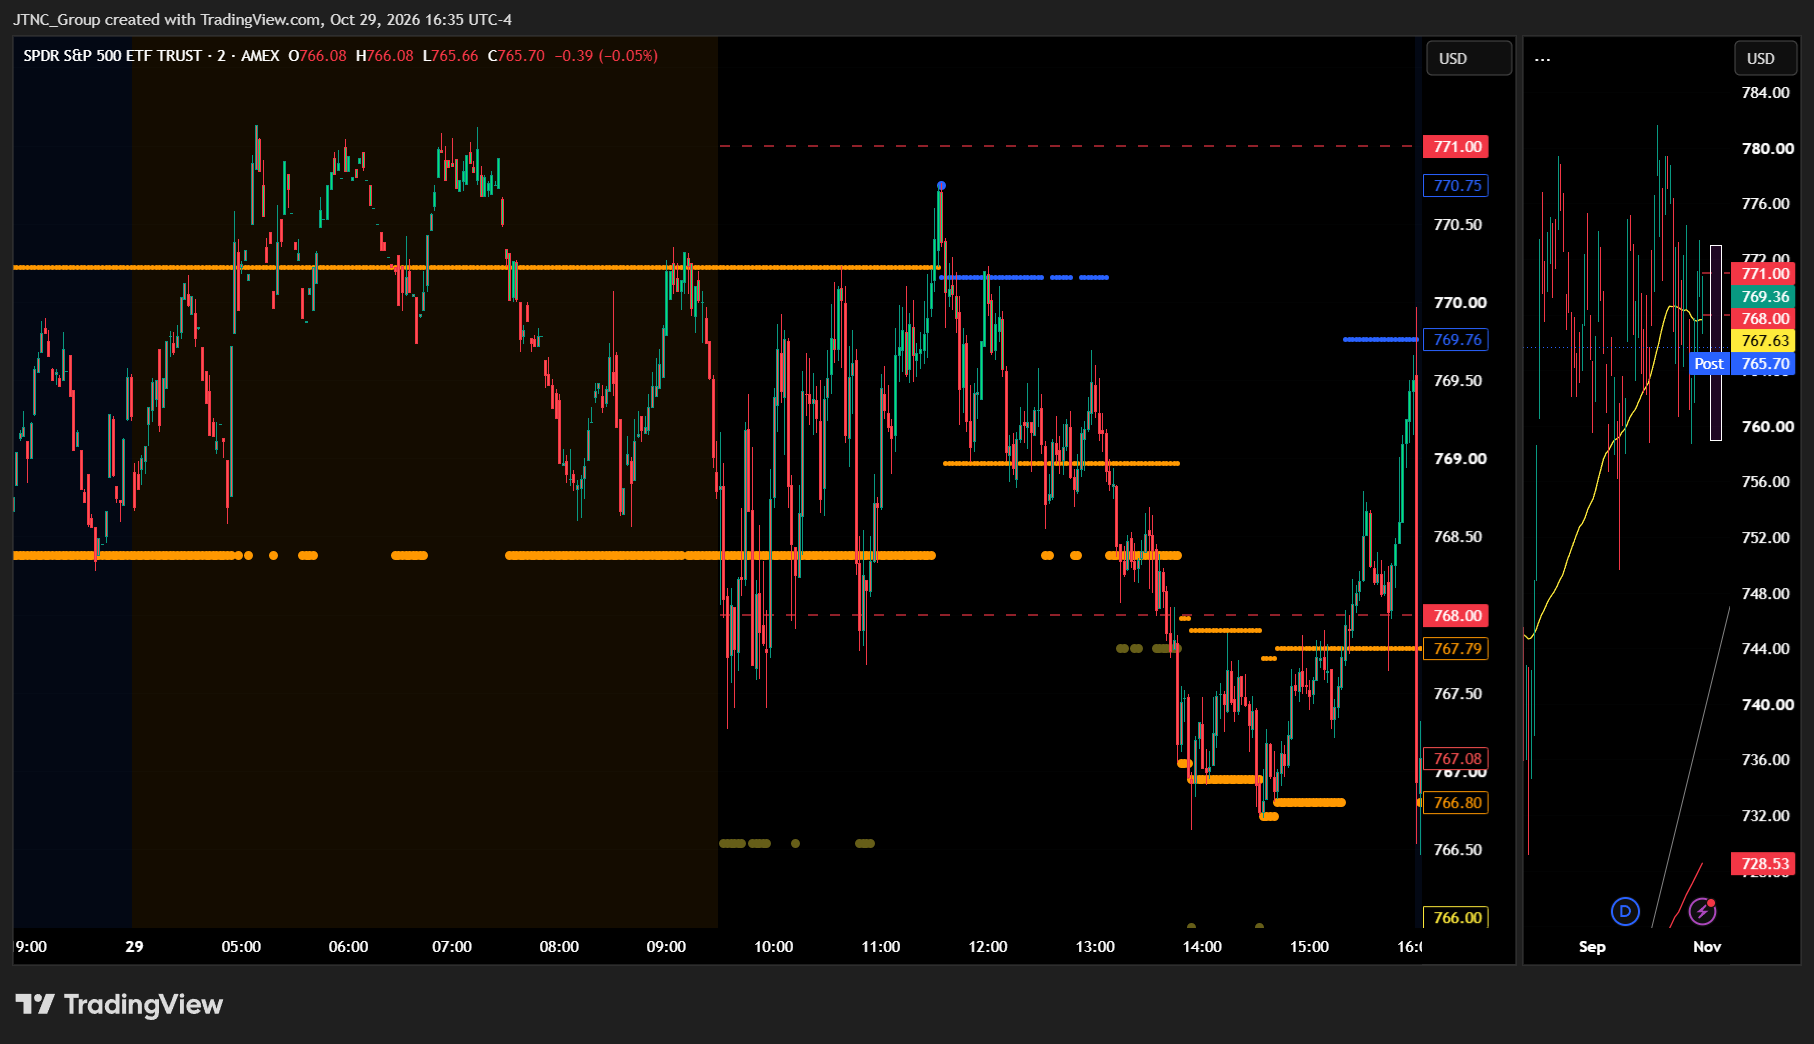
Current Market State Overview:
The MSI ended Thursday in a Bearish Trending Market State with SPY closing at $769.49. Because SPY closed above the MSI range, MSI resistance at $767.79 now becomes support for Friday. Extended targets were not printing at the close. The MSI did not rescale overnight and held a wide bearish state, with no clear extended targets visible in premarket. By the open SPY was mid-range, then fell to MSI support and printed extended targets below. We never fade extended targets. It took a while, but SPY worked back up to MSI resistance by late morning, where we favored a short back to MSI support. That trade worked well, but there was no follow-through to lower targets.
Another rally pushed the MSI to rescale into a very narrow bullish state that lasted just two minutes. Then came rapid rescaling lower, first into a Ranging state and then into a bearish state with extended targets printing below during the PM session. The MSI found support at $766.50 and rescaled higher until it settled into a wide Ranging state into the close. One minute after the bell, SPY dropped more than $3 as Amazon, Intel, and others missed earnings. The MSI rescaled into a narrow $0.99 Bearish Trending state to end the day.
For Friday the MSI forecast is likely sideways to possibly up, because the narrow bearish MSI suggests consolidation rather than strong trending. That said, the bears are likely to keep pressure to the downside, and any failure of MSI support is likely to see SPY retest the day's lows. Once earnings season wraps up, the election or news on the Iran war could be the next driver in either direction. MSI support is $766.8 with resistance at $767.79.
Key Levels and Market Movements:
Wednesday we stated, "Bulls want to see overnight price hold near the $772.39 close and stay above Wednesday's $769.25 low," and added, "Bears want to see $774.25 cap every rally and the $772.39 close give way, with the MSI rescaling to a bearish state and extended targets printing below," while also noting, "If SPY is rejected at $774.25 and extended targets flip to printing below, step aside on longs and look to sell rallies toward $769.25 and $767.73."
The bears took the script. The $772.39 close gave way overnight and the MSI held a bearish state. SPY opened at $768.79, already below Wednesday's $769.25 low, so $774.25 never came into play. Price slid from mid-range down to MSI support and printed extended targets below, which told us to stand aside on any bounce attempts. Sellers couldn't press it further, though. SPY slowly ground back up to MSI resistance by late morning, and that rejection set up the first short back to MSI support.
Buyers then made another run that briefly flipped the MSI into a very narrow bullish state. It didn't stick. Rapid rescaling lower took the MSI through a Ranging state and back into Bearish Trending with extended targets printing below in the PM session. Price undercut the 50 DMA near $767.73 and found support at $766.50, while the session low printed at $766.62. From there the MSI rescaled higher into a wide Ranging state, and SPY settled at $769.49 after a session high of $770.76. The real damage came one minute after the bell, when the earnings misses from Amazon, Intel, and others knocked SPY down more than $3.
Two trades followed. The first was selling the late-morning rally into MSI resistance, targeting MSI support, which was reached cleanly even though there was no follow-through to lower targets. The second came after the rapid rescaling lower in the PM session. That trade was selling the test of the new MSI resistance in the bearish state, targeting MSI support at $766.50, which was reached before the MSI rescaled higher. Once the MSI moved into a wide Ranging state into the close, there was nothing clean left to take, and sitting on your hands was the right call. At minimum it was a 2-for-2 session for traders following the framework.
SPY slipped 0.37% on volume of 31.51 million shares, still below average, so conviction was lacking even on a down day. The VIX dropped 2.42% to 16.50, which shows the selling didn't spark much fear. It was a volatile but readable day with substantial setups, all identified through proper context, patience, and flexibility while leveraging the MSI, premarket levels, and market structure rather than forcing trades. The MSI continues to prove its reliability as the cornerstone of our trading process.
Trading Strategy Based on MSI:
Friday has relatively light economic news, with only the medium-impact Employment Cost Index q/q at 8:30 AM ET. That means the market is likely to move more sideways than trend given the Bearish Trending state at the close. But with such a narrow range, it is also likely the MSI rescales overnight and a short squeeze pushes price back to test higher levels. Traders will still be digesting the after-hours earnings misses from Amazon, Intel, and others, so the overnight reaction will matter early. The MSI closed in a narrow $0.99 Bearish Trending state. SPY closed above the range, so $767.79 now acts as support for Friday, with $766.8 beneath it.
Bulls want to see overnight price hold $767.79 and climb back toward the $769.49 close. From there they need to push through Thursday's $770.76 high with the MSI rescaling higher. That would confirm a relief rally and shake out the late shorts. Bears want to see $767.79 and then $766.8 fail, with the MSI rescaling lower and extended targets printing below. That would press SPY back toward Thursday's $766.62 low and the $766.50 level where the MSI found support during the PM session.
In a narrow Bearish Trending state, price is coiling within a tight range, and that narrow width signals less conviction. Friday may continue the downward pressure, but it is just as likely to see a relief rally or an overnight rescale higher. Expect some chop around current levels. If SPY holds $767.79 from above, dips into that level are a buying opportunity targeting $769.49 and $770.76. If price slips back inside the range, a rally into $767.79 that gets rejected offers a short back to $766.8. If SPY breaks below $766.8 with extended targets printing below, sell rallies into $766.8 targeting $766.62 and $766.50. A failed breakdown below $766.8 that quickly reclaims the level is a long back toward $767.79. If the MSI rescales higher overnight, buy dips into the new support while targeting the upper line. Keep size light around the 8:30 AM ET release and let the MSI confirm direction before pressing.
The long-term bull trend remains intact above $640 and failed breakouts and failed breakdowns continue to offer the highest-probability setups. Remain flexible, avoid trading during Ranging Market States unless a clear failed breakout or breakdown presents itself, and ensure all trades are fully aligned with MSI signals. Providing real-time insights into market control, momentum shifts, and actionable levels, the MSI when integrated with our Pre-Market and Post-Market Reports continues to sharpen execution precision and elevate trade quality. If you haven't yet integrated MSI and our model levels into your process, now is the time. Contact your representative to get started as these tools are designed to support consistency and enhance performance.
Dealer Positioning Analysis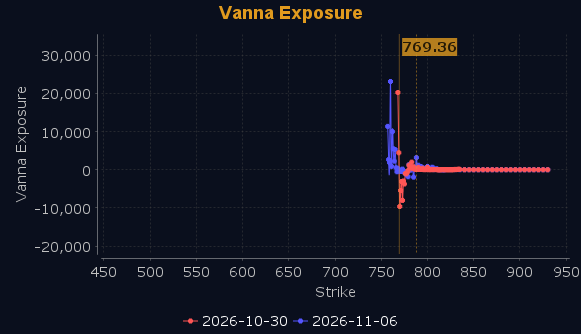
Dealers are selling SPY $774 to $790 and higher strike Calls while buying $770 to $773 Calls, indicating the Dealers' desire to participate in any relief rally on Friday. Buying those ATM Calls is a notable shift, and it tells us the smart money wants a seat at the table if buyers show up. The ceiling for Friday appears to be $783. To the downside, Dealers are buying $769 to $710 and lower strike Puts in a 3:1 ratio to the Calls they're buying, displaying continued concern that prices could move lower. There is a Call wall at $770 which will act as resistance, with a Put wall below at $765 that is unlikely to hold as support should price reach that level. Below $770 is bearish and above $772 is bullish, with chop and traps in between. Gamma is sitting right at the border between positive and negative, so rallies are likely to be sold, while pullbacks below $770 may pick up steam and head lower. Dealer positioning is unchanged at neutral/slightly bullish.
Looking Ahead to Next Friday:
Dealers are selling SPY $770 to $805 and higher strike Calls while buying $779 and $785 Calls, indicating the Dealers' desire to participate in any relief rally next week should price break above major resistance. The ceiling for the week appears to be $788. To the downside, Dealers are buying $769 to $695 and lower strike Puts in a 4:1 ratio to the Calls they're buying, showing they remain heavily hedged and are still guarding against a deeper pullback. There is a Call wall at $780 which will provide resistance, with a Put wall at $767 that also needs to be cleared for the bulls to take back control of the market. Because Gamma is negative, that Put wall overhead is unlikely to hold once price reaches it. Below $767 is bearish and above $775 is bullish, with chop and traps in between. Gamma flips positive as price approaches $780, so SPY is more likely to mean revert than push to new highs. Below $767, a break of $763 could lead to significantly lower prices. For the week Dealer positioning is unchanged at bearish. We advise reviewing Dealer positioning daily for directional clues. These positions evolve quickly and tracking them is essential for staying ahead of shifting market sentiment.
Recommendation for Traders
Short rallies near $770, targeting $768 and $766, with stops above $771.
With the Employment Cost Index hitting at 8:30 AM ET, keep size light and review the premarket analysis posted before 9 AM ET for any changes in the model's outlook and Dealer Positioning.
Good luck and good trading!
