
Market Insights: Thursday, October 22nd, 2026
Market Overview
Stocks slid on Thursday as worries over AI spending and the cost of capital came roaring back, hammering chipmakers and hyperscalers after earnings from Tesla and Meta. The Dow finished just above the flatline, but the S&P 500 fell 1.2% and the Nasdaq tumbled 2.6% as semiconductors erased Wednesday's gains and tech took the brunt of the beating. Meta tanked nearly 7% as investors weighed its quarterly results and a 2-for-1 stock split announcement. Tesla swung around after an earnings beat before closing down 3%, as Wall Street balanced lower 2026 capex against heavier spending in 2027 and 2028 on Optimus, Cybercab, and Terafab. SpaceX gave back more than half of its post-earnings pop, and neocloud provider CoreWeave sank 10% as cost-of-capital fears put debt-heavy balance sheets back under the microscope. IBM CEO Arvind Krishna touched the same nerve on Wednesday's earnings call, saying larger enterprises are "a lot more cognizant" of the true ROI on their AI spend and are "getting worried if some of the AI spending is completely out of control with no real return." Investors ran to bonds, pushing Treasury yields lower even as oil hit a five-month high. A report that the US and Israel are preparing renewed attacks on Iran after the midterm elections sent Brent to $113 a barrel and WTI to $100, with a deadly attack at a Saudi Arabian airport and oil field adding more pressure. Still, if oil is about to spark an inflation wave, the bond market clearly hasn't gotten the memo.
Blackstone bucked the trend, climbing 8% on an upbeat outlook for upcoming investment sales despite weaker third-quarter earnings tied to elevated borrowing costs. Moderna went the other way in a big way, plunging more than 20% and heading for its worst day since going public in December 2018 after results from its melanoma vaccine study leaked on social media. The vaccine, whose initial announcement sent shares soaring more than 100%, is designed to prevent the skin cancer from spreading or coming back. According to TD Cowen analyst Tyler Van Buren, it cut the risk of the cancer spreading by 38% in high-risk patients compared with standard treatment. That looked strong but fell short of investor hopes, per The Wall Street Journal, and the full details were expected Saturday at the European Society for Medical Oncology conference. Crypto joined the broader risk-off move as geopolitical tensions climbed, with Bitcoin dropping below $82,000 and trading around $81,600 Thursday morning, down more than 3% over 24 hours as other major coins also fell. CoinMarketCap showed crypto's total market value down 1.4% over that span, while CoinGlass tracked roughly $400 million in liquidations. On the economic front, jobless claims fell to 194,000 last week, the fewest in three months, a reminder that layoffs remain low.
SPY Performance
SPY opened at $766.37, gapping down hard from yesterday's close of $773.17 and starting the session below the $766.71 floor we flagged as the most important support level. That gap wiped out the entire breakout attempt before the opening bell even rang, and it skipped right past the $772.87 level and the $768.40 to $769.32 support pocket without giving buyers a chance to defend them. Buyers did try to push back early. SPY bounced to a session high of $767.71, briefly reclaiming $766.71, but the rally stalled well short of that old support pocket and sellers took control from there. SPY slid to a session low of $761.17 and finished at $764.06, closing below both the $766.71 floor and the $764.44 level that we said would come into play if that floor gave way.
SPY fell 1.17%, and unlike the past two sessions, it closed below its open. That means sellers weren't satisfied with the overnight gap. They kept pressing during regular trading, which is a meaningful shift in tone. The volume tells an even more important story. Turnover jumped to 43.48 million shares, near average and well above the thin participation that carried the recent three-day rally. That's the key problem for the bulls. The climb into the ceiling happened on shrinking volume, and the reversal came on real volume, which suggests sellers showed up with more conviction than buyers ever did. The skepticism we raised about that low-volume breakout attempt turned out to be justified. The VIX spiked 17.39% to close at 19.58, a sharp jump that erased the calm that had been building and pushed it right up against the 20 mark. The complacency we warned about got punished quickly, and demand for protection came roaring back in a single session. A VIX close above 20 would signal that fear is taking hold rather than just flaring up. The big question now is whether this was a one-day shakeout or the start of a deeper pullback. SPY broke through multiple support levels in one session, and the bounce attempt failed below $767.71, so the burden of proof has shifted to the bulls. On the upside, $764.44 is the first level SPY needs to reclaim, followed by $766.71, which has now flipped from support to resistance. Today's high of $767.71 sits just above that, and getting back into the $768.40 to $769.32 pocket would go a long way toward repairing the damage. On the downside, today's low of $761.17 is the first marker to watch, and a close below it would signal that sellers aren't done yet. Yesterday the bulls cracked the ceiling on weak volume, and today the bears answered by breaking the floor on much stronger volume. Until buyers can reclaim $766.71 with real participation behind them, the momentum belongs to the sellers.
Major Indices Performance
The Dow took the top spot, but just barely, inching up 0.02% in a session where simply staying positive counted as a win. Blue chips held their ground while tech got hammered, and that resilience says a lot about where money was hiding. Industrials, financials, and other old-economy names acted as a shelter as investors shuffled out of high-flying growth stocks and into steadier corners of the market. The Dow didn't add much after back-to-back strong sessions, but it held firm when the rest of the market was getting knocked around. That kind of defensive strength shows that confidence in the broader economy hasn't cracked, even if appetite for risk took a hit.
The Russell 2000 finished second with a tiny 0.06% loss, which is impressive given how ugly things got elsewhere. Small-caps have been bouncing between leading and lagging as the rotation trade swings back and forth, and this time they managed to sidestep most of the damage. Holding nearly flat on a day when growth stocks were being dumped shows that buyers are still willing to stick with the riskier end of the market as long as the selling stays concentrated in tech. Small-caps have now held onto their recent breakout for several sessions, and that's a quiet sign of underlying strength.
The Nasdaq brought up the rear with a painful 2.6% drop, completely erasing the prior session's rebound and then some. Heavy selling in mega-cap tech dragged the index lower, with one of the market's biggest names suffering a brutal hit that rippled across the entire growth trade. The rotation flipped hard once again, and this time investors weren't in a dip-buying mood. When the market's heaviest hitters get sold this aggressively, it tends to shake confidence across the board. The S&P 500 slipped as its heavy tech weighting worked against it, landing in between the Dow's resilience and the Nasdaq's slide. The VIX jumped 17.39% to close at 19.58, pushing right up against the 20 level and signaling that fear came rushing back into the market as tech led the selloff.
Notable Stock Movements
Meta was the biggest mover in the Magnificent Seven, and it was a painful one. The stock plunged 6.98% to lead the group lower, giving back the footing it had just found last session and reminding traders how quickly sentiment can flip on a mega-cap name. A drop that size from one of the biggest names in the market signals real selling pressure rather than ordinary profit-taking. When a leader gets hit this hard, it tends to drag the rest of big tech down with it, and that's exactly what played out. If Meta can't find support quickly, it could remain the weak link that keeps pressure on the whole group.
The group as a whole flipped back to a mostly red session, wiping out the strong green day that had put big tech leadership back on track. Apple was the lone bright spot, gaining 1.23% to finish as the only winner of the seven. That's a notable split, because it shows traders hiding out in the most defensive, cash-rich name while dumping the higher-growth plays. Six losers out of seven tells you the rotation away from growth is back in force, and the momentum that had buyers chasing names like Tesla ran into a wall. One rough day doesn't break the bigger trend, but it does put the recent rebound in question.
The broader market makes it clear this was a tech-specific selloff rather than a market-wide panic. The Nasdaq took the brunt of it with a 2.6% drop, while the Dow eked out a 0.02% gain and the Russell 2000 slipped just 0.06%. That kind of split shows money rotating out of big tech and into other corners of the market instead of fleeing stocks altogether. Still, the VIX jumped 17.39% to 19.58, pushing fear right up against the key 20 level and signaling that traders are getting nervous. Friday brings Flash Manufacturing PMI and Flash Services PMI at 9:45 AM ET, followed by Revised UoM Consumer Sentiment and Revised UoM Inflation Expectations at 10:00 AM ET, and that data could spark big swings in these names early. If Meta stabilizes and Apple keeps holding up, the Nasdaq could find its footing. But if the selling in big tech spreads further, the tech-heavy index could keep leading the market lower.
Commodity and Cryptocurrency Updates
Crude oil snapped its three-day losing streak, climbing 2.21% to close at $99.30. The pullback from above $100 turned out to be short-lived, and buyers stepped right back in as soon as the selling cooled off. Crude has rallied well above $70 and far beyond longer-term model expectations, and today's bounce shows the geopolitical tensions and supply disruptions behind the surge still carry real weight. The fear premium may have been trimmed earlier in the week, but it clearly hasn't disappeared. Friday brings Revised UoM Inflation Expectations, and with energy prices this elevated, any uptick in that reading would add fuel to the inflation debate. The bigger concern stays the same: if crude keeps hovering near triple digits, persistent energy costs will keep pressuring inflation and could seriously complicate the Fed's path on rate policy.
Gold gave back its recent stability in a hurry, falling 2.57% to close at $4,043. That erased the calm gain from the prior session and then some, and the timing stands out. Gold usually catches a bid when fear rises, so a sharp drop on a risk-off day suggests traders may have been selling winners to raise cash or cover losses elsewhere. That kind of liquidation can hit even the strongest assets in the short term. The long-term case hasn't changed, with inflation uncertainty, steady central bank buying, and ongoing geopolitical headlines still giving the metal a solid foundation. Still, the bulls need to stop the bleeding quickly, because a deeper slide would put the recent highs further out of reach.
Bitcoin's building momentum came to an abrupt halt, sliding 3.19% to close above $81,332. After two straight green sessions that had buyers feeling hopeful, crypto got swept up in the broader risk-off mood and gave back a big chunk of those gains. That's a frustrating reminder that Bitcoin still trades like a high-risk asset when sentiment sours, rising with the crowd and falling just as fast. The breakout attempt is now on hold, and buyers have to prove they can defend this area before talking about a move out of the recent range. If Bitcoin holds here and stabilizes, the dip could set up another try higher. A break below recent lows, though, would hand control right back to the sellers.
Treasury Yield Information
The 10-year Treasury yield dropped 3.75% today to close at 4.950, its biggest one-day decline in this stretch and a clean break back below the 5% line. That's the relief bond bulls have been waiting for. After a week of every bounce getting sold, buyers finally showed up with real conviction and erased the entire run to fresh weekly highs in a single session. One day doesn't make a trend, but this was a loud move. Whether it was genuine demand or a flight to safety as risk assets wobbled, it changed the shape of the chart.
Against each threshold, the picture improved meaningfully. The 4.5% level where equity valuations start to feel pressure now sits 45 basis points below today's close, down from 65 yesterday. The 4.8% mark that usually triggers broader selling is just 15 basis points back. Most importantly, the 10-year is now 5 basis points under the 5% line for serious risk, pulling it out of the framework's real-trouble zone for the first time in days. The cushion under 5.2%, where the framework calls for a 20% or greater correction, widened from a razor-thin 5 basis points to a much healthier 25. That's breathing room the market badly needed.
Here's the twist: stocks didn't take the gift. The Nasdaq fell 2.6% while the Dow eked out a 0.02% gain and the Russell 2000 slipped 0.06%. Yesterday we said a move under 5% would give small caps room to catch up, and while they held up far better than tech, they didn't rally either. That tells you today's selling wasn't about rates. Growth stocks fell on their own problems, and the bond rally looks partly like money hiding in Treasuries rather than a green light for risk. The VIX jumped 17.39% to 19.58, snapping its cooldown streak, which confirms fear came back even as rate pressure eased.
Friday brings Flash Manufacturing PMI and Flash Services PMI at 9:45 AM ET, then Revised UoM Inflation Expectations at 10:00 AM ET, and that inflation read matters most for bonds. Another jump in crude today works against the bond rally, so a hot expectations number could send yields right back up. The key level is 5%. Holding below it keeps the framework's serious-risk flag off and gives equities a better backdrop once the tech selling settles. A slide toward 4.8% would be the next real sign of relief, while a quick close back above 5% would suggest today was just another head fake in a rising-rate trend.
Previous Day’s Forecast Analysis
Heading into Thursday, our AI model projected SPY's maximum range at $764 to $777, with the Call side dominating in an expanding band. That setup pointed to trending price action broken up by intermittent chop. SPY had settled in the upper part of the projected range, just above the model's first support, so we carried a bullish bias by position. We did caution that the room to run before hitting overhead supply was getting thin. Unemployment Claims at 8:30 AM ET was flagged as unlikely to move the market, leaving technicals and positioning in the driver's seat. The VIX had dropped 3.76% to 16.66, which we noted would help cushion pullbacks.
The line in the sand was $772, with $775 as the first test overhead and $777 at the top of the range, where we favored shorting rallies into heavy supply. Further resistance sat at $780 and $785. On the downside, losing $772 was expected to send SPY toward $768, with $765 and $762 forming the final shelf of support and $760 in play if $762 gave way. The preferred long setup was buying dips at $768, targeting $772, $775, and $777, with stops below $765. A clean retest of $775 as support was the alternative long entry. On the bear side, the primary trigger was a stalled rally into $777, targeting $775, $772, and $768, with stops above $780. We recommended waiting out the first 30 minutes, avoiding the choppy zone between $772 and $775, and keeping bear-side size at half to two-thirds of the bull side unless $768 cracked.
Market Performance vs. Forecast
Thursday's session pushed beyond the lower edge of the model's projected maximum range of $764 to $777 during the day, then closed back inside it. External selling pressure overwhelmed the bullish positioning heading into the open and introduced volatility beyond the model's base case scenario. The model does not account for unpredictable external events, and Thursday showed how outside forces can override a constructive setup. The forecast did say an expanding band made a directional push out of the current zone likely, and that call proved correct. SPY opened at $766.37, peaked at $767.71, slid to a low of $761.17 and closed at $764.06, down 1.17%. As expected, the Unemployment Claims report was not the story. The level structure still mapped the downside path with impressive accuracy.
The battle at $772 was the key call of the day. The forecast said a failure there could mean a quick trip to $768, and that if $768 couldn't hold, the slide toward $765 and $762 could accelerate. That is the sequence that unfolded, only faster, with SPY opening beneath both $772 and $768. From there, $768 flipped into resistance, and the session high stalled less than a dollar below it. Sellers then pressed through $765 and $762. The forecast warned that a break of $762 left little support until $760, and the low stopped just above that $760 target. Buyers then reclaimed $762 and lifted SPY back inside the projected range by the close, so the lower support zone framed both the flush and the recovery. The upside levels at $775 and $777 never came into play.
On the rising market side, the preferred long trigger required a pullback that tagged $768 and held. Price opened beneath that level and never reclaimed it, so the setup never activated and capital stayed protected on the sidelines. The guidance to let the first 30 minutes show their hand before committing kept traders from fighting the early weakness. On the falling market side, the primary short at $777 never triggered. However, the forecast explicitly said that if $768 cracked, shorts could take the lead, and the session opened with that condition already met. The roadmap from $768 down to $765, $762 and then $760 gave bears clear profit targets all day. The setup to short a failed retest of $762 from underneath also lined up with the action, with $760 as the stretch target on a heavy trend-down day.
The VIX rose 17.39% to 19.58, a sharp jump in fear that still left it just below the 20 line. That spike confirms that external catalysts, not the model's base case, drove the size of the move. The 0.5-0.75% stop discipline and the advice to keep bear-side exposure smaller until $768 broke kept risk management protocols firmly in place. Volume came in near average, which suggests the selling was orderly rather than panicked. The breakdown through $768, the flush toward $760 and the late recovery back inside the range all played out across levels the forecast had already named. The framework adapts as conditions shift. With the long-term bull trend intact above structural support near $640, it remains a reliable guide for managing risk and spotting opportunity as the week unfolds.
Premarket Analysis Summary
The premarket analysis, posted before the opening bell, set up Thursday with SPY at $758.20 in a put-dominated tape. Price was gapping sharply lower after Wednesday's rejection at $770 bled back to $765, which left it opening below the entire week's range with heavy interest stacked overhead from $760 to $768. The bias hinged on $760, the defining level, a major round number, and the first thing buyers had to take back. Reclaiming and holding it would let the gap fill, while failing there would hand sellers control into the weekly close. The expected move ran from $750 to $764, about six points, though the notes warned that participants were bracing for bigger swings after a gap that size. Upside targets stepped through $762 as the first target, $764 as the next decision point at the top of the expected move, $766 as the spot where price should stall, and $768 as max upside, the top of the band and where the week's floor used to be. On the downside, $757 was the first level beneath spot, followed by $755 with little support in between, $752 as the point of last hope, and $750 as max downside.
The session played out on the bullish side of the map, with the gap repairing itself before the cash open. SPY opened at $766.37, already well above the $760 gate and sitting right at the stall zone, so the downside ladder never came into play. Sellers pressed from there, and the low printed at $761.17, slipping under $762 but holding above the $760 gate. That was as far as the bears got, so $757 and everything below it went untouched. On the upside, the high reached $767.71, clearing $766 but falling short of the $768 max upside. SPY closed at $764.06, down 1.17% on 43.48M shares of near-average volume, finishing just above the $764 decision point at the top of the expected move. The VIX jumped 17.39% to 19.58, confirming that the fear the notes described was real even though the price damage stayed contained. The key takeaway is that buyers held the $760 gate all session, which kept the day inside the upper half of the band. With $768 still capping the rebound, bulls need to retake that old weekly floor, while $762 and $760 remain the levels to defend.
Validation of the Analysis
Thursday's session ended up running almost entirely on the upper half of the premarket map. The notes were written with spot at 758.20, but by the opening bell the picture had changed. SPY opened at $766.37, well above the $760 level the notes called "the gate right above us" and "the first thing buyers have to take back." The notes laid out exactly what that meant: "reclaim and hold it and this gap can fill." The reclaim happened before the bell, and the rest of the day showed how well the upside levels held. SPY opened between $766, "where price should want to stall," and $768, the "max upside." That is exactly where the session topped. The high printed at $767.71, stalling just under $768. The notes described $768 as "where this week's floor used to be," and that old support acted as new resistance almost perfectly.
On the way down, the ladder worked just as cleanly. Sellers pushed price through $764 and briefly under $762. The low came in at $761.17, holding above the $760 gate by just over a point. Because $760 was never lost, the entire downside sequence of $757, $755, the $752 point of last hope, and the $750 max downside never came into play. The close was the most precise part of the day. SPY finished at $764.06, down 1.17%, landing within pennies of the $764 level the notes flagged as "the next decision point at the expected move top." The notes also put the expected move at "about six points" and said participants were "bracing for larger swings." The session's high-to-low spread came in just over that six-point estimate, and the VIX jumped 17.39% to 19.58. That fits the put-dominated, nervous tone the notes described, even though price held the higher levels.
The trading value came from knowing which levels mattered once the open landed far from the premarket spot. Traders following the map knew the stall zone was between $766 and $768. The weak push into $767.71 gave short-term sellers a clean fade setup with risk clearly defined above $768, and $764 and $762 served as natural profit targets on the way down. The dip under $762 could have scared off longs. Traders watching the map, though, knew $760 was the line that decided the session. Buyers who stepped in near $761 got a tight-stop entry just above the gate, with $764 as a logical first target. Price reached that target and closed right on it. The map was just as useful for keeping traders out of bad trades. As long as $760 held, there was no reason to press shorts toward $757 or $755, and the $768 ceiling warned against chasing longs into the close. A session that topped just under max upside, bottomed above the defining gate, and closed on the expected move top shows how well these levels framed the action. Heading into Friday, the lines are clear: bulls need to clear $766 and take back $768, while bears need to break $760 to bring the lower targets back into play.
Looking Ahead
Friday's calendar is busier than Thursday's, with four medium-impact releases packed into the first half hour of the cash session. The Flash Manufacturing PMI and Flash Services PMI both hit at 9:45 AM ET, giving traders an early look at how business activity held up in October. These flash readings are among the first pieces of data for the month, so they often move markets more than the later final versions. Services carries extra weight because it covers the bulk of the U.S. economy. A strong reading would back the idea that growth is still on solid footing, while a drop toward contraction territory could raise fresh questions about whether the economy is losing steam. Then at 10:00 AM ET comes the Revised UoM Consumer Sentiment and Revised UoM Inflation Expectations. Sentiment shows how households feel about their finances and spending plans. The inflation expectations piece matters even more for rate watchers, since a jump in what consumers expect prices to do could make policymakers more cautious about easing.
With the PMI numbers and the UoM figures landing just 15 minutes apart, expect some choppy action right after the open. The first move off the PMI data can easily get reversed once the sentiment and inflation expectations figures cross the wires, so don't chase the initial reaction. Give the market until at least 10:30 AM ET to digest everything before deciding which way it really wants to go. Pay close attention to whether the PMI and inflation expectations data tell the same story or clash with each other. Strong activity paired with rising price expectations could be a mixed bag for stocks, while softer activity and cooler expectations could be read as good news for rates. It's also a Friday, so some traders may lighten up ahead of the weekend, which can exaggerate late-day moves. Keep your levels mapped out, size positions sensibly, and let price confirm direction before committing new capital.
Market Sentiment and Key Levels
Thursday handed control back to the bears, and big tech took the hardest hit. Sellers stepped in after a brief early push higher and kept the pressure on for most of the session, with only a modest bounce off the lows into the close. Unlike the light participation we saw during the recent grind higher, volume ran near average, which gives this selloff more credibility than a quiet drift lower would have. The damage was concentrated, though. The Nasdaq tumbled 2.6% while the Dow eked out a 0.02% gain and the Russell 2000 slipped just 0.06%. That split tells us this was a targeted exit from growth names rather than a broad liquidation, since money rotated out of mega caps instead of fleeing stocks altogether. That's a mixed signal. A market that leans this heavily on tech can't shrug off a hit like this easily, but the steadiness in blue chips and small caps suggests investors are repositioning, not panicking. Risk appetite cracked elsewhere too, as Bitcoin dropped 3.19%, and gold fell 2.57%, showing that even the hedges got sold. Fear jumped, with the VIX rising 17.39% to 19.58, pushing the fear gauge right up against the 20 mark. Bears own the short-term tape, and buyers will need to show up quickly to change that.
SPY is hovering just above first support at $762, with first resistance overhead at $767. If buyers can push through $767, the next target is $770, followed by $773 and $775 if tech finds its footing. On the downside, losing $762 likely sends SPY toward $760, then $757 and $755. If $755 breaks, there is little to keep price from falling toward $750. Step back and the bigger picture still looks healthy, with the long-term bull trend intact well above structural support at $640. That keeps this a broader dip-buying environment as long as key levels hold, but one rough session in tech doesn't make a buy signal on its own. Friday's projected maximum range runs from $756 to $772, with the Put side dominating in an expanding band that points to trending price action mixed with intermittent chop. SPY closed in the middle of that range, leaving room to move in either direction. The calendar won't be quiet on Friday, October 23. Flash Manufacturing PMI and Flash Services PMI hit at 9:45 AM ET, followed by Revised UoM Consumer Sentiment and Revised UoM Inflation Expectations at 10:00 AM ET. With the PMI data on deck, expect significant volatility, especially in the first hour of trading. Traders will want to see whether the tech selloff carries into a second day or whether the steadiness in the Dow and small caps helps cushion the broader market. Yields stayed elevated even after pulling back, and firm oil prices keep inflation worries in the background, which won't help if the inflation expectations data comes in hot. With the Put side in charge, we favor shorting rallies near $767 rather than trying to catch a falling knife. Keep stops tight above that level, watch whether $762 holds through the morning data, and let the bulls reclaim $767 before getting aggressive on the long side.
Expected Price Action
Friday's session brings actionable intelligence generated by our AI model, which projects SPY's maximum range at $756 to $772. With the Put side dominating in an expanding band, the model is calling for trending price action with intermittent chop. Friday morning is loaded, with Flash Manufacturing PMI and Flash Services PMI hitting at 9:45 AM ET, followed by Revised UoM Consumer Sentiment and Revised UoM Inflation Expectations at 10:00 AM ET. With the PMI data on deck, these releases are likely to produce significant volatility, especially in the first hour of trading. Thursday's tape belonged to the sellers, who leaned on price for most of the session after the early push higher fizzled. That leaves SPY parked right in the middle of the projected range, hovering just above the model's first support. On position alone that is neutral, but the Put-heavy band tips the scales and gives us a bearish bias heading into Friday. The VIX rose 17.39% to 19.58, a sharp jump in fear that tells us traders are paying up for protection and won't be quick to chase bounces. With an expanding band and market-moving data on the calendar, a directional break out of the current zone looks likely.
The line in the sand for Friday is $762, the model's first support sitting just beneath where SPY finished. If that level gives way, price likely slides toward $760, and below that $757 and $755 form the final shelf of support, with $755 standing as the lowest support and the point of last hope for bulls. If $755 breaks, there is little to keep price from falling toward $750. On the upside, buyers need to push through $767 to change the tone, and that's exactly where we favor shorting rallies, since the Put side is in charge and overhead supply is heavy. A clean break above $767 opens the door to $770, with $773 and $775 standing as further resistance, though reaching those levels would take a real catalyst, like a strong PMI surprise. The bigger picture remains healthy, with SPY trading well above structural support near $640 and the long-term bull trend intact, so this is still a dip-buying market on a broader timeframe. In the short run, the playbook is straightforward. Let the PMI and sentiment numbers hit and give the first hour time to shake out before committing. A failed bounce into $767 sets up a short with $762 and $760 as the first targets, while a break of $762 could accelerate the slide toward $757 and $755. If buyers manage a firm push through $767, step aside and let $770 prove itself before fading again. Whichever side wins the battle at $762 or $767 likely sets the trend for Friday's session.
Trading Strategy
The VIX rose 17.39% to 19.58, jumping toward the 20 line as fear flooded back into the market and sellers grabbed control. With the Put side dominating an expanding band, cut size to roughly half to two-thirds of normal until the tape settles down. Keep stops in the 0.5-0.75% range from entry. Friday brings Flash Manufacturing PMI and Flash Services PMI at 9:45 AM ET, followed by Revised UoM Consumer Sentiment and Inflation Expectations at 10:00 AM ET, so expect sharp swings in the first hour before trending action with intermittent chop takes over. Sit on your hands until the 10:00 AM releases are digested, and avoid getting trapped in the tight middle zone between $762 and $767 where the chop does its damage.
In a falling market scenario, shorting a rally into $767 is our preferred setup, and it lines up directly with the model's bearish lean. A push into $767 that stalls and rolls over is the cleanest trigger, especially if the VIX keeps climbing while price fails to break higher. The first profit target is $762, with $760 next if sellers keep pressing. Runners can aim for $757, and $755 should be treated as a stretch target on a heavy trend-down day. Stops on shorts belong above $770, and aggressive traders can give it room up to just below $773. If price loses $755 with conviction, don't chase the breakdown. Short a failed retest of $755 from underneath instead, targeting $750 as the final stretch target. Take profits in layers into support rather than swinging for the fences, because fast drops can snap back hard.
In a rising market scenario, buying a dip at $762 is the setup to watch on the bull side. A pullback that tags $762 and holds is the primary long trigger, particularly if the VIX starts to cool off while price firms up after the economic data. The initial profit target is $767, with $770 in play if buyers take over. Stops on longs belong below $760, just beneath the next support shelf. If bulls punch through $767 and hold it, buy a clean retest of $767 as support, targeting $770 and then $773 as a stretch target on a strong squeeze day. With puts still in control, keep bull-side size at roughly half of the bear side unless $767 is reclaimed, at which point longs can take the lead. The long-term bull trend remains intact above $640, so dip-buyers will likely step up on deeper pullbacks. For now, the bears have the edge as long as $767 caps the upside.
Model’s Projected Range
SPY's projected maximum range for Friday is $756 to $772, with the Put side dominating in an expanding band that suggests trending price action with intermittent chop. Friday brings Flash Manufacturing PMI and Flash Services PMI at 9:45 AM ET, followed by Revised UoM Consumer Sentiment and Revised UoM Inflation Expectations at 10:00 AM ET, and with the PMI data on deck these releases are likely to produce significant volatility particularly in the first hour of trading. SPY closed at $764.06, down 1.17%, after opening at $766.37, pushing up to a high of $767.71 early, and then sliding to a session low of $761.17 before bouncing modestly into the close. SPY is trading near our model's first support at $762, with shaky macro sentiment keeping traders defensive and sellers in control for most of the day. If buyers can push through $767, the next target is $770, but if $762 gives way, price likely slides toward $760, and if the lowest support at $755 breaks there is little to keep price from falling toward $750. The long-term bull trend remains intact above $640 with SPY well above structural support. As long as price holds above key structural levels, this remains a broader dip-buying environment. Absent a catalyst, resistance sits at $767, $770, $773, $775, while support rests at $762, $760, $757, $755. With the Put side in charge and SPY closing in the middle of the range, we favor shorting rallies near $767. Bitcoin dropped 3.19% but managed to close above $81,332, while the MAG stocks had a mostly red day led by Meta falling 6.98%, with Apple the lone bright spot, gaining 1.23%. Sustained weakness across both leadership groups would be required to signal a deeper pullback. The VIX closed at 19.58, up 17.39%, suggesting elevated fear given the broad selling in big tech and crypto. SPY remains well above its broader uptrend structure with structural support near $640.
Market State Indicator (MSI) Forecast
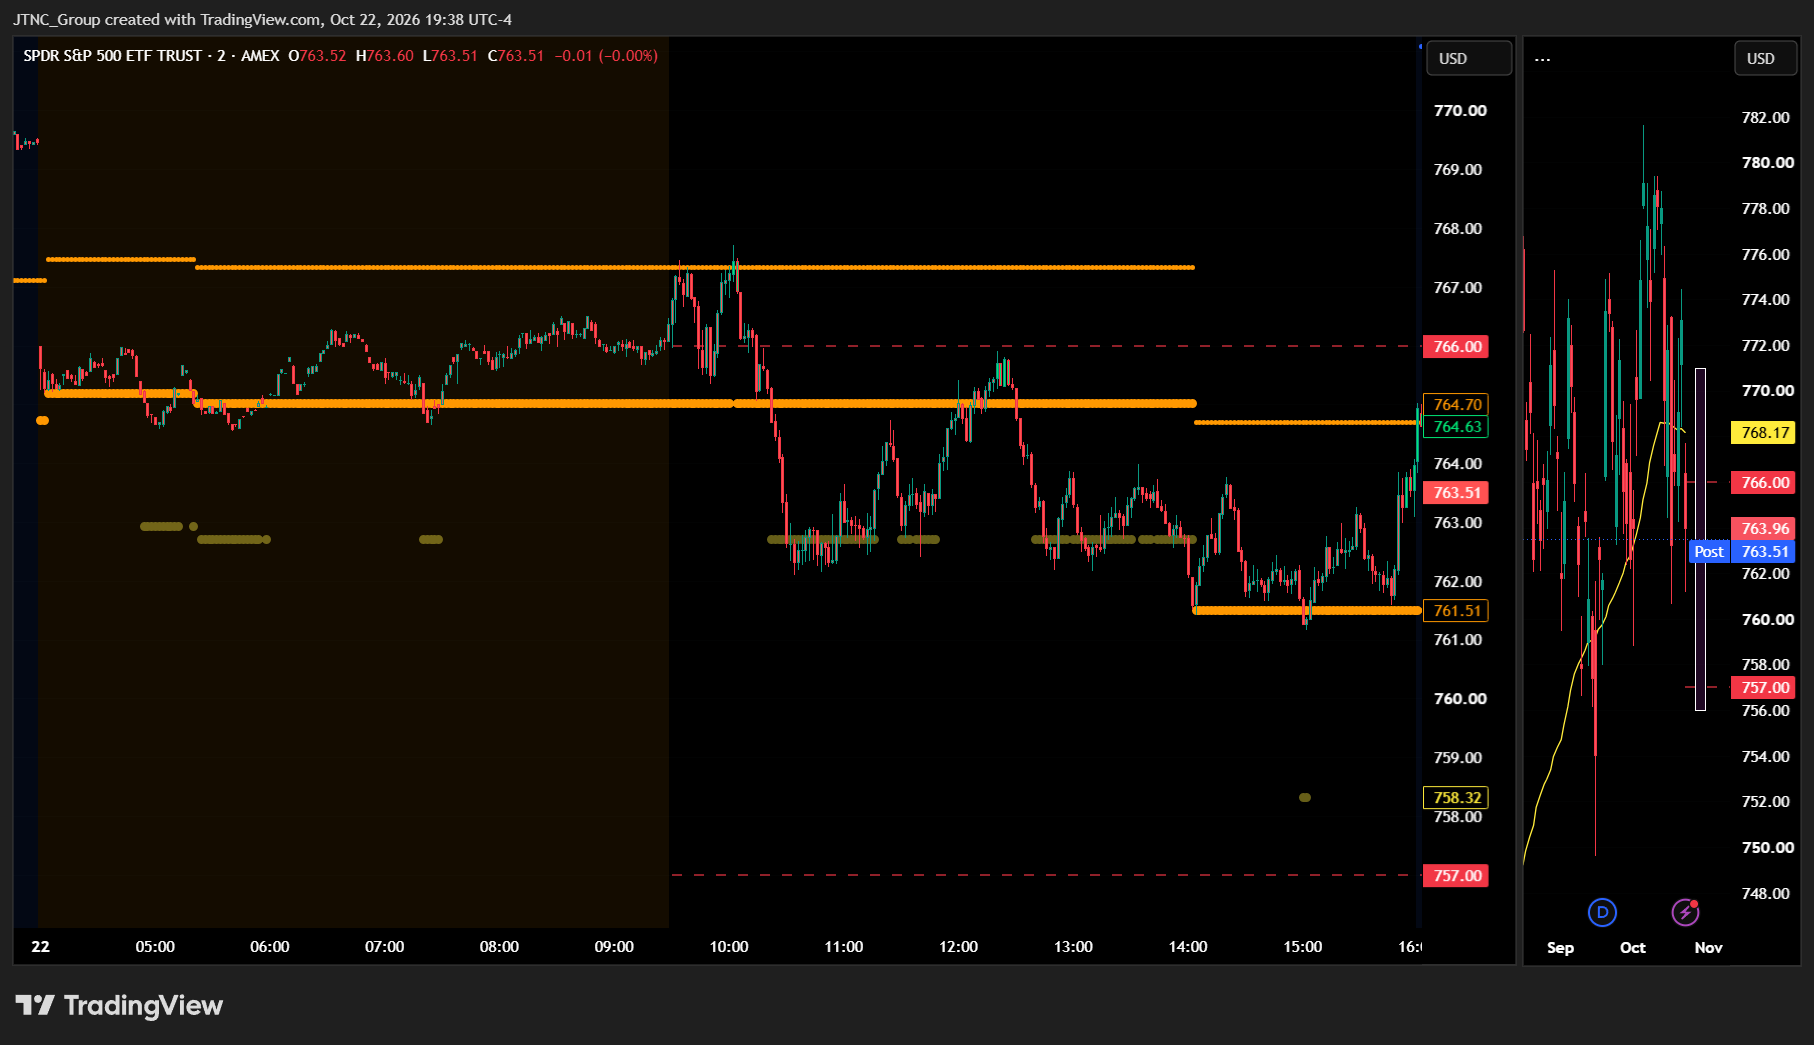
Current Market State Overview:
The MSI ended Thursday in a Bearish Trending Market State with SPY closing at $764.06. MSI resistance is $764.7 and MSI support is $761.51 heading into Friday. The MSI rescaled lower overnight as SPY gapped down in the premarket, flipping into a Bearish Trending state with extended targets visible below the lower MSI line before the opening bell. That bearish state carried into the open, and extended targets kept printing below through the AM session as sellers pressed. In the PM session the MSI rescaled lower once again and settled into its final Bearish Trending state, with extended targets still printing below for much of the afternoon. By the close, though, the extended targets were gone. It was a rough, volatile day across the board. QQQ fell close to 3%, and while SPY held up better, it still closed well below its 50 DMA. The MSI finished with a wide $3.19 range, which gives price plenty of room to move without forcing another rescale.
For Friday that implies a slow grind lower, though without extended targets at the close the downside may be limited and is likely to find support at key levels below. The bearish state says the path of least resistance is still down. The lack of extended targets says the selling pressure is starting to fade, and a bottom may be near. Expect buyers to show up at support, and expect sellers to defend MSI resistance. MSI support is $761.51 with resistance at $764.7.
Key Levels and Market Movements:
Wednesday we stated, "Bulls want to see overnight price hold above $771.89 and stay near the $773.17 close," and added, "Bears want to see $771.89 fail with the MSI rescaling lower and extended targets printing below," while also noting, "That would press SPY back toward Wednesday's $771.17 open and $770.41, with Wednesday's $768.40 low in play if the selling picks up." The bears got everything they asked for, and they got it before the opening bell. The MSI rescaled lower overnight, extended targets printed below in the premarket, and SPY opened at $766.37. That put it below $771.89, $771.17, $770.41, and even Wednesday's $768.40 low in one shot. Buyers tried to push back early and lifted SPY to a session high of $767.71, but they couldn't reclaim $768.40. Sellers took over from there and dragged price lower through the AM session with extended targets printing below the whole way.
Three trades followed. The first was the early rally short. With the MSI Bearish Trending and extended targets printing below, the bounce to $767.71 under Wednesday's $768.40 low offered a short into MSI resistance, targeting MSI support and the premarket levels below. The second came after the PM session rescale lower. The new $764.7 MSI resistance offered another short targeting $761.51 MSI support, and SPY followed through to a session low of $761.17. The third was a failed breakdown long. SPY slipped under $761.51 to $761.17, then quickly reclaimed it as the extended targets faded, and traders could buy the reclaim with a stop under $761.17 while targeting $764.7. Price rallied hard into the close and finished at $764.06. At minimum it was a 3-for-3 session for traders following the framework.
SPY fell 1.17% on volume of 43.48 million shares, near average and a big jump from Wednesday's light turnover. That tells us real sellers showed up this time. The VIX spiked 17.39% to 19.58, a sharp return of fear after days of it bleeding out. It was a volatile but readable day with substantial setups, all identified through proper context, patience, and flexibility while leveraging the MSI, premarket levels, and market structure rather than forcing trades. The MSI continues to prove its reliability as the cornerstone of our trading process.
Trading Strategy Based on MSI:
Friday has heavy economic data with Flash Manufacturing PMI and Flash Services PMI at 9:45 AM ET, along with Revised UoM Consumer Sentiment and Revised UoM Inflation Expectations at 10:00 AM ET, which can introduce significant volatility, so traders should be ready to trade what they see rather than predict. The MSI closed in a wide $3.19 Bearish Trending state with no extended targets printing. That points to a slow grind lower on Friday, though the downside may be limited and is likely to find support at key levels below, including MSI support and Thursday's low. $764.7 remains MSI resistance and $761.51 remains MSI support.
Bulls want to see overnight price hold above $761.51 and stay near the $764.06 close. From there they need to reclaim $764.7 with conviction, then push toward Thursday's $766.37 open and the $767.71 high. If the MSI rescales higher overnight, that would be the first sign that Thursday's late bounce has legs. Bears want to see $761.51 fail with the MSI rescaling lower and extended targets printing below again. That would press SPY through Thursday's $761.17 low and into the premarket levels below. With the VIX jumping to 19.58 and SPY sitting well below its 50 DMA, the bears have momentum, but the missing extended targets and Thursday's strong close say they may be running low on fuel.
Since the MSI closed Bearish Trending, the primary setup for Friday is selling a rally to $764.7 MSI resistance that fails, using a push through $766.37 as the warning sign, and targeting $764.06 and then $761.51. A failed breakdown below $761.51 that quickly reclaims the level, just like Thursday's late reversal, offers a long back toward $764.7, and that setup carries extra weight with no extended targets at the close. If $761.51 breaks with the MSI rescaling lower and extended targets printing below, that level flips to resistance, and traders can sell rallies into it while targeting $761.17 and the premarket levels below. If $764.7 breaks with the MSI rescaling higher, that level flips to support, and traders can buy dips into it while targeting $766.37 and $767.71. The bias favors shorts until the MSI shifts, but expect buyers to show up at support.
The long-term bull trend remains intact above $640 and failed breakouts and failed breakdowns continue to offer the highest-probability setups. Remain flexible, avoid trading during Ranging Market States unless a clear failed breakout or breakdown presents itself, and ensure all trades are fully aligned with MSI signals. Providing real-time insights into market control, momentum shifts, and actionable levels, the MSI when integrated with our Pre-Market and Post-Market Reports continues to sharpen execution precision and elevate trade quality. If you haven't yet integrated MSI and our model levels into your process, now is the time. Contact your representative to get started as these tools are designed to support consistency and enhance performance.
Dealer Positioning Analysis
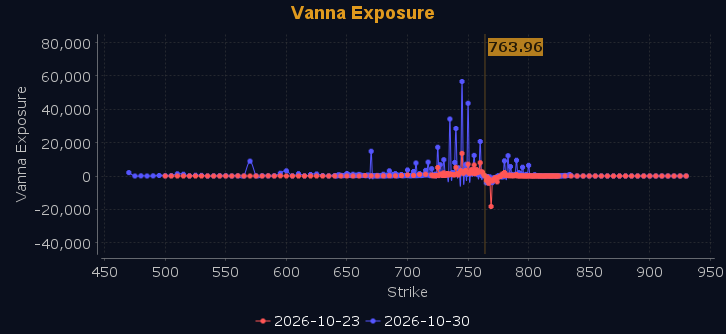
Dealers are selling SPY $775 to $795 and higher strike Calls while buying $764 to $774 Calls, indicating the Dealers' desire to participate in any rally on Friday. They are buying large quantities of ATM Calls, which signals they want to be positioned for any short squeeze that might develop. The ceiling for Friday appears to be $780, but the more immediate hurdle is $770, which carries the highest net gamma on the board and stands as major resistance overhead. Above $770 the market turns bullish. To the downside, Dealers are buying $763 to $705 and lower strike Puts in a 3:1 ratio to the Calls they're selling, displaying continued concern that prices could move lower. Gamma is negative, so support and resistance levels are less likely to hold, and price can travel quickly in either direction. Between $766 and $761 is chop that is likely to be trap filled, while below $761 is decidedly bearish with much lower levels coming into play. Above $766, SPY may rally to $769, but it will likely struggle to break through on the first and second attempts, and immediately after that $770 becomes a wall it must overcome. That's not an easy feat after being down so much on Thursday. Dealer positioning is unchanged at neutral/slightly bullish.
Looking Ahead to Next Friday:
Dealers are selling SPY $775 to $800 and higher strike Calls while buying $764 to $774 Calls, indicating the Dealers' desire to participate in any rally into next week. They are buying ATM Calls to stay positioned for that upside. The ceiling for the week appears to be $783. To the downside, Dealers are buying $763 to $700 and lower strike Puts in a 5:1 ratio to the Calls they're selling, displaying heightened concern that prices could move lower. Dealers have added to their protection in the wake of Thursday's rout. Below $760 is bearish and above $770 is bullish, with the range in between being choppy and trap filled. SPY will find major resistance at $769 and $770 and support at $760. SPY spot sits in the chop zone in a negative gamma environment, which favors trending behavior, and support and resistance levels are more likely to fail than hold. For the week Dealer positioning is unchanged at bearish. We advise reviewing Dealer positioning daily for directional clues. These positions evolve quickly and tracking them is essential for staying ahead of shifting market sentiment.
Recommendation for Traders
Short rallies near $767, targeting $762 and $760, with stops above $770.
Keep size light around the 9:45 AM ET PMI data and review the premarket analysis posted before 9 AM ET for any changes in the model's outlook and Dealer Positioning.
Good luck and good trading!
