
Market Insights: Thursday, October 1st, 2026
Market Overview
Stocks kicked off October with a wild ride Thursday, clawing back from morning losses as bond yields retreated and the AI trade bounced back. The Dow closed just above the flatline, the S&P 500 gained 0.2%, and the Nasdaq inched higher. Stocks hit session lows earlier as long-dated yields pushed to fresh multidecade highs, reaching levels not seen since 2002 and topping the 2007 peaks before the financial crisis. That comes right after the bond market's worst quarter in decades. New manufacturing readings added to inflation worries, but yields eased by the afternoon even as oil prices jumped. Fed Vice Chairman Philip Jefferson struck a more cautious tone than several colleagues, admitting inflation is still too high but saying the Fed should watch whether it cools in a timely way. "Since our September meeting, yields across the term structure have increased further, a sign that investors are reassessing the evolving macroeconomic landscape," he said at the University of Virginia, adding that the Fed will "need to come to our own judgment, which may take more time." Macquarie's Thierry Wizman blames the pressure partly on the Iran war's hit to energy and partly on uncertainty over how it ends, writing that "the perception that global conflict is endemic, may also be causing long-term inflation expectation to stay elevated." President Trump has said he expects the war to wrap up shortly after the midterms but is also weighing a major renewed bombing campaign afterward. That makes war spending hard to forecast. The Strait of Hormuz closure and Gulf infrastructure attacks have sent energy prices soaring, while the Pentagon says the US has spent at least $43.6 billion, and outside researchers think the real figure is far higher. On the labor front, jobless claims fell for a fourth straight week and Challenger, Gray & Christmas showed layoff plans declined in September, though companies aren't rushing to hire. That sets the stage for Friday's jobs report.
Banks took a beating as the past month's rate surge stoked fresh concerns. The KBW Nasdaq Bank Index tumbled as much as 2.4% before paring losses to trade 0.7% below Wednesday's close. It is now back to late-May levels and down more than 13% from its mid-August peak. Citigroup fell 1.9%, PNC dropped 1.8%, and Bank of America slid 1.4%. Tech told a brighter story. Micron climbed after its fourth-quarter earnings beat expectations and it raised its Q1 outlook. A Bloomberg report that Anthropic is eyeing an IPO as soon as mid-November lifted tech at midday. Reuters also reported that Broadcom is lending $42 billion to Anthropic, which is expected to become the chip designer's largest compute customer by next year, another reminder of the circular ties among AI players. Nike reports after the bell with an update on its turnaround, but shifting Wall Street's sentiment will be tough with the stock trading at its lowest levels since 2014.
SPY Performance
SPY opened at $764.36, a third straight gap higher, though this one didn't get much follow-through. Buyers managed only a modest push to a session high of $765.65, which fell well short of yesterday's high and showed that the early enthusiasm was thin. Sellers took control soon after and drove SPY down to a low of $758.79, slicing through yesterday's low and setting another fresh short-term bottom. That's where the story changed. Instead of closing at the lows like the prior session, buyers stepped in with force and lifted SPY all the way back to close at $764.04, just a hair below the open and near the top of the day's range.
SPY gained 0.18%, snapping the three-day losing streak. Volume came in at 42.37 million shares, near average and a bit lighter than yesterday's heavier turnover. That detail is encouraging for the bulls because it suggests the selling pressure that hit the morning lows didn't carry the same size that showed up in the prior session's reversal. The VIX dropped 0.18% to close at 16.31, keeping fear contained even as SPY probed new lows intraday. The most important takeaway is the shape of the candle. A long lower wick with a close near the highs is a classic sign that buyers are absorbing supply at lower prices, the exact opposite of yesterday's failed rally. It's not a confirmed bottom yet, since SPY still finished below the open and below the past few sessions' highs. But after three straight days of sellers using strength to unload, the bulls finally defended a breakdown and turned it into a green close. The next step is follow-through. If buyers can clear the recent highs, this flush could mark the end of the pullback. If not, today's lows become the line the bears will target.
Major Indices Performance
The Russell 2000 led the pack, climbing 0.39% and flipping a slight loss in the prior session into the day's best performance. That's a notable shift for small-caps, which have spent most of the recent pullback stuck near the bottom of the leaderboard. A modest dip in borrowing costs gave rate-sensitive smaller companies some breathing room, and traders seemed more willing to take on risk at the riskier end of the market. One good day doesn't make a trend, but small-caps leading while mega-caps stall is the kind of broadening that bulls want to see.
The Nasdaq and the Dow finished in a dead heat, each eking out a 0.04% gain. For tech, that's a step down from the prior session's leadership. Weakness across much of the mega-cap space kept a lid on the index, and only a couple of standout names in chips and social media prevented a red close. Growth stocks are still holding their ground, but the momentum from the last session clearly cooled as traders hesitated to chase ahead of a big data release.
The Dow's tiny gain snapped its three-day losing streak, which counts as a small win for blue chips after their steep drop in the prior session. Another surge in energy prices helped support the old-economy side of the index, though industrials and financials didn't show much conviction. The S&P 500 also finished modestly higher, with gains spread more evenly across the market rather than concentrated in tech. The VIX dropped 0.18% to close at 16.31, keeping fear contained as traders sat on their hands ahead of the jobs data. With Friday's reports likely to set the tone, the quiet, mixed action looks more like positioning than a real directional bet.
Notable Stock Movements
Alphabet was the day's biggest mover for all the wrong reasons, dropping -1.70% and leading a mostly red session for big tech. That's a notable hit for a name that has often acted as a steady hand in the group, and a slide that size suggests traders were happy to take profits rather than stick around. When a heavyweight like Alphabet stumbles without much fight from buyers, it often signals that money is rotating elsewhere. Alphabet now joins the watch list, and buyers need to show up quickly to keep this from turning into a bigger pullback.
The rest of the Magnificent Seven didn't offer much relief, with most of the group finishing in the red. NVIDIA was the clear bright spot, climbing 1.09% and proving once again that the AI trade still has loyal backers. Meta also managed to finish green, a small but welcome sign after yesterday's stumble, hinting that sellers may be losing some of their grip. Still, two winners against a mostly losing scorecard is a step backward from the broad strength we saw just a day earlier.
That shift says a lot about where traders' heads are at. Big tech lagged while small caps took the lead, with the Russell 2000 outpacing both the Nasdaq and the Dow, a sign money is spreading out instead of hiding in the biggest names. The VIX dipped 0.18% to 16.31, so fear isn't spiking, but nobody's getting too comfortable ahead of Friday's jobs report. NVIDIA's strength is encouraging, but Alphabet's slide shows this leadership group is still split. A lasting rally needs more of the seven pulling in the same direction.
Commodity and Cryptocurrency Updates
Crude oil extended its rebound today, jumping 3.15% to close at $93.27 and building on yesterday's bounce with real conviction. Prices are sitting well above $70, and crude keeps running far ahead of longer-term model expectations. The geopolitical tensions and supply disruptions behind this rally are still in play, and today's strong push higher shows buyers aren't just defending dips. They're actively chasing the move. That's what makes the inflation picture so tricky. If energy prices stay this elevated for an extended stretch, they'll keep feeding into broader price pressures, and that could seriously complicate the Fed's path on rate policy.
Gold followed up yesterday's small gain with a stronger showing, rising 0.47% to close at $4,206. Back-to-back green sessions suggest the recent profit-taking wave is cooling off, and buyers appear more willing to step back in. It's still too early to declare that a firm floor is in place, but the tone has clearly improved. The long-term case for gold remains solid, supported by inflation uncertainty, steady central bank buying, and a constant flow of geopolitical headlines. If this momentum carries into the next few sessions, gold could be setting up for another leg higher after its consolidation.
Bitcoin finally broke out of its sideways funk today, climbing 1.51% and closing above $84,812. After two sessions of drifting with little direction, this move shows buyers are starting to find some urgency again. It's an encouraging sign following the recent string of losses, though one solid day doesn't make a trend. Crypto will need follow-through in the coming sessions to prove this is the start of a genuine recovery rather than just a quick bounce inside a broader holding pattern.
Treasury Yield Information
The 10-year Treasury yield finally blinked today, falling 1.06% to close at 5.240. That snaps a six-session winning streak and marks the first real pullback since the 10-year pushed above the framework's final line. The bond market got through today's Waller remarks and manufacturing data without the breakout higher that many feared, and buyers stepped in for the first time in over a week. One down day doesn't change the bigger picture, though. The 10-year is still sitting in the most dangerous zone on the chart.
Measured against each threshold, the cushion has shrunk but the warning signs remain. The 4.5% level where equity valuations start to feel the squeeze sits 74 basis points below today's close. The 4.8% mark that usually sparks broader selling is 44 basis points back. The 5% line for serious risk is still cleared by 24 basis points. Most importantly, the 10-year remains 4 basis points above 5.2%, the level where the framework calls for a 20% or greater correction. Today's drop pulled yields closer to that line, but it didn't break it. Until the 10-year closes back below 5.2%, the correction signal stays switched on.
The equity reaction lined up with what you'd expect when rates ease. Small caps led the way with a 0.39% gain, and these rate-sensitive companies tend to benefit the most when borrowing cost pressure lets up. The Nasdaq and Dow both managed only 0.04% gains, so the relief didn't spread across the broader market. The VIX slipped 0.18% to 16.31, which is still a calm reading considering where yields are parked. The market seems to be treating today's dip in yields as a breather instead of a turning point, and that's probably the right call for now.
Friday is the real test. Average Hourly Earnings, Non-Farm Employment Change, and the Unemployment Rate all hit at 8:30 AM ET, and jobs data has a long history of moving the 10-year hard. Hot wage growth or a strong payrolls number would likely send yields back toward their recent highs and put the 5.2% correction warning back in focus. A softer report could push the 10-year below 5.2% and give stocks some breathing room. Real relief still requires a sustained move back below 5%, and one quiet session isn't enough to earn that.
Previous Day’s Forecast Analysis
Heading into Thursday, our AI model projected a maximum range of $758 to $770 for SPY. With the Put side dominating in an expanding band, the model called for trending price action with intermittent chop and a bearish bias. That outlook came after SPY settled right on top of first support at $762 following another early push that faded all afternoon. The VIX had risen 1.06% to 16.21, a third straight session of volatility refusing to back down. Unemployment Claims at 8:30 AM ET weren't expected to matter much, but Fed Governor Waller and the ISM Manufacturing PMI, both at 10:00 AM ET, were flagged as likely to shake things up in the first hour.
The forecast made $762 the most important level for buyers to hold, with dip-buying favored right at that floor. A break below it would bring $760 into play quickly, which premarket notes flagged as the heaviest support on the board. Below that sat $758 at the bottom of the range, then $755, with $750 coming into view if $755 failed. On the upside, $766 was the key level to reclaim after flipping from support to resistance, opening a path to $769. Beyond the $770 ceiling, $772 and $775 were marked as overhead supply. The broader trend was still considered healthy, with structural support near $640.
The recommended strategy kept position sizing at 40-50% of normal until the VIX drifted back toward 15. A push through 17 would be the signal to cut long exposure and tighten stops to 0.5-0.75% from entry, and traders were told to let the 10:00 AM reaction settle before committing full size. The long setup called for a hold of $762 and then a drive back through $766, with targets of $769 and $770 and stops below $759.75. The short setup called for fading a stall in the $766-$767 zone, with targets of $762 and $760 and stops above $769.50. A clean break of $762 was shortable at reduced size toward $758, with $750 reserved as a runner target only.
Market Performance vs. Forecast
Thursday's session delivered the trending price action with intermittent chop that the model called for, and the projected $758 to $770 range once again held from open to close. SPY opened at $764.36, between the $762 first support and the $766 pivot the forecast flagged as the level that matters most. The bearish bias proved correct early. Sellers drove price through the $762 floor and then through the $760 zone the premarket notes identified as the heaviest support on the board. The slide carried to a session low of $758.79, which held just above the $758 bottom of the projected range. The deeper cushions at $755 and $750 were never touched. The model does not account for unpredictable external events, but even with Waller and the ISM Manufacturing PMI hitting at 10:00 AM ET, price stayed inside the projected $758 to $770 range all day. From there, the forecast's reminder that this is still a dip-buying market proved accurate. Buyers stepped in off the range floor and pushed SPY to a session high of $765.65, just shy of the $766 resistance the model said had flipped from support. That level capped the rebound exactly as expected, and SPY closed at $764.04, up 0.18%.
On the rising market side, the preferred long trigger required holding $762 and then driving back through $766, and neither condition materialized. That kept disciplined traders from committing to a breakout the tape never confirmed. Any early dip-buys near $762 saw the session low slip beneath the $759.75 stop, so risk management protocols protected capital before the range floor held. The $769 and $770 profit targets stayed untested. The caution against chasing a post-10:00 AM spike was never needed, because the rebound stalled beneath $766 instead of breaking out.
The falling market scenario proved its worth. The rebound topped out just below the $766-$767 fade zone, which confirmed that band as overhead supply, though the high never quite reached it to trigger a clean fade entry. The breakdown setup was the star of the session. Once $762 gave way, reduced-size shorts reached the $760 secondary target, and the move came within a dollar of the $758 range-bottom target before reversing. The framework's advice to cover in layers into support and not overstay was especially valuable here, because buyers reclaimed nearly all of the losses by the close. The $769.50 short stop was never threatened. Near-average volume showed steady participation behind both the morning flush and the afternoon recovery.
The VIX dropped 0.18% to 16.31, staying well beneath the 17 threshold the forecast flagged as the trigger to cut net long exposure. Since that line was never crossed, the 40-50% position sizing stayed in place, and that kept risk measured through a session that swept both sides of the range. The advice to let the 10:00 AM reaction settle before committing full size fit a morning that pushed through multiple support levels before turning higher. The $766 resistance cap, the $760 breakdown target, the untouched $755 cushion and the $758 range bottom all gave traders clear, actionable guidance. The framework continues to adapt to shifting conditions and gives traders a reliable structure for managing risk and spotting opportunity heading into the next session.
Premarket Analysis Summary
The premarket analysis, posted at market open, set SPY's projected maximum range between $758 and $770, with the Put side dominating in an expanding band that pointed toward trending price action with intermittent chop. That outlook came after Wednesday's tape repeated the week's familiar script, with an early push that faded steadily into the close. That left SPY parked in the lower half of the range and right on top of first support at $762, which earned a bearish bias heading into Thursday. The analysis flagged a loaded morning calendar. Unemployment Claims at 8:30 AM ET weren't expected to matter much, but Fed Governor Waller and the ISM Manufacturing PMI both hitting at 10:00 AM ET looked like the likely spark for first-hour volatility. The single biggest job for buyers was holding $762, and the analysis favored buying dips right there. A clean break would put $760 in play quickly, and that zone was called the heaviest support on the board, with $758 at the bottom of the range and $755 as the next cushion. A failure at $755 would leave little in the way of a slide toward $750. On the upside, $766 was the level that mattered most. It had flipped from support to resistance, and reclaiming it would be the first real sign of repair and would open the door toward $769, with $772 and $775 sitting overhead as supply beyond the $770 ceiling.
The session played out as a textbook shakeout. SPY opened at $764.36, comfortably above the $762 floor, but bulls never managed to reclaim $766. The high stalled at $765.65, so $769 and everything above it stayed out of reach. Sellers then took their shot, just as the bearish bias suggested. They broke through $762 and the heavy $760 support zone and pushed SPY to a low of $758.79, just shy of the $758 bottom of the projected range. That was the line that held. $755 and the $750 slide never came into play, and dip-buyers stepped in hard off the range floor. They drove price all the way back above $762 to close at $764.04, up 0.18%. Volume of 42.37M came in near average, and the VIX dipped 0.18% to 16.31. The bears got their flush, but buyers defended the bottom of the model's range and won the close, leaving $766 as the unfinished business overhead.
Validation of the Analysis
Today's session showed how the premarket framework can map out a full round trip, from the warning shot on the downside to the rebound that dip-buyers were told to expect. The analysis set $766 as "the level that matters most," the former support that "flipped from support to resistance this week," and named $762 as "the single biggest job for buyers." SPY opened at $764.36, squarely between those two lines, and the early push stalled at a session high of $765.65. That high fell just shy of $766, so the "first real sign of repair" never arrived and the run toward $769 stayed off the table. That was exactly the setup the falling market scenario described, where a bounce that stalls near the $766-$767 resistance band and rolls over becomes "a clean short trigger." The upside ceiling held firm, and nothing approached the model's $770 cap.
From there, the Put-heavy band took control just as the model projected. Sellers broke $762, and the framework's warning that a clean break "puts $760 in play quickly" played out on cue as price sliced through that zone. The analysis listed "the $758 bottom of the projected range" as the next cushion, and SPY carved out a session low of $758.79, less than a dollar above the model's floor. That was a remarkably precise call, since the projected range bottom marked almost exactly where sellers ran out of steam. The $755 level and the slide toward $750 never came into play. Then the broader message took over. The analysis stressed that "this is still a dip-buying market," and buyers stepped in off the lows to drive SPY all the way back above $762 to close at $764.04, up 0.18%. The "trending price action with intermittent chop" forecast nailed the character of the day: a clear trend lower, a sharp reversal, and a finish back inside the zone where it started. The trading opportunities were clean and clearly defined. Shorts taken on the stall beneath $766 had a full ride through the $762 and $760 targets, and the reduced-size breakdown short aimed at $758 came within striking distance. Covering in layers into support, just as the playbook advised, locked in gains before the snap-back. Dip-buyers who waited for the flush toward the bottom of the projected range had a textbook entry that delivered a multi-dollar rebound into the close. Every major call held. The $766 resistance capped the rally, the $758 to $770 projected range contained the entire session, the bottom of that range marked the turning point, and the dip-buying thesis was rewarded once again.
Looking Ahead
Friday brings the biggest economic release of the month as the monthly jobs report hits at 8:30 AM ET. Three key numbers drop at once: Non-Farm Employment Change, the Unemployment Rate, and Average Hourly Earnings m/m. Non-farm payrolls show how many jobs the economy added, making it one of the most closely watched gauges of overall economic health. The unemployment rate reveals whether slack is building in the labor market. Average hourly earnings tell the Fed whether wage pressures are cooling or keeping inflation sticky. A softer report with modest wage growth would strengthen the case for easier policy and could fuel a rally in growth and rate-sensitive names. A hot headline number paired with strong wage gains could revive inflation worries and put pressure on stocks. A sharp miss could also stir up recession fears and spark a different kind of selloff.
With all three numbers landing before the opening bell, expect the premarket to set the tone and the first hour of trading to be volatile as traders digest the details. Don't try to guess the print. Wait for the initial knee-jerk move to settle, then see whether price holds or reverses once the cash session gets going. Jobs-day moves often fake out in one direction before the real trend shows up, so keep position sizes tight and respect your key technical levels. Heading into a weekend with no high-impact data on deck early next week, Friday's reaction to the labor data will likely set the market's tone for days to come. Let the market show its hand before committing.
Market Sentiment and Key Levels
The bulls clawed back a slight edge, though nobody should mistake this for a breakout. SPY started the session flat, then sellers pushed it down early and tested the lower part of the recent range before buyers stepped in and steadily lifted it back up. Closing near the top of the day's range after an early dip is a better look for bulls than yesterday's late fade because it shows dip buyers are still willing to defend support. The VIX dropped 0.18% to 16.31, which tells us fear is basically frozen in place as traders wait for Friday's jobs data. Volume came in near average, so this wasn't a big conviction move in either direction. Small caps led the way while the Nasdaq and Dow barely moved, and that's a mildly encouraging sign. When the Russell 2000 outperforms, it suggests buyers are willing to take on more risk outside the big tech names, even though mega caps mostly struggled. Still, SPY remains stuck in the tight $762 to $765 box that has defined recent trading, and neither side has been able to break free.
First resistance sits at $765, the top of that box and the level where today's recovery ran out of room. If buyers can push through it with conviction, the door opens for a run toward $770, with $772 and $775 above it for a stronger rally. On the downside, first support is $762, and losing it would likely send SPY toward $760, then $758. The deeper line in the sand is $755, and if that gives way there is little to stop a slide toward $750. For longer-term bulls, the broader uptrend remains intact well above structural support at $640, so this is still a dip-buying environment as long as key levels hold. The big catalyst arrives Friday at 8:30 AM ET, when Average Hourly Earnings, Non-Farm Employment Change, and the Unemployment Rate all hit at once. A hot wage number could revive inflation fears, while a weak payroll print could spark growth worries, so the first hour could get wild either way. This is the report most likely to finally knock SPY out of its tight range. Elevated yields and rising energy prices remain in the background, keeping pressure on the Fed and limiting how much good news the market can price in. With SPY closing near the top of its box, we favor shorting rallies near $765 until buyers prove they can hold above it. Stay nimble, keep position sizes manageable, and let the jobs data show its hand before making a big bet.
Expected Price Action
Friday's session brings actionable intelligence generated by our AI model, which projects SPY's maximum range at $757 to $771. With the Put side dominating in an expanding band, the model is calling for trending price action with intermittent chop. Friday's calendar is about as loaded as it gets. Average Hourly Earnings, Non-Farm Employment Change, and the Unemployment Rate all hit at once at 8:30 AM ET, and with NFP on deck, expect significant volatility, especially in the first hour. Thursday's tape broke the week's pattern. Sellers took an early swipe, but buyers stepped in and ground price back up instead of letting it fade. SPY settled a hair above the midpoint of the projected range and near the top of its daily range, which gives us a modestly bullish bias heading into Friday. That lean is tempered by the Put-heavy band and stiff overhead supply. VIX dropped 0.18% to 16.31. Fear is holding steady as traders sit on their hands and wait for the jobs numbers. The tight box that has boxed in price all week is still intact, and the jobs report is the catalyst most likely to finally knock SPY out of it.
The first test for Friday is $765, the ceiling that has capped every push this week. We favor shorting rallies right there, since price is pressing into resistance with the Put side in control. If buyers can punch through $765 on a strong jobs reaction, the door opens for a run toward $770, with the model's $771 ceiling just above. Beyond that, $772 and $775 sit outside the projected range as overhead resistance where any rally should run into heavy supply. On the downside, $762 is the line buyers need to defend. A clean break there puts $760 in play quickly, and below that the $758 level and the $757 bottom of the projected range are the next cushions. If the lowest support at $755 gives way, there's little standing in the way of a slide toward $750. The bigger picture remains healthy, with SPY trading well above structural support near $640, so this is still a dip-buying market on a broader timeframe. In the short run, the playbook is simple. A breakout above $765 hands momentum to the bulls, a failure at $765 keeps the short-the-rip trade alive, and losing $762 means the trip toward $760 and possibly $757 could come in a hurry once the 8:30 AM numbers hit.
Trading Strategy
The VIX dropped 0.18% to 16.31, a barely noticeable dip that tells us traders aren't lowering their guard much ahead of Friday's jobs data. That stubbornness matters. With Average Hourly Earnings, Non-Farm Employment Change, and the Unemployment Rate all hitting at 8:30 AM ET, the market faces its biggest macro test of the week before the opening bell even rings. At 16.31, the fear gauge is still hovering below the 17 line in the sand. A jump through 17 on a disappointing report is the signal to cut net long exposure and tighten stops to the 0.5-0.75% range from entry. Until the VIX drifts back toward 15, position sizing should stay at 40-50% of normal. The first hour after the jobs release could easily whipsaw both sides, so the smart play is to let the opening reaction settle before committing full size.
In a rising market scenario, $762 is the level to defend, since it has served as the floor of the tight box that has held price for several sessions. A morning dip that holds $762 and then drives cleanly through $765 is the preferred long trigger, because clearing that ceiling would show buyers finally breaking the stalemate. The first profit target is $770, with a secondary target of $771 at the top of the projected range if momentum builds and the VIX slips back under 16. Runners can aim for $772, but treat anything beyond that as a bonus. Stops on longs belong below $760, since losing that level would mean the floor is cracking and the Put-heavy band is taking control. Don't chase a post-jobs spike straight into $770 without a clean retest of $765. Data-driven rallies can reverse just as fast as they start, and a patient pullback entry offers far better risk-reward than paying up into resistance.
In a falling market scenario, $765 is the resistance to fade, and with SPY finishing near the top of its range, this is our preferred setup. A bounce that stalls at $765 and rolls over is a clean short trigger, especially if the VIX holds above 16 while price struggles to make headway. The initial profit target is $762, with $760 in play if sellers press through first support. Stops on shorts belong above $771 to guard against a squeeze through the top of the projected range. If the market breaks $762 without a real bounce attempt, that breakdown is shortable at reduced size, targeting $758 and then $757 at the bottom of the projected range. Should $755 give way, $750 comes into view, but that is a runner target only, not the base case. With the Put side dominating an expanding band, bear-side size can match the bull side for now. Still, cover in layers into support and don't overstay. The long-term bull trend is intact above $640, and dip-buyers have repeatedly stepped in on these grinding pullbacks. One upbeat jobs number could snap this tape higher in a hurry.
Model’s Projected Range
SPY's projected maximum range for Friday is $757 to $771, with the Put side dominating in an expanding band that suggests trending price action with intermittent chop. Friday, October 2 brings a heavy dose of jobs data at 8:30 AM ET with Average Hourly Earnings m/m, Non-Farm Employment Change, and the Unemployment Rate all hitting at once, and with NFP on deck these releases are likely to produce significant volatility particularly in the first hour of trading. SPY closed at $764.04, up 0.18%, after opening at $764.36, dipping to a low of $758.79, and then grinding back to tag a high of $765.65 on lighter than average volume. SPY remains in the $762 to $765 range that has defined recent trading, and the jobs report is the macro catalyst most likely to finally knock price out of this tight box. If buyers can push through $765, the door opens for a run toward $770, but if sellers break $762, price likely slides toward $760, and if the lowest support at $755 gives way there is little to keep price from falling toward $750. The long-term bull trend remains intact above $640 with SPY well above structural support. As long as price holds above key structural levels, this remains a broader dip-buying environment. Absent a catalyst, resistance sits at $765, $770, $772, $775, while support rests at $762, $760, $758, $755. With SPY closing near the top of its range, we favor shorting rallies near $765. Bitcoin showed strength, climbing 1.51% to close above $84,812, while the MAG stocks had a mostly red day led lower by Alphabet down 1.70%, with NVIDIA the standout exception, up 1.09%. The VIX closed at 16.31, down 0.18%, suggesting fear is holding steady as traders sit tight ahead of the jobs numbers. SPY continues to trade well above the lower line of its uptrend channel, with structural support near $640.
Market State Indicator (MSI) Forecast
Current Market State Overview:
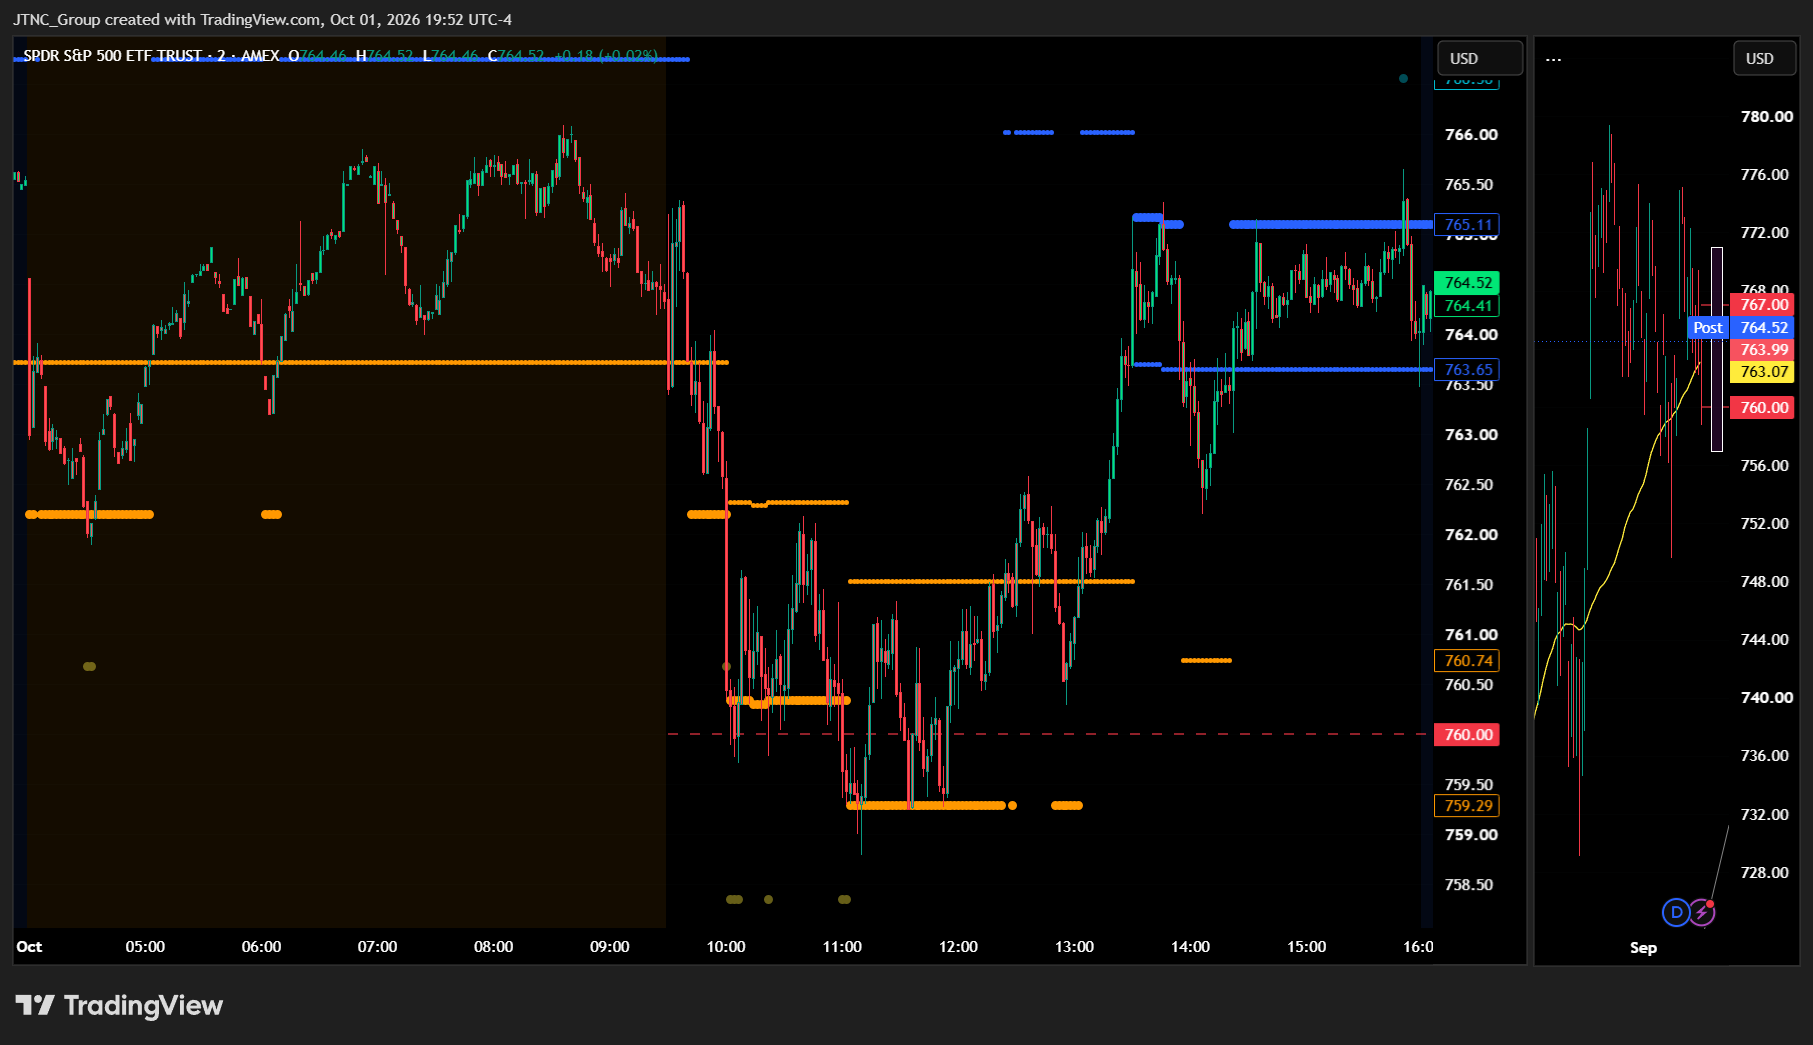
The MSI ended in a Bullish Trending Market State with SPY closing at $764.04. Since SPY closed inside the MSI range, support remains at $763.65 and resistance remains at $765.11 heading into Friday. Extended targets were printing above at the close. Earlier, extended targets printed below in premarket, signaling bearish extension before the bell, and continued printing below through the AM session as SPY sold off. They flipped above in the PM session as price rallied and carried into the close.
The MSI did not rescale overnight. Instead, it hovered between Wednesday's closing Bearish Trending state and a Ranging state. At the open, the MSI sat in a Ranging state that quickly failed and rescaled lower to Bearish Trending. With price coming into the MSI from above, that was a high-probability short. The MSI then rescaled several times lower with extended targets below, and SPY briefly broke major support at $760. Once extended targets stopped printing, SPY reversed and climbed back toward the open as the MSI rescaled to a wide Ranging state. In the last two hours, the MSI rescaled to a Bullish Trending state, and with price coming from below, a long was the high-probability play.
The MSI now sits in a narrow $1.46 range, which points to tight consolidation rather than a strong trend. For Friday, the MSI is forecasting sideways to possibly higher action. That said, the bulls are likely to keep pressure on the upside. Any failure of MSI support is likely to see SPY retest the day's lows. Major resistance at $770 is unlikely to give way without an external catalyst. MSI support is $763.65 with resistance at $765.11.
Key Levels and Market Movements:
Wednesday we stated, "Bulls want to see overnight price hold $762.20 MSI support and the $762.18 session low, then reclaim $763.72 MSI resistance and the $764 level that broke late Wednesday," and added, "Bears want to see $762.20 fail with the MSI staying Bearish Trending and extended targets printing below, which would put $760 in play," while also noting, "On data-heavy mornings, watch for the MSI to rescale and trade with whatever trend develops." Both camps got their turn. SPY opened at $764.36, above the $764 level bulls wanted reclaimed, but extended targets below in premarket warned that sellers weren't finished.
The first trade came right at the open. The MSI's Ranging state quickly failed and rescaled lower to Bearish Trending. With price coming into the MSI from above, shorting that failure was the high-probability setup, targeting MSI support and $762.20.
The second and third trades came as the AM session sold off. The MSI rescaled lower again, and then again, with extended targets printing below each time. That was the signal to stay short and press each new level lower rather than look for a bottom. Just as we outlined, $760 came into play, and SPY briefly broke that major support on its way to a session low of $758.79.
The fourth trade was the failed breakdown. Extended targets stopped printing below $760, the selling dried up, and SPY reclaimed $760. Buying that reclaim targeted $762.20 and $764. Price worked its way back toward the open as the MSI rescaled to a wide Ranging state, where patience was the right call.
The fifth trade came in the last two hours. The MSI rescaled to a Bullish Trending state, and with price coming from below and extended targets printing above, buying MSI support at $763.65 and targeting $765.11 MSI resistance was the play. SPY touched a session high of $765.65 on the day and settled at $764.04.
SPY gained 0.18% on volume of 42.37 million shares, near average and lighter than Wednesday. The VIX dropped 0.18% to 16.31, a sign that the morning's break below $760 never turned into real fear. At minimum it was a five-for-five session for traders following the framework. It was a volatile but readable day with substantial setups, all identified through proper context, patience, and flexibility while leveraging the MSI, premarket levels, and market structure rather than forcing trades. The MSI continues to prove its reliability as the cornerstone of our trading process.
Trading Strategy Based on MSI:
Friday has heavy economic data with Average Hourly Earnings m/m, Non-Farm Employment Change, and the Unemployment Rate all at 8:30 AM ET, which can introduce significant volatility, so traders should be ready to trade what they see rather than predict. With a narrow Bullish Trending state and extended targets printing above at the close, the MSI is forecasting sideways to possibly higher action on Friday. The bulls should keep pressure on the upside, but the narrow width signals consolidation and less conviction, so the MSI could rescale in either direction once the jobs data hits.
Bulls want to see overnight price hold $763.65 MSI support, then push through $765.11 MSI resistance and Thursday's $765.65 high. A move through $766 would find little resistance until $770, which is major resistance and unlikely to break without a catalyst. A strong jobs report could be that catalyst, but expect $770 to hold on the first few attempts. Bears want to see $763.65 fail with the MSI rescaling lower and extended targets printing below, which would press price toward $760 and a retest of Thursday's $758.79 low.
The primary setup for Friday is a failed breakdown at $763.65 MSI support, buying the reclaim and targeting $765.11 resistance. If price pushes through $765.11 with extended targets above, stay long and take profits toward $766 rather than fading the move. If price instead stalls at $765.11 and the MSI rescales lower with extended targets below, sell that failure targeting $763.65, then $760 and the day's lows. With the jobs data hitting before the open, let the first rescale after the release confirm direction before committing size.
The long-term bull trend remains intact above $640 and failed breakouts and failed breakdowns continue to offer the highest-probability setups. Remain flexible, avoid trading during Ranging Market States unless a clear failed breakout or breakdown presents itself, and ensure all trades are fully aligned with MSI signals. Providing real-time insights into market control, momentum shifts, and actionable levels, the MSI when integrated with our Pre-Market and Post-Market Reports continues to sharpen execution precision and elevate trade quality. If you haven't yet integrated MSI and our model levels into your process, now is the time. Contact your representative to get started as these tools are designed to support consistency and enhance performance.
Dealer Positioning Analysis
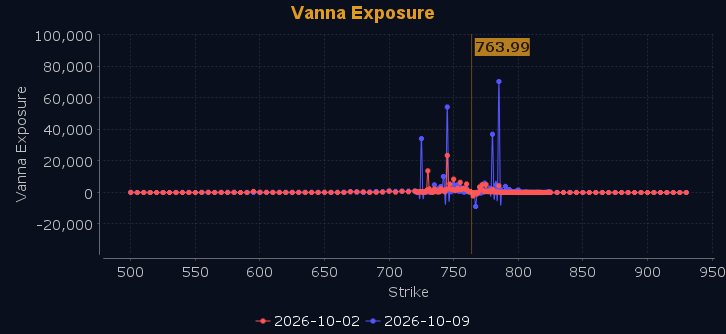
Dealers are selling SPY $769 to $800 and higher strike Calls while buying $764 to $768 Calls, indicating the Dealers' desire to participate in any relief rally on Friday. The ceiling for Friday appears to be $775. To the downside, Dealers are buying $763 to $700 and lower strike Puts in a 3:1 ratio to the Calls they're selling, displaying moderate concern that prices could move lower. Dealers' hedges remain unchanged, which tells us they believe the market is balanced right around the current $765 level. That level has acted like a magnet, since every time SPY drifts too far from it, price comes right back. The market looks like it's waiting on a catalyst to pick a direction, and there are several on deck, including Friday's jobs report and the elections in a few weeks. Below $765 is bearish and above $767 is bullish, with everything in between acting as high-noise chop. Should SPY fail to break above $767, expect the rally to be sold with a likely test of $765 or lower. Should $760 fail, Dealers will press shorts and push SPY back to last week's lows. A push above $767 will find little resistance until $770, which is likely to hold on the first few attempts to break higher. Dealer positioning is unchanged at neutral/slightly bullish.
Looking Ahead to Next Friday:
Dealers are selling SPY $768 to $805 and higher strike Calls while buying $764 to $767 Calls, indicating the Dealers' desire to participate in any rally next week, though they're only buying very small quantities. The ceiling for the week appears to be $785. To the downside, Dealers are buying $763 to $700 and lower strike Puts in a 3:1 ratio to the Calls they're selling, displaying moderate concern that prices could move lower. Dealers have reduced their hedges, which suggests they're less worried about lower prices next week. Closing out the most volatile month on a whimper may be giving Dealers some confidence heading into earnings season. We still see SPY likely ranging between $760 and $770 until an outside catalyst sparks a bigger move. $760 is major support while $770 is major resistance, with everything in between being nothing but chop and traps. Dealers remain net gamma negative until $767 is overtaken, which implies trending behavior that will reduce the effectiveness of both support and resistance. At $767, Dealers turn gamma positive, which implies rallies will be sold. Below $765, expect price to accelerate lower, while above $767 price could drift to $770. For the week Dealer positioning is unchanged at neutral/slightly bearish. We advise reviewing Dealer positioning daily for directional clues. These positions evolve quickly and tracking them is essential for staying ahead of shifting market sentiment.
Recommendation for Traders
Favor shorting rallies near $765, targeting $762 and $760, with stops above $770. Let the jobs-driven volatility settle before committing size.
Keep positions light and stops tight. Review the premarket analysis posted before 9 AM ET for any changes in the model's outlook and Dealer Positioning.
Good luck and good trading!
