
Market Insights: Monday, October 19th, 2026
Market Overview
Stocks were mixed on Monday as beaten-up tech stocks got scooped up and investors dipped their toes back into the AI trade ahead of a big earnings week. The Nasdaq gained 1.1% and the S&P 500 added 0.4%, while the Dow hovered right around the flatline. That's a welcome bounce after the Nasdaq's worst week since June and the S&P 500's nearly 2% drop last week. Semiconductors led the charge, with Nvidia, AMD, and Intel all climbing. Consumer Discretionary names also pitched in, as Amazon popped after Morgan Stanley named it a top pick and Tesla wasn't far behind. That left Discretionary and Technology as the only two S&P 500 sectors in the green. Under the surface, though, the rally was thin. Roughly 70% of S&P 500 stocks were lower at one point, and while the index was up roughly 0.6% midday, its equal-weight counterpart was down 0.3%. CoreWeave, the Nvidia-backed name that sank 25% last week on AI financing worries, couldn't hold onto a Goldman Sachs upgrade to Buy. It slipped into the red and threatened a fresh 52-week low. Oil whipsawed as Ukraine struck oil facilities in Russia and tankers came under attack near Saudi Arabia. Brent crude sat steady at $109 a barrel, while WTI dipped to $98 before reversing to roughly $103. Borrowing costs climbed again too, which is unwelcome company for an AI trade already facing questions about how it will finance its buildout.
Banks are telling a gloomier story. US bank stocks are on their longest losing streak since the summer of 2008, even though the biggest lenders have mostly reported another sturdy quarter. JPMorgan Chase, Bank of America, Citigroup, and Wells Fargo collectively set aside $7.6 billion in credit provisions, down about 3% from a year earlier. Investors aren't buying it yet. The KBW Nasdaq Bank Index fell slightly Monday and has now sold off for six consecutive weeks, losing 11% since early September, as credit managers worldwide grow increasingly worried about what comes next. Looking ahead, earnings season kicks into gear. GM reports third-quarter results before the bell Tuesday, and Wall Street expects revenue of $48.52 billion, slightly above last quarter's $48.03 billion, along with adjusted earnings per share of $3.57 and adjusted EBIT of $4.02 billion. Investors are hoping the Big Three automaker keeps growing profit and maybe raises guidance, helped by government offsets that are trimming its tariff bill and a year spent reworking its supply chain, shifting production, and negotiating with suppliers. Netflix reports after the close Tuesday. Then Tesla, fresh off its jaw-dropping Roadster redesign, and Meta both post results after the closing bell Wednesday.
SPY Performance
SPY opened at $767.23, gapping up above yesterday's close of $763.23 and starting the session right back above the $764.44 level that had flipped to resistance. That was an encouraging first move for the bulls, and it got better early on. Buyers pushed SPY to a session high of $770.46, clearing the $766.71 level we flagged as the next hurdle overhead. That push ran out of steam well short of the $772.87 to $773.24 ceiling, though. Sellers stepped in, faded the rally, and drove SPY down to a session low of $765.82. The good news is that the low held above $764.44 the entire day. SPY finished at $766.60, just under the $766.71 line and below where it opened.
SPY gained 0.44%, but the details make this bounce harder to trust. Volume came in at just 33.46 million shares, below average and a sharp drop from yesterday's committed selling. That's the same pattern we warned about earlier this week. The market drops on heavier volume, then bounces on thin participation. When buyers only show up when sellers take a break, it usually means the rebound is more of a pause than a reversal. The shape of the session adds to that concern. SPY closed below its open, which means the gap did most of the work and the intraday action actually leaned bearish. Buyers had their chance to build on the early strength and couldn't hold it. Still, there's a real positive here. SPY reclaimed $764.44 and never looked back at yesterday's low of $760.64, so the bears didn't get the follow-through they wanted. The VIX dropped 7.80% to close at 18.43, slipping back below the 20 mark after just one session above it. That shows some of yesterday's fear has cooled off, and traders aren't rushing to pay up for more protection. But one day doesn't erase the jump in volatility we just saw, and the VIX is still elevated compared to where it sat before this pullback started. The bigger picture is now a tug of war. On the upside, $766.71 remains the first level to beat on a closing basis, since SPY finished just under it. Above that, today's high of $770.46 is the next test, followed by the $772.87 to $773.24 ceiling that capped the last two sessions. Clearing that zone on strong volume would be the first real sign that the bulls are taking control again, with $775.95 to $776.30 still sitting further out. On the downside, $764.44 is back to being the key support level. Holding above it keeps today's recovery alive. A close below it would undo the bounce and put yesterday's low of $760.64 right back in play, and losing that would open the door to a deeper leg lower. Today the bulls stopped the bleeding, but they did it on light volume and gave back part of their gains along the way. Until buyers show up with real size, the bears still have the edge.
Major Indices Performance
The Nasdaq led the way, climbing 1.11% as tech roared back from the prior session's beating. Buyers who had been dumping high-multiple growth names turned around and scooped them up, and mega-cap tech did the heavy lifting to push the index to the front of the pack. That's a sharp reversal from the selling that made the Nasdaq the market's worst performer just one day earlier, and it shows dip buyers still have plenty of appetite for tech when prices come in. One strong day doesn't erase the rotation story, though. Tech will need to string together a few more sessions like this before anyone can call the pullback finished.
The Russell 2000 bounced back with a 0.35% gain, recovering a small slice of the heavy losses from the prior session. Small-caps joined the rally but didn't exactly lead the charge, and that lukewarm showing tells you confidence in the riskiest corner of the market is still fragile. Rate pressure hasn't gone anywhere, and rate-sensitive small-caps keep feeling the squeeze even on green days. A modest gain beats another leg lower, but small-caps need more than a polite bounce to prove the breakdown is behind them. For now, buyers are testing the waters rather than diving in.
The Dow brought up the rear, slipping just 0.07% as money flowed out of defensive blue chips and back into growth. After serving as the market's safe harbor during the selloff, the old-economy names took a back seat once risk appetite returned and investors felt brave enough to chase tech again. That's the flip side of the rotation trade. When fear fades, the Dow's defensive appeal fades with it. The S&P 500 landed in between with a modest gain, lifted by its heavy tech exposure. The VIX dropped 7.80% to close at 18.43, sliding back below 20 and showing that fear cooled off quickly as buyers regained control.
Notable Stock Movements
Amazon stole the show in the Magnificent Seven, ripping 4.98% higher to lead the group. That's a big move for a mega-cap. It came right after Amazon couldn't hold its gains in the prior session, so buyers clearly stepped back in with conviction. When a name this size jumps nearly 5% in a single day, it usually means larger funds are putting money to work, not just traders chasing a quick bounce. If Amazon can build on this, it could become the leader that pulls the rest of big tech out of its recent slump.
The group as a whole flipped the script with a mostly green session, a sharp turnaround from the broad tech dump traders sat through last time. Apple and Meta were the only names to finish in the red, with Meta posting the worst showing at a 0.55% loss. That's notable because Apple had been the group's safe spot during the selling. Seeing it lag on a strong day suggests investors felt confident enough to move out of the defensive play and back into the more aggressive growth names. Meta still can't find its footing, but this loss was mild compared to the beating it took last session, which hints that the selling pressure may finally be easing. Five winners out of seven is a solid rebound and shows buyers returning to big tech across the board.
The broader market backs up that improving tone. The Nasdaq bounced 1.11% to lead the way, and the Russell 2000 added 0.35%, while the Dow slipped 0.07%. That tells you money rotated back into growth after hiding in old-economy names. The VIX dropped 7.80% to 18.43, pushing fear back below the key 20 level and signaling that traders are easing off their demand for protection. Tuesday brings no economic news, so big tech will trade on technicals and positioning. If Amazon keeps its momentum and Meta stabilizes, the Nasdaq could keep recovering and lift the broader market with it. But if this bounce fades and the sellers return, the tech-heavy index could slip right back into the pressure it just escaped.
Commodity and Cryptocurrency Updates
Crude oil finally took a breather, falling 3.01% to close at $98.36. After a relentless run of higher highs, buyers stepped back and let some air out of the rally, though oil is still sitting just shy of the $100 mark. Crude has rallied well above $70 and far beyond longer-term model expectations, and the geopolitical tensions and supply disruptions fueling the move haven't gone away. A one-day pullback after a run like this is healthy, not a trend change. With no economic data on Tuesday's calendar, oil will keep trading on headlines. The bigger concern hasn't changed: if crude stays parked near these levels, persistent energy costs will keep feeding inflationary pressure and could seriously complicate the Fed's path on rate policy.
Gold gave back some ground, slipping 0.48% to close at $4,161. That essentially erased the prior session's gain, and it came on a day when risk appetite returned and money rotated back into growth names. When fear fades, safe-haven demand tends to cool off, so a modest dip like this makes sense. Still, the metal didn't crack, and the decline was orderly rather than panicked. The long-term drivers remain firmly in place: inflation uncertainty, steady central bank buying, and a constant flow of geopolitical headlines all continue to support the bid. As long as gold holds near these levels, the bulls keep control and another run at the highs stays on the table.
Bitcoin edged lower again, falling 0.20% but closing above $81,853. The dip was tiny, but it stood out on a day when tech stocks rallied hard and risk appetite clearly improved. Crypto simply didn't join the party, and that lack of participation is telling. The choppy, sideways pattern Bitcoin has been stuck in continues to frustrate both bulls and bears, with neither side able to take real control. Buyers need to show up with conviction and string together consecutive gains to prove momentum is turning. Until that happens, the broader trend stays under pressure, and a break below recent lows would open the door to more downside.
Treasury Yield Information
The 10-year Treasury yield climbed 0.75% today to close at 5.140, its second straight gain and a much bigger move than yesterday's modest uptick. What looked like a stall at a key level is starting to look like a reversal. Bond buyers who had been pushing yields toward the 5% line have backed away, and the 10-year is now drifting in the wrong direction for stocks. The rate relief that helped equities last week is fading, and the momentum has shifted back toward higher yields.
Measured against each threshold, the picture got noticeably worse. The 4.5% level where equity valuations start to feel the squeeze is now 64 basis points below today's close. The 4.8% mark that usually triggers broader selling sits 34 basis points back. The 5% line for serious risk is cleared by 14 basis points, pushing the 10-year deeper into the framework's danger zone. Most concerning, the cushion under 5.2% shrank to just 6 basis points, so the level where the framework calls for a 20% or greater correction is now within striking distance of a single bad session.
Stocks shrugged off the rate move, at least for now. The Nasdaq bounced 1.11% and the Russell 2000 added 0.35%, while the Dow slipped 0.07%. That's an interesting split, because rising yields usually hit growth names and debt-heavy small caps hardest, yet they led today's rebound. This looks more like a relief bounce after yesterday's selloff than a vote of confidence in the rate backdrop. The VIX dropped 7.80% to 18.43, easing a good chunk of yesterday's fear spike, but calm volatility with yields climbing toward 5.2% is a combination that can change fast.
Tuesday brings no economic news, so the 10-year will trade on positioning and global bond flows. The key question is whether yields test 5.2%. Today's sharp pullback in energy prices could take some pressure off inflation worries and give bonds a reason to rally, which would be welcome news for stocks. But if the 10-year keeps grinding higher and closes above 5.2%, the framework's correction warning comes into play, and today's equity bounce would be hard to sustain. Until the 10-year turns lower and gets back under 5%, rates remain the biggest headwind hanging over this market.
Previous Day’s Forecast Analysis
Heading into Monday, our AI model projected a maximum SPY range of $754 to $771, with the Put side dominating in an expanding band. That setup called for trending price action broken up by intermittent chop. With an empty economic calendar, the forecast expected the tape to trade purely on technicals. SPY had settled just above the midpoint of the projected range after Friday's one-way selloff, which gave a modestly bullish bias by position. However, the Put-heavy band meant the edge still belonged to sellers until buyers proved otherwise. The VIX had jumped 22.84% to 20.22, signaling elevated fear. With price still working inside the $760 to $765 zone that had defined recent trading, the model flagged a decisive breakout as likely.
The key battle lines were drawn at $765 overhead and $760 as the downside pivot. Above $765, resistance was mapped at $767, $770, and $775 as the final ceiling where any squeeze should meet heavy supply. Below $760, support sat at $757 and $750, then $747 as the last line of defense for bulls, with $745 in play if that level cracked. The bigger picture was viewed as healthy, with SPY well above structural support near $640 and the long-term bull trend intact. Short-term momentum, though, had turned lower.
The recommended strategy favored the bear side. Traders were told to cut size to roughly half of normal, keep stops in the 0.5-0.75% range, and let the first 30 minutes establish direction. The primary setup was shorting a stall and rollover near $765, targeting $760, then $757, $754, $750, and $747, with $745 reserved as a stretch target. Stops were set above $767, or above $771 for aggressive traders. If $760 broke early, the plan was to short a failed retest from underneath rather than chase. Longs were the secondary play at half the bear-side size. The forecast looked for a flush into $757 or $754 that held, targeting $760, $765, and $767, with stops below $750. A clean retest of $767 as support would open $770 and $771, with $775 only on a strong breakout day. The burden of proof sat squarely on bulls to reclaim $765.
Market Performance vs. Forecast
Monday's session stayed inside the model's projected maximum range of $754 to $771 from start to finish. The forecast flagged a decisive break out of the $760 to $765 zone as likely, and that is what happened. Buyers resolved the zone to the upside. The forecast also described a modestly bullish bias by position after Friday's close just above the midpoint of the range, and that lean proved correct. SPY opened at $767.23, pushed to a high of $770.46, dipped to a low of $765.82 and closed at $766.60, up 0.44%. The model does not account for unpredictable external events, and the overnight shift in sentiment that lifted price at the open introduced a path that leaned away from the Put-heavy base case scenario. Even so, the level structure framed the entire session with precision.
The $765 level was the key call of the day. The forecast named it as the first test overhead and the line that would neutralize the bearish tilt if buyers could hold it. SPY opened above that level and never traded below it, with the session low holding less than a dollar above $765. That was exactly the scenario the playbook said would open a run at $767. Price cleared $767 at the open and climbed toward $770, the target the forecast placed just under the top of the projected range. The session high stopped short of $771, so the top of the range acted as a ceiling, just as the model projected. The $775 stretch target never came into play, and the downside pivot at $760 was never tested.
On the falling market side, the primary setup required a push into $765 that stalled and rolled over. Price opened above $765 rather than rallying into it from below, so that trigger never activated. Disciplined traders stood aside instead of forcing a short against a tape holding firm support. On the rising market side, the guidance said that if bulls cleared $767 with conviction, traders should look to buy a retest of $767 as support with targets at $770 and $771. The $770 target came within reach on the session high. The close slipped back just under $767, which validated the advice to take profits in layers into resistance instead of holding for a bigger breakout. The deeper long triggers at $757 and $754 were never needed. The forecast's call to keep bull-side size lighter kept exposure measured on a day when the trend lacked heavy conviction.
The VIX dropped 7.80% to 18.43. That eased some of Friday's spike but still left volatility above the threshold where reduced size makes sense. The guidance to trade around half of normal size with 0.5-0.75% stops fit a session of contained swings. Volume came in below average, which suggests the bounce was more relief than aggressive buying. The $765 hold, the $767 breakout and the $770 test gave traders clear reference points throughout the day. The framework adapts as conditions shift. With the long-term bull trend intact above structural support near $640, it remains a reliable guide for managing risk and spotting opportunity as the week unfolds.
Premarket Analysis Summary
The premarket analysis, posted before the opening bell, set up Monday with SPY at $766.69 in a call-dominated tape, bouncing after Friday's slide cut through $770 and $765 and closed near the lows, reversing Thursday's rebound. The bias hinged on $768, the defining level sitting right above spot and the spot where the tape would begin to repair. Reclaiming and holding it would mark Friday's drop as the flush, while failing there would leave sellers in control. The expected move ran from $757 to $772, about seven points, with far more room priced below than above, and the notes stressed that the first hour would decide whether the bounce could hold. Upside targets stepped through $770 as the heaviest resistance overhead and the level bulls really needed, then $771 as the next decision point, $772 at the top of the expected move as Friday's line in the sand turned resistance, and $774 as max upside. On the downside, $765 was Friday's floor and the first level to watch, followed by $762 as the next decision point, $760 as the point of last hope, and $757 as max downside.
The session played out as a textbook test-and-fail at resistance. SPY opened at $767.23, just under the $768 gate, and buyers pushed through it to deliver the exact test of $770 that the notes called for. Price tagged a high of $770.46, barely poking above that heavy round-number resistance, but it never reached $771, and sellers quickly leaned on the rally. The good news for bulls was that $765 held firm all day, with the low printing at $765.82, so the fast trip to $762 never got started. SPY closed at $766.60, up 0.44% on 33.46M shares of below-average volume, finishing almost exactly where it sat in premarket and back below $768. The VIX dropped 7.80% to 18.43, so fear cooled even though price couldn't hold its gains. The key takeaway is that both sides of the roadmap worked. $770 proved to be real resistance and $765 acted as a reliable floor, leaving SPY boxed inside the upper half of the expected move. With price closing back under $768, bulls haven't fully repaired the tape yet, and that gate along with $770 remain the levels to reclaim, while $765 is the floor that has to hold.
Validation of the Analysis
Monday delivered almost exactly the session the premarket map described, with SPY spending the entire day boxed between the two levels the notes flagged as most important. The analysis set up a clear fork: "Reclaim 768 and 770 is the test; lose 765 and expect a fast trip to 762, then a real fight at 760." SPY opened at $767.23, just under the $768 gate the notes called "the gate right above us and where the tape begins to repair." Buyers did reclaim that level, and the move went exactly where the notes said it would. Price pushed straight into $770, the level described as "a major round number and the heaviest resistance overhead," and topped out at $770.46. That high landed less than half a point above the line, and the bounce stalled there. Price never reached the $771 decision point, and the $772 expected move top, which the notes said had flipped from Friday's line in the sand into resistance, was never threatened.
The downside held just as cleanly. The notes named $765 as "Friday's floor" and warned that "losing it cleanly reopens the lows." Sellers never got that break. SPY's low came in at $765.82, holding above the level by less than a point, so the $762 decision point, the $760 "point of last hope," and the $757 max downside were never needed. The close at $766.60, up 0.44%, sat almost exactly on the $766.69 spot price published before the bell. That is a full round trip from $768 to $770 and back that never broke the session's outer rails. The VIX fell 7.80% to 18.43, which fits the notes' read that Friday's flush might be ending, even though bulls couldn't turn the bounce into a breakout. The analysis said $770 was "the level bulls really need," and the tape agreed by turning price away right there.
The trading value came from how tightly the levels framed the action. Traders watching $768 had a clear long trigger once price reclaimed it, with $770 sitting just overhead as a natural profit target. Anyone who took that trade had a defined spot to take gains instead of hoping for $772 or $774. The rejection at $770 then gave short-term sellers a high-quality fade, with the map pointing them back toward $765 as the downside target. Buyers who waited for a dip into Friday's floor got a near-perfect entry when price held just above $765, with a tight stop available right under the level. The framework was just as useful for what it kept traders out of. Because the notes made clear that $770 was the heaviest resistance on the board, nobody following the map had reason to chase the high. And because $765 held, there was no reason to press shorts toward $762 or $760. A day that opened inside the levels, tagged the top one, held the bottom one, and closed right back at the published spot price shows how well the map captured the session. Heading into Tuesday, the battle lines are clear: bulls still need a decisive move through $770, while bears need a clean break of $765 to restart Friday's slide.
Looking Ahead
Tuesday's economic calendar is completely clear, with no high-impact releases on the docket. There's no 8:30 AM ET report waiting to move futures and no mid-morning data point that could flip sentiment in a heartbeat. That leaves the market to run on its own engine, carrying forward whatever tone Monday's session set. Days like this can tell you a lot about the market's real mood. Without a headline to react to, the moves traders make reflect genuine conviction rather than knee-jerk responses to a surprise number. If buyers step in early and keep control through the afternoon, it suggests the underlying bid has real staying power. If the tape drifts lower or chops sideways without direction, it's a sign that enthusiasm may be thinner than recent price action implied.
Traders can treat Tuesday as a positioning session rather than a reaction session. It's a good window to review open trades, trim anything that no longer fits the thesis, and mark the key levels worth watching as the week unfolds. Just remember that a quiet calendar doesn't promise a quiet market. Corporate news, analyst calls, and rotation between sectors can all trigger sharp moves, and lighter participation can exaggerate those swings. Don't put too much weight on the opening hour, since early moves on a data-free day often fade by lunch. Stay patient, let price confirm direction before committing fresh capital, and use the breathing room to sharpen your game plan instead of chasing moves that lack follow-through.
Market Sentiment and Key Levels
Monday swung momentum back toward the bulls, but the conviction behind the move deserves a closer look before anyone gets too comfortable. Buyers lifted the market off Friday's lows and pressed higher through the session, yet they couldn't hold the best levels into the close, and SPY settled in the lower half of its range on lighter-than-normal participation. That tells us the rebound was more of a relief bounce than a full-throated return of risk appetite. Breadth was mixed. The Nasdaq led with a 1.11% gain and the Russell 2000 added 0.35%, while the Dow slipped 0.07%. When growth stocks outperform and blue chips lag, money is leaning back into risk, but the narrow margin in small caps suggests investors are still picking their spots. Big tech did the heavy lifting, and Bitcoin's 0.20% dip showed speculative appetite taking a breather rather than chasing the rally. Fear eased considerably. The VIX dropped 7.80% to 18.43, pulling the fear gauge back under the 20 mark and unwinding much of Friday's spike. Short-term control tilts toward the bulls, though the soft finish keeps this from being a decisive win.
SPY is sitting right on top of first support at $766, which makes that level the line in the sand for Tuesday. Holding it keeps the bounce alive, and a clean break above $770 opens the door to $773, with $775 and $777 in play if buyers find another gear. On the downside, losing $766 likely sends SPY toward $763, followed by $760 and $753. If $753 gives way, there is little to keep price from falling toward $750. The bigger picture remains bullish, with the long-term trend intact well above structural support at $640, so this is still a broader dip-buying environment as long as key levels hold. Tuesday's projected maximum range runs from $762 to $773, with the Put side dominating in an expanding band that points to trending price action mixed with intermittent chop. The economic calendar is empty, so technicals and positioning will drive the tape and the levels above will carry extra weight. Traders will be watching whether tech leadership can broaden out or whether Monday's late fade turns into renewed selling. Elevated yields and firm energy prices remain a background headwind, while gold's 0.48% slip hints that the rush for protection is cooling off. We favor buying dips at $763 rather than chasing strength into resistance. Keep stops disciplined below $760, watch how price reacts around $770, and let the bulls prove they can break through before getting aggressive.
Expected Price Action
Tuesday's session brings actionable intelligence generated by our AI model, which projects SPY's maximum range at $762 to $773. With the Put side dominating in an expanding band, the model is calling for trending price action with intermittent chop. There is no economic news due out on Tuesday, so the market will trade on technicals, and price action and positioning will be in the driver's seat. Monday delivered a modest bounce, but buyers couldn't hold their early push and SPY faded back toward the lower half of its session. That left SPY settling just below the midpoint of the projected range and sitting right on top of the model's first support, which gives us a modestly bearish bias by position heading into Tuesday. That lean lines up with the Put-heavy band, so sellers hold a slight edge until buyers prove they can reclaim higher ground. The VIX dropped 7.80% to 18.43, a meaningful cooling in fear that shows volatility sellers stepping back in. That calmer backdrop helps cushion dips, but it hasn't erased the downside pressure baked into the model's positioning. With an expanding band and no headlines to distract, a directional move out of the current zone looks likely.
The line in the sand for Tuesday is $766, the model's first support sitting just beneath where SPY finished. Lose it cleanly and SPY likely slides toward $763, which is exactly where we favor buying dips. Below that, $760 is the next shelf of support, and $753 stands as the lowest support and the point of last hope for bulls. If $753 gives way, there is little to keep price from falling toward $750. On the upside, $770 is the first real hurdle, and a clean break above it opens the door to $773 at the top of the projected range. Beyond that, $775 and $777 stand as the final overhead resistance, where any squeeze should run into heavy supply. The bigger picture remains healthy, with SPY trading well above structural support near $640 and the long-term bull trend intact, so this is still a dip-buying market on a broader timeframe. In the short run, the playbook is straightforward. With the calendar empty and the Put side in control, let the opening auction settle before committing. A firm hold above $766 keeps buyers in the game and sets up a run at $770, while rallies that stall below $770 are likely to get sold. A failure at $766 could mean a quick trip to $763, and that's where we expect dip buyers to show up. If $763 can't hold, the breakdown toward $760 could accelerate quickly. Whichever side wins the battle at $766 or $770 likely sets the trend for Tuesday's session.
Trading Strategy
The VIX dropped 7.80% to 18.43, slipping back below the 20 line as fear drained out of the market and volatility sellers took back control. That's a welcome shift, so size can creep back toward roughly three-quarters of normal, but don't go all in just yet with the Put side still dominating an expanding band. Keep stops in the 0.5-0.75% range from entry. Tuesday has no economic news on the calendar, so the tape will trade purely on technicals, and that usually means trending moves broken up by intermittent chop. Let the first 30 minutes show their hand before committing, and avoid getting stuck in the middle of the range where the chop does its damage.
In a rising market scenario, buying dips at $763 is our preferred setup. A pullback that tags $763 and holds is the cleanest long trigger, especially if the VIX keeps easing while price firms up. The first profit target is $766, with $770 next if buyers keep pressing. Runners can aim for $773 near the top of the projected range, and $775 comes into play after that. Treat $777 as a stretch target reserved for a strong trend day. Stops on longs belong below $760, and aggressive traders can give it room down to just under $753. If bulls punch through $770 with conviction, don't chase the breakout. Buy a clean retest of $770 as support instead, targeting $773 and $775. Take profits in layers into resistance rather than swinging for the fences.
In a falling market scenario, shorts are the secondary setup, but with puts in control they deserve respect. A push into $773 that stalls and rolls over is the primary short trigger, particularly if the VIX starts to bounce while price fails to break higher. The initial profit target is $770, with $766 and then $763 in play if sellers take over. Stops on shorts belong above $775, and aggressive traders can give it room above $777. If price loses $760, that opens the door to $753, so short a failed retest of $760 from underneath, targeting $753 and then $750. A break of $753 leaves little support until $750, so keep that as the final stretch target on a heavy trend-down day. Keep bear-side size at roughly half the bull side unless $760 cracks, at which point shorts can take the lead. The long-term bull trend remains intact above $640, so dip-buyers will likely step up on deeper pullbacks. For now, the bulls have the edge as long as $763 holds.
Model’s Projected Range
SPY's projected maximum range for Tuesday is $762 to $773, with the Put side dominating in an expanding band that suggests trending price action with intermittent chop. Tuesday brings no economic news due out so the market will trade on technicals. SPY closed at $766.60, up 0.44%, after opening at $767.23, pushing to a high of $770.46, and dipping to a low of $765.82 before settling in the lower half of the day's range. SPY is trading near our model's first support at $766, and with no major macro headline grabbing the spotlight, price action and positioning should be in the driver's seat. A clean break above $770 opens the door to $773, while a loss of $766 likely sends SPY toward $763, and if the lowest support at $753 gives way there is little to keep price from falling toward $750. The long-term bull trend remains intact above $640 with SPY well above structural support. As long as price holds above key structural levels, this remains a broader dip-buying environment. Absent a catalyst, resistance sits at $770, $773, $775, $777, while support rests at $766, $763, $760, $753. We favor buying dips at $763. The MAG stocks put together a mostly green day led by Amazon up 4.98%, with Meta the lone laggard down 0.55%, while Bitcoin slipped 0.20% to close above $81,853, so big tech carried the leadership load while crypto took a breather. The VIX closed at 18.43, down 7.80%, suggesting a significant reduction in fear as buyers stepped in and volatility sellers regained control. SPY continues to trade well above its structural support near $640, keeping the bigger-picture uptrend firmly intact.
Market State Indicator (MSI) Forecast
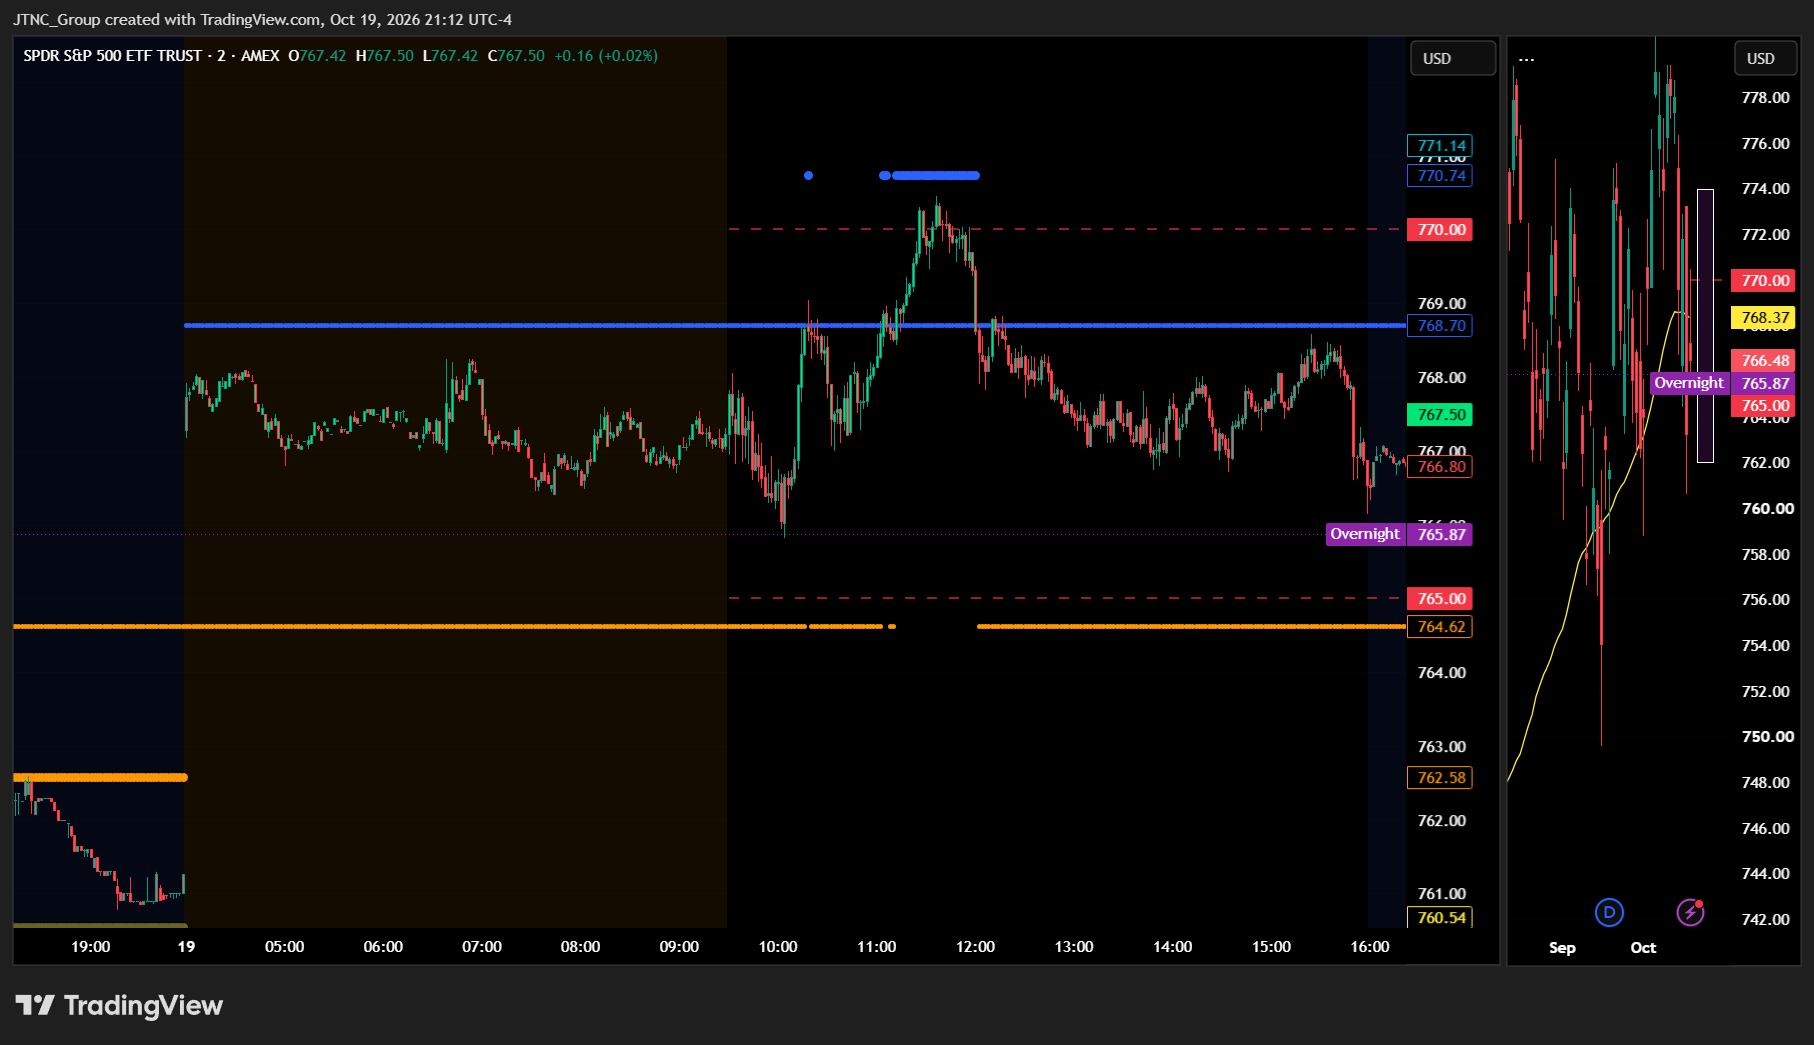
Current Market State Overview:
The MSI ended Monday in a Ranging Market State with SPY closing at $766.60. MSI resistance is $768.7 and MSI support is $764.62 heading into Tuesday. The MSI carried Friday's bearish close into the overnight session, where the Bearish Trending state that drove price sharply lower into the weekend was still in control. No extended targets were visible in the premarket. By the open the MSI had rescaled into a Ranging state, and price ground sideways through the early hours. Extended targets printed above during the AM session and pushed SPY up to $770, but the move stopped abruptly. SPY reversed, the MSI rescaled lower, and price slid from $770 back toward $766 through the PM session. By the close the MSI had settled into a wide $4.08 Ranging state with no extended targets printing. A wide range like this gives price plenty of room to move without forcing the MSI to commit to a direction.
For Tuesday that implies sideways to slightly higher action as a continuation of Monday's session. Without extended targets at the close, the move may be modest and is likely to find resistance at key levels above. The bulls showed they could push price higher, but they could not hold it. They will need extended targets above and a clean rescaling higher to regain control. MSI support is $764.62 with resistance at $768.7.
Key Levels and Market Movements:
Friday we stated, "Bulls want to see overnight price hold above $762.58 and stay near the $763.23 close," and added, "From there they need to reclaim $764.62 and push back through Thursday's $764.44 low and $765 major support, with the 50 DMA near $768.50 the real test," while also noting, "If the MSI rescales higher and extended targets print above, that would be the first sign that sellers are losing their grip." The bulls checked every box early. SPY held above $762.58 overnight, and the MSI rescaled out of its bearish state into a Ranging state at $768.7 and $764.62. SPY opened at $767.23, already back above Thursday's $764.44 low and $765 major support. Extended targets then printed above in the AM session, and price pushed through $768.7 and the 50 DMA to a session high of $770.46. That was the real test, and the bulls failed it. The extended targets stopped near $770, buyers disappeared, and SPY rolled over.
Three trades followed. The first was a long off the open as extended targets printed above, carrying price through $768.7 resistance to the $770 area. The second was the failed breakout. Once the extended targets stopped and price slipped back under $768.7, traders could short back into the range targeting the $766 area. The third came after the MSI rescaled lower in the PM session. A retest of $768.7 resistance from below that failed offered another short back toward $764.62 support. Price reached a session low of $765.82 before stabilizing, and SPY settled at $766.60. At minimum it was a 3-for-3 session for traders following the framework.
SPY gained 0.44% on volume of 33.46 million shares, well below average and a clear drop from Friday's selloff turnover. The light volume tells us Monday's bounce was more relief than real buying conviction. The VIX dropped 7.80% to 18.43 and slipped back under 20, which eased some of the fear that crept in Friday. It was an easy day to read albeit not an easy day to trade given the tight choppy range. But substantial setups were present, all identified through proper context, patience, and flexibility while leveraging the MSI, premarket levels, and market structure rather than forcing trades. The MSI continues to prove its reliability as the cornerstone of our trading process.
Trading Strategy Based on MSI:
Tuesday has light economic news so the market is likely to move more sideways to up than trend given the Ranging at close. The MSI closed in a wide $4.08 Ranging state with no extended targets printing. That points to sideways to slightly higher action on Tuesday as a continuation of Monday's session, though the move may be modest and is likely to find resistance at key levels above. $768.7 remains MSI resistance and $764.62 remains MSI support.
Bulls want to see overnight price hold above $764.62 and stay near the $766.60 close. From there they need to reclaim $768.7 and the 50 DMA near $768.50 with conviction, then push toward $770 and Monday's $770.46 high. If the MSI rescales higher and extended targets print above again, that would be the clean signal that buyers are back in charge and higher levels are in play. Bears want to see $764.62 fail with the MSI rescaling lower and extended targets printing below. That would press SPY back toward Friday's $763.23 close and $762.58, with Friday's $760.64 low and the $760.54 premarket level in play if the selling picks up. With the VIX back under 20 and SPY bouncing off Friday's lows, the bears have lost some of their edge, but the bulls still have to prove they can hold above $768.7.
Since Monday finished higher, the primary setup for Tuesday is buying a dip to $764.62 MSI support that holds, using a break of Monday's $765.82 low as the warning sign, and targeting $766.60 and then $768.7. A failed breakout above $768.7 that slips back under, just like Monday's reversal from $770, offers a short back toward $764.62. A failed breakdown below $764.62 that quickly reclaims the level offers a long back toward $768.7. If $768.7 breaks with the MSI rescaling higher and extended targets printing above, that level flips to support, and traders can buy dips into it while targeting $770.46 and the premarket levels above. If $764.62 breaks with the MSI rescaling lower and extended targets printing below, that level flips to resistance, and traders can sell rallies into it while targeting $762.58 and the premarket levels below.
The long-term bull trend remains intact above $640 and failed breakouts and failed breakdowns continue to offer the highest-probability setups. Remain flexible, avoid trading during Ranging Market States unless a clear failed breakout or breakdown presents itself, and ensure all trades are fully aligned with MSI signals. Providing real-time insights into market control, momentum shifts, and actionable levels, the MSI when integrated with our Pre-Market and Post-Market Reports continues to sharpen execution precision and elevate trade quality. If you haven't yet integrated MSI and our model levels into your process, now is the time. Contact your representative to get started as these tools are designed to support consistency and enhance performance.
Dealer Positioning Analysis
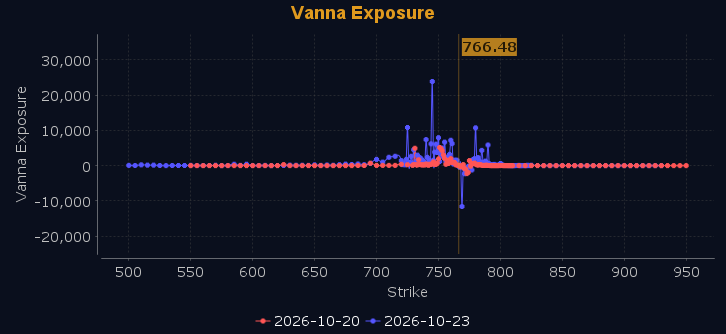
Dealers are selling SPY $775 to $795 and higher strike Calls while buying $764 to $774 Calls, indicating the Dealers' desire to participate in any rally on Tuesday. They are buying ATM Calls looking to participate in any continuation of Monday's price action, and their positioning and hedging remain unchanged. The ceiling for Tuesday appears to be $778. To the downside, Dealers are buying $763 to $705 and lower strike Puts in a 3:1 ratio to the Calls they're selling, displaying continued concern that prices could move lower. Below $765 is bearish and above $768 is bullish, with everything in between being choppy and trap filled. Should SPY fail to move above $768, expect weakness to continue on Tuesday. Above $768 the market will attempt to clear $772, however gamma turns positive there and Dealers will look to sell rallies. Below $765 gamma is negative, and there is little below $762 to keep SPY from falling further. We continue to favor trades with the trend on Tuesday and will restrict mean reversion trade opportunities until SPY clears $768. Dealer positioning is unchanged at neutral/slightly bullish.
Looking Ahead to Next Friday:
Dealers are selling SPY $775 to $800 and higher strike Calls while buying $764 to $770 Calls, indicating the Dealers' desire to participate in any short squeeze or relief rally this week. They are buying ATM Calls to stay positioned for that upside. The ceiling for the week appears to be $780. To the downside, Dealers are buying $763 to $700 and lower strike Puts in a 4:1 ratio to the Calls they're selling, displaying continued concern that prices could move lower. Dealers remain hedged but have not added to their protection for this week. Below $765 is bearish and above $768 is bullish, with the range in between being choppy and trap filled. There is major support at $760 with major resistance at $772 to $775. Gamma is negative, and as such expect more trending opportunities into the end of the week. For the week Dealer positioning is unchanged at neutral/slightly bearish. We advise reviewing Dealer positioning daily for directional clues. These positions evolve quickly and tracking them is essential for staying ahead of shifting market sentiment.
Recommendation for Traders
Buy dips near $763, targeting $770 and $773, with stops below $760. A loss of $753 opens the door to $750.
With no economic news Tuesday, keep size light and review the premarket analysis posted before 9 AM ET for any changes in the model's outlook and Dealer Positioning.
Good luck and good trading!
