
Market Insights: Friday, October 16th, 2026
Market Overview
Stocks gave back Thursday's gains and then some on Friday, as tech led the market lower amid continued scrutiny of AI, with software and semiconductor stocks sliding alongside it. The Nasdaq tumbled 2.1%, the S&P 500 lost 1.1%, and the Dow slipped 0.4%. The day actually started on a strong note, with nearly four in five S&P 500 components climbing in the morning, but that broad buying unraveled fast. By the afternoon, roughly three in five were falling, the Nasdaq was headed for its worst day since June 5, and the S&P 500 had erased its October gain. Fear came roaring back, with the Cboe Volatility Index climbing more than four points to put its biggest daily jump since June 5 in play after briefly hitting 22.31, its highest intraday level since June 11. Oil poured fuel on the fire. Brent crude touched $110 a barrel for the first time since May as Iran escalated attacks in the Strait of Hormuz, while US crude held comfortably above $100, with both gaining nearly 4%. That adds another inflation headache after this week's hot price reports. For the week, the Nasdaq fell 4.5%, snapping a month-long winning streak with its worst week since late June, and the S&P 500 declined 1.95% following the chip sell-off earlier in the week. The Dow bucked the trend with a 1.5% weekly gain as investors rotated out of tech and into defensive sectors like Health Care, which climbed to record highs.
Semiconductors drifted lower to cap a volatile week for the group that has driven much of this year's AI trade, and CoreWeave came under pressure again over its debt-heavy balance sheet after Thursday's rebound sparked by Jensen Huang's upbeat comments. Still, Bank of America analysts led by Vivek Arya argue the AI trade remains "resilient," pointing to one key metric: utilization. Critics often compare the AI capex boom to the early-2000s fiber optic buildout, when companies laid massive amounts of cable expecting demand to follow, and several went bankrupt when it arrived too slowly. The difference now, BofA says, is that "deployed AI infrastructure runs near 100% utilization rate," while GPU rental rates have climbed 12% to 37% year-to-date, "a sign of scarcity, not glut." The analysts see demand coming in waves, starting with the shift from traditional computing to generative AI, followed by reasoning models, and next by agentic capabilities. They acknowledge risks, including a potential credit wipeout at a neocloud like CoreWeave, pressure from the rates market, and power or permitting delays, but they're staying bullish. "Rising rates, geopolitics, data center backlash and stress at some sub-IG neoclouds have revived dot-com comparisons, and the SOX has already endured multiple 20%+ bear markets this year," they wrote. "We think the risk is priced in." Looking ahead, earnings season heats up next week, with Tesla, fresh off unveiling a jaw-dropping Roadster redesign, set to report alongside Netflix and Meta.
SPY Performance
SPY opened at $773.24, gapping up above yesterday's close of $771.77 and even clearing yesterday's high of $772.87. For about a minute, it looked like the bulls were ready to build on the reversal. That opening print turned out to be the high of the day. Sellers went to work immediately, and SPY never traded above its opening level again. The selling erased the gap, sliced through yesterday's low of $764.44 (the level we flagged as the most important on the chart), and kept going to a session low of $760.64. SPY recovered a little off the bottom but still finished at $763.23, below that key $764.44 line and near the lower end of the day's range.
SPY fell 1.11%, and this time the shape of the session and the size of the move told the same story. Volume came in at 55.49 million shares, near average and a big step up from yesterday's sleepy turnover. That matters. Yesterday's bounce happened on light participation, while today's selloff came with real commitment behind it. When a market rallies on thin volume and then drops on heavier volume, it usually means the sellers are still in control. Opening at the high and closing near the low is about as bearish as a single session gets. Every attempt to hold early gains got sold, and buyers never showed up with enough size to stop the slide. The VIX jumped 22.84% to close at 20.22, pushing back above the 20 mark for the first time in this pullback. That's a meaningful shift in sentiment. Traders aren't just holding onto their protection anymore. They're paying up for more of it, and a VIX above 20 signals that fear is starting to take over from caution. The bigger picture just got worse. We said a close below $764.44 would erase yesterday's recovery and suggest the selling pressure was far from over, and that's exactly what happened. Yesterday's shakeout now looks more like a failed bounce than a bottom. On the upside, $764.44 flips from support to the first level of resistance, with $766.71 right above it. Beyond that, today's opening high of $773.24 and yesterday's high of $772.87 form a ceiling SPY would need to reclaim to repair today's damage, and the $775.95 to $776.30 zone remains well out of reach for now. On the downside, today's low of $760.64 is the line to watch. If it holds, SPY could try to stabilize and retest the broken levels overhead. A close below it would open the door to a deeper leg lower and confirm that this pullback is turning into something more serious. Yesterday the bulls won a round on light volume. Today the bears answered with conviction, and right now they hold the upper hand.
Major Indices Performance
The Dow held up best in a rough session, slipping just 0.34% and once again proving it's the market's safe harbor when the selling gets heavy. Blue-chip value names cushioned the blow while growth stocks took a beating, which keeps the rotation story alive and well. Investors aren't abandoning the market entirely. They're hiding out in industrials, financials and other old-economy plays that don't carry sky-high valuations. The Dow didn't escape the red, but losing a fraction of what the Nasdaq gave up tells you exactly where money feels safest right now. As long as that defensive bid sticks around, the blue chips should keep outperforming on down days.
The Russell 2000 gave back all of its prior gains and then some, dropping 1.76% and wiping out the previous session's rebound. Small-caps went from the market's top performer right back to the doghouse, and that kind of whiplash shows how shaky confidence still is in the riskiest corner of the market. Pressure from higher rates came roaring back, and rate-sensitive small-caps felt it more than most. The hope that the recent breakdown was just a shakeout took a hit today. Buyers who stepped in during the bounce got burned quickly, and small-caps will need to prove they can hold support before anyone trusts another rally.
The Nasdaq got hit the hardest, sinking 2.15% as mega-cap tech led the market lower. After barely scraping into positive territory in the prior session, the tech-heavy index couldn't find any footing, and selling in high-multiple growth names dragged the whole group down. The weakness we flagged when tech failed to join the broad-based bounce turned out to be a real warning sign. The rotation away from tech clearly isn't finished yet. The S&P 500 landed in between with a solid loss, weighed down by its heavy tech exposure. The VIX surged 22.84% to close at 20.22, jumping back above 20 and showing that fear returned in a big way as sellers took control.
Notable Stock Movements
Meta took the hardest hit in the Magnificent Seven, sliding 3.72% to lead the group lower. That's a rough follow-up for a name that already failed to bounce in the prior session, and it shows sellers aren't done with it yet. When a mega-cap keeps getting hit day after day, it usually means bigger funds are trimming positions rather than just reacting to one bad headline. Meta needs to find a floor soon, or this pullback could turn into a deeper reset for the stock.
The group as a whole put up another mostly red session, and this one felt more like the broad tech dump traders saw earlier in the week than the rotation we saw last time. Apple was the lone bright spot, gaining 0.43%, while the rest of the group finished in the red. That means Microsoft gave back its recent strength and Alphabet and Amazon couldn't hold their gains either. Apple acting as a safe spot again makes sense. Investors often hide in its steady cash flow when they're nervous about the more aggressive growth names. One winner out of seven is a weak showing, and it suggests the selling pressure was hitting big tech across the board.
The broader market backs up that bearish tone. The Nasdaq fell 2.15%, taking the brunt of the damage, while the Russell 2000 dropped 1.76% and wiped out its recent bounce. The Dow held up best at just a 0.34% loss, which tells you money was moving into defensive, old-economy names instead of growth. The VIX jumped 22.84% to 20.22, pushing fear back above the key 20 level and signaling that traders are paying up for protection. Monday brings no economic news, so big tech will trade purely on technicals and positioning. If Apple can keep holding firm and Meta finds support, the Nasdaq could stabilize and stop dragging on the broader market. But if the selling spreads further and Apple starts to crack too, the tech-heavy index could stay under heavy pressure, with the Dow left as the only place to hide.
Commodity and Cryptocurrency Updates
Crude oil kept pushing higher, rising 1.04% to close at $98.99. That's yet another new high for this run, and oil is now knocking on the door of the $100 mark. Crude has rallied well above $70 and far beyond longer-term model expectations, and the geopolitical tensions and supply disruptions behind the move show no signs of easing. Buyers continue to show up session after session, and with no economic data on Monday's calendar, oil will likely keep trading on headlines and momentum. The real worry is what happens if crude holds near these levels, because sustained energy costs this high will keep adding to inflationary pressure and could seriously complicate the Fed's path on rate policy.
Gold added to its gains, rising 0.48% to close at $4,190. It wasn't as explosive as the prior session's surge, but the metal held its ground on a day when stocks took a beating, and that kind of steadiness says a lot about the demand underneath it. Sellers had a chance to pounce and couldn't do much with it. The long-term drivers remain firmly in place: inflation uncertainty, steady central bank buying, and a constant stream of geopolitical headlines all continue to support the bid. With the bulls still in control, gold looks positioned to make another run at its highs, and holding above these levels will be key to keeping that push alive.
Bitcoin slipped back, falling 0.73% but holding above $81,544. That gave back a chunk of the prior session's bounce and fit right into the frustrating back-and-forth pattern crypto has been stuck in. Bitcoin didn't escape the risk-off mood that hammered growth names, though its decline was relatively contained compared with the heavier selling in tech. Still, the one step forward, one step back rhythm makes it hard for bulls to build any real conviction. Buyers need to string together consecutive gains to prove momentum is shifting, and until that happens, the broader trend stays under pressure, with a break below recent lows opening the door to more downside.
Treasury Yield Information
The 10-year Treasury yield rose 0.18% today to close at 5.100, snapping a four-day streak of declines. The move itself was small, giving back only a sliver of yesterday's big drop, but the direction matters. Bond buyers who had been pressing yields toward the 5% line stepped back, and the push to break below that level stalled out. The rate pullback that gave stocks breathing room hasn't reversed, but it has clearly lost momentum at a critical spot.
Measured against each threshold, the picture barely changed but the stall is worth noting. The 4.5% level where equity valuations start to feel the squeeze is 60 basis points below today's close. The 4.8% mark that usually triggers broader selling sits 30 basis points back. The 5% line for serious risk is now cleared by 10 basis points, so the 10-year remains stuck above the framework's serious-risk warning. On the bright side, the cushion under 5.2% held at 10 basis points, meaning the level where the framework calls for a 20% or greater correction is still at a safe distance for now.
Stocks reacted far more violently than the bond market did. The Nasdaq dropped 2.15% and the Russell 2000 fell 1.76%, while the Dow held up better with a 0.34% loss. A tiny uptick in yields doesn't explain a selloff that size on its own, but it shows how fragile equities are with the 10-year parked above 5%. When rates are this elevated, there's little room for error, and growth names and debt-heavy small caps get hit hardest when sentiment turns. The VIX jumped 22.84% to 20.22, a sharp spike that wiped out yesterday's calm and signals that fear is back in play.
Monday brings no economic news, so the 10-year will trade on positioning and whatever risk appetite carries over from today's selloff. The key question is whether this stall is a pause or a turning point. If equity weakness drives money into bonds, yields could resume their slide and finally take out 5%, which would give stocks real relief. If yields instead grind higher, especially with energy prices still elevated and feeding inflation worries, the cushion under 5.2% could shrink quickly. Until the 10-year closes convincingly under 5%, the rate backdrop remains a headwind that leaves stocks vulnerable to exactly the kind of selling we saw today.
Previous Day’s Forecast Analysis
Heading into Friday, our AI model projected SPY's maximum range at $766 to $778, with the Put side dominating an expanding band. That setup called for trending price action broken up by intermittent chop. With an empty economic calendar, the forecast expected the tape to trade purely on technicals, and the only wildcard was the market's opening reaction to Fed Chairman Warsh's late-night remarks Thursday. Because SPY had settled just below the midpoint of the projected range, the outlook carried a modestly bearish bias by position, which lined up with the Put-heavy band. The VIX had dropped 2.43% to 16.46, which was read as only a modest easing of fear rather than a full risk-on shift. With price still boxed inside the $770 to $773 zone, the forecast said a decisive breakout was likely.
The key levels were clearly defined. On the upside, $773 was the first test and the preferred spot to short rallies, followed by $775, $778 at the top of the projected range, and $780 as final resistance. On the downside, $770 was the pivot, with $768 and $765 below it. $760 was the last line of defense for bulls, and a break there opened the door toward $750. The broader bull trend was considered intact above structural support near $640.
The recommended strategy favored the short side. Traders were told to keep size at half to three-quarters of normal, use stops of 0.5-0.75%, and let the first 30 minutes establish direction. The primary setup was shorting a stall and rollover near $773, with targets at $770, $768, $766, $765, and $760, and $750 reserved as a stretch target. Stops on shorts belonged above $775, or above $778 for aggressive traders. If $770 broke early, the advice was to short a failed retest rather than chase the move. Longs were the secondary setup at roughly half size. The best long trigger was a flush into $766 or $765 that held, targeting $768, $770, and $773, with stops below $760. A firm break above $773 would neutralize the bearish tilt and turn a retest of $773 into a buy, aiming for $775, $778, and possibly $780.
Market Performance vs. Forecast
Friday's session delivered the bearish lean the model called for, and the level structure framed the selloff from the opening bell to the close. The forecast projected a maximum range of $766 to $778 with the Put side dominating an expanding band, and it described a modestly bearish bias by position after Thursday's close. That directional call was correct. SPY opened at $773.24, which also marked the session high, then slid to a low of $760.64 before closing at $763.23, down 1.11%. The model does not account for unpredictable external events, and the forecast flagged Fed Chairman Warsh's late-night remarks as the one wildcard that could color the open. External catalysts drove price action beyond the projected range on the downside, introducing volatility that exceeded the model's base case scenario. Still, the forecast's support structure caught the decline right where it said the bulls would make their last stand.
The $773 level was the standout call of the day. The forecast named it as the first test overhead and the exact spot to short rallies in a Put-dominated tape. SPY opened right at that level and never traded above it, so the session high sat directly on the resistance the playbook highlighted. From there, sellers worked straight through the downside roadmap. The $770 pivot gave way, and price moved through the $768 and $766 targets and past $765 at the bottom of the projected range. The forecast warned that breakdowns below support were more likely to accelerate than to get bought, and that is how the session unfolded. The session low stopped less than a dollar above $760, the level the forecast called the lowest support and the point of last hope for bulls. That line held into the close, and the $750 stretch target never came into play.
On the falling market side, the primary setup was shorting rallies that stalled near $773, with first targets at $770 and $768 and runners aimed at $766, $765 and $760. Price rejected $773 at the open and every one of those targets down to the $760 zone came within reach. Stops above $775 were never threatened, since the session high never cleared $773. The guidance not to chase an early slice below $770, and to short a failed retest from underneath, kept traders working with the trend instead of against it. On the rising market side, longs were the secondary setup and required a flush into $766 or $765 that held and bounced. That hold never materialized as sellers pressed through, so the trigger stayed inactive and disciplined traders stood aside. The protective stop below $760 was never hit, and the forecast's call to keep bull-side size at roughly half the bear side meant positioning favored the right side of the tape.
The VIX rose 22.84% to 20.22. That is a sharp jump in fear and lands well above the 16 line the forecast set as the threshold for trimming size. The guidance to trade half to three-quarters of normal size with 0.5-0.75% stops was exactly the right approach for a session that trended lower with conviction. Volume came in near average, which suggests the selling reflected real repositioning rather than a thin-market drift. The $773 rejection, the $770 pivot break and the $760 support test gave traders clear reference points on a day when external catalysts amplified the move. The framework adapts as conditions shift. With the long-term bull trend still intact above structural support near $640, it remains a dependable guide for managing risk and spotting opportunity heading into next week.
Premarket Analysis Summary
The premarket analysis, posted before the opening bell, set up Friday with SPY at $772.79 in a call-dominated tape, extending Thursday's rebound that reclaimed $770 and seemed to confirm Wednesday's slide as a flush rather than a break. The bias leaned bullish. The expected move ran from $764 to $779, but with heavy interest stacked between $770 and $775, the notes argued the session was built to pin unless one side forced the issue. Upside targets stepped through $774, $776, $778, and $780 as max upside. The defining level was $775, the heaviest concentration on the board and the gate bulls needed to reclaim, while failure there would keep price boxed between $770 and $775. On the downside, $772 was called the most important level below and the line in the sand, with a clean loss reopening Wednesday's lows. Below that sat $770 as the next decision point, $768 as the point of last hope, and $765 as max downside, just under the bottom of the expected move.
The session went the opposite way, and sellers were the side that forced the issue. SPY opened at $773.24, which also turned out to be the high of the day, so price never even reached the $774 first target, let alone tested $775. Once $772 gave way, the warning in the notes played out almost exactly as written. The loss of $770 brought the quick trip to $768, and the "real fight" at $765 never really happened as buyers failed to show up at the max downside level. SPY sliced through the bottom of the expected move at $764 and hit a low of $760.64 before closing at $763.23, down 1.11%, on 55.49M shares of near-average volume. The VIX jumped 22.84% to 20.22, signaling that Thursday's calm was short-lived. The pin scenario failed completely, and the call-dominated positioning turned out to be fuel for the unwind instead of support. The key takeaway is that $772 really was the line in the sand, and the downside roadmap held up even though the bias did not. With price now closing below $765 and outside the expected move, that level and $770 above become resistance to reclaim heading into next week.
Validation of the Analysis
Friday didn't deliver the pin the notes said was possible, but the premarket map still laid out the exact path sellers took. The analysis set up a simple fork: "Hold 772 and 775 gets tested; lose 770 and expect a quick trip to 768, then a real fight at 765." SPY opened at $773.24, just above the $772 line the notes called "the heaviest support on the board and our line in the sand." That open was also the high of the day, so price never reached the $774 step, and the $775 gate the bulls needed was never tested. The notes warned that failing to take back $775 would keep the bears in play. They also said a Friday like this was "built to pin unless one side forces the issue," and sellers forced it from the opening bell.
Once $772 gave way, the analysis had already spelled out the consequence: "losing it cleanly reopens Wednesday's lows." Every downside marker came into play in order. The $770 floor reclaimed on Thursday failed, the $768 "point of last hope" gave way, and price kept falling into the $765 max downside level the notes described as major support. The selling didn't stop there. SPY broke through $765 and the $764 bottom of the projected range, then found its low at $760.64 before closing at $763.23, down 1.11%. That is a move beyond the published range, and the notes gave readers fair warning of the risk by noting that $765 sat "just under the bottom of the expected move." The VIX rose 22.84% to 20.22, confirming that the call-heavy positioning from the morning unwound fast. When a market cuts through every support on the board in one session, it is fresh information about trend strength, and it matters for next week's map.
The trading value came from the order and spacing of the levels. Traders watching $772 at the open had a clear trigger the moment price slipped under it, with $770, $768, and $765 lined up as profit targets on the way down. Each one gave shorts a natural place to scale out instead of guessing where the bounce would come. The framework was just as useful for what it told traders to avoid. Because the notes required bulls to reclaim $775 before the upside case came alive, nobody following the map had a reason to buy the open or chase toward $778 and $780. Buyers who wanted to fade the drop at $768 or $765 had defined levels to lean on, and when those levels broke, they had clear places to cut the trade and keep losses small. The break of $772, the failure at $770, and the slide through $768 and $765 all followed levels published before the bell. The flush below the projected range is the clear takeaway heading into next week, and Monday's levels will need to account for how much ground sellers took back.
Looking Ahead
Monday's economic calendar is wide open, with no high-impact releases scheduled to kick off the new week. That means there's no 8:30 AM ET report to set the tone and no data surprise to jolt futures before the bell. The market will have to work off whatever momentum and sentiment it carried out of Friday's close, along with anything that develops over the weekend. Sessions like this can be surprisingly revealing. Without a fresh catalyst, the direction traders choose shows you what they actually believe rather than how they react to a headline. If buyers show up early and hold their ground, it signals that confidence runs deeper than the news cycle. If the market stalls or slips, it hints that recent strength may have been more fragile than it looked.
Traders can use Monday to position with intention instead of scrambling to react. It's a smart time to reassess open trades, decide which setups still make sense, and map out key levels before the week gets moving. A quiet calendar doesn't guarantee a quiet tape, though. Weekend headlines, corporate announcements, and shifting sector rotation can all spark sudden moves, and thinner participation can make those swings look bigger than they really are. Be cautious about reading too much into an early pop or drop, since the first hour on a light day can easily reverse. Stay disciplined, wait for price action to confirm a trend before committing capital, and treat Monday as a chance to build a clean game plan rather than chase moves that lack follow-through.
Market Sentiment and Key Levels
Friday handed control back to the bears, and the way it unfolded matters more than the headline loss. Sellers showed up right at the bell and never really let go. The early print turned out to be the best level of the day, and buyers only managed a half-hearted bounce late in the session. Breadth confirmed the damage. The Nasdaq dropped 2.15% and the Russell 2000 fell 1.76%, while the Dow held up far better with a loss of just 0.34%. When growth and small caps get hit hardest while blue chips hold firm, investors are pulling back from risk rather than simply rotating. Mega-cap tech led the retreat instead of cushioning it, and Bitcoin's 0.73% slip showed speculative appetite cooling as well. Fear came roaring back. The VIX jumped 22.84% to 20.22, pushing the fear gauge back above the 20 mark and erasing Thursday's calm in a single session. Short-term momentum now clearly favors the bears, though the broader picture has not broken down.
SPY finished in the upper half of the $760 to $765 range that has defined recent trading, putting $765 squarely in focus as resistance. A push through it opens the door to $767, with $770 and $775 in play if buyers can mount a real recovery. On the downside, $760 is the first line of support. Losing it targets $757, followed by $750 and $747. If $747 gives way, there is little to keep price from falling toward $745. The bigger picture still leans bullish, with the long-term trend intact well above structural support at $640, so this remains a broader dip-buying environment as long as key levels hold. Monday's projected maximum range runs from $754 to $771, with the Put side dominating in an expanding band that points to trending price action mixed with intermittent chop. There is no economic news on the calendar, so the market will trade on technicals and the levels above will carry extra weight. Traders will be watching whether tech can stabilize or whether Friday's selling spills into a second session. Elevated yields and firm energy prices remain a background headwind, and gold's steady gain hints that investors are still reaching for protection. We favor shorting rallies near $765 rather than buying into weakness. Keep stops disciplined above $767, watch how price behaves around $760, and make the bulls prove they can reclaim resistance before changing course.
Expected Price Action
Monday's session brings actionable intelligence generated by our AI model, which projects SPY's maximum range at $754 to $771. With the Put side dominating in an expanding band, the model is calling for trending price action with intermittent chop. The economic calendar is empty, so there is no scheduled data to jolt the tape, and the market will trade on technicals. That puts the spotlight squarely on how price reacts at the model's key levels. Friday was a one-way session, with sellers in control from the opening bell and buyers managing only a token bounce late in the day. SPY settled just above the midpoint of the projected range, which gives us a modestly bullish bias by position heading into Monday. That lean runs against the Put-heavy band, though, so the edge still belongs to sellers until buyers prove otherwise. The VIX rose 22.84% to 20.22, a sharp jump in fear that tells us traders are paying up for protection after a selloff that never let up. Price is still working inside the $760 to $765 range that has defined recent trading, and with an expanding band and no headlines to hide behind, a decisive break out of this zone looks likely.
The first test for Monday is $765, sitting right overhead at the top of the recent range. In a Put-dominated tape, this is exactly where we favor shorting rallies. If buyers can push through and hold it, SPY targets $767 next, with $770 just under the top of the projected range and $775 standing as the final overhead resistance where any squeeze should run into heavy supply. On the downside, $760 is the pivot, and a clean break there likely sends price toward $757, followed by $750 as the next shelf of support. Below that, $747 is the lowest support and the point of last hope for bulls. If $747 gives way, there is little to keep price from falling toward $745. The bigger picture remains healthy, with SPY trading well above structural support near $640 and the long-term bull trend intact, so this is still a dip-buying market on a broader timeframe even as short-term momentum has turned lower. In the short run, the playbook is straightforward. With no data on the calendar and fear elevated, let the opening auction settle before committing. Rallies that stall near $765 are selling opportunities, while a firm hold above $765 would neutralize the bearish tilt and open a run at $767. A failure at $760 could mean a quick trip to $757, and with the Put side in control, breakdowns below support are more likely to accelerate than to get bought. Whichever side wins the battle at $760 or $765 likely sets the trend for the start of the week.
Trading Strategy
The VIX rose 22.84% to 20.22, a sharp jump in fear that pushed volatility back above the 20 line. That's a clear warning sign, so trim size to roughly half of normal and keep stops in the 0.5-0.75% range from entry. Wider intraday swings mean smaller positions, not looser discipline. Monday has no economic news on the calendar, so there's no data spike to dodge at the open, and the tape will trade purely on technicals. Expect trending moves broken up by intermittent chop. Let the first 30 minutes establish direction before committing, and stay out of the middle of the range where the chop will eat you alive.
In a falling market scenario, shorting rallies near $765 is our preferred setup, with the Put side dominating an expanding band. A push into $765 that stalls and rolls over is the primary short trigger, especially if the VIX keeps climbing while price fails to break through. The first profit target is $760, with $757 next if sellers crack first support. Runners can aim for $754 near the bottom of the projected range, then $750 and $747. If $747 gives way, $745 comes into play, but treat that as a stretch target reserved for a strong trend day. Stops on shorts belong above $767, and aggressive traders can give it room above $771 at the top of the projected range. If price slices below $760 early, don't chase. Short a failed retest of $760 from underneath instead. With puts in control, bear-side size can lead.
In a rising market scenario, longs are the secondary setup and should be traded lighter. A flush into $757 or $754 that holds and bounces is the cleanest long trigger, particularly if the VIX starts to cool while price stabilizes. The initial profit target is $760, with $765 and then $767 in play if buyers regain control. Stops on longs belong below $750, because losing that level opens a fast slide toward $747 and $745. If bulls clear $767 with conviction, buy a clean retest of $767 as support, targeting $770 and then $771. Treat $775 as a stretch target only on a strong breakout day. Keep bull-side size at roughly half the bear side and take profits in layers into resistance. The long-term bull trend remains intact above $640, so dip-buyers will likely defend deeper pullbacks. For now, though, the burden of proof is on the bulls to reclaim $765.
Model’s Projected Range
SPY's projected maximum range for Monday is $754 to $771, with the Put side dominating in an expanding band that suggests trending price action with intermittent chop. Monday brings no economic news due out so the market will trade on technicals, which puts the focus squarely on how price reacts at our model's key levels. SPY closed at $763.23, down 1.11%, in a session where sellers took control right from the bell as the open at $773.24 turned out to be the high of the day before price slid to a low of $760.64 and managed only a modest bounce into the close. SPY remains in the $760 to $765 range that has defined recent trading, and with no fresh macro catalyst on the radar, price action and positioning are driving the tape. If SPY breaks above $765, our model points to a move toward $767, while a break below $760 opens the door to $757, and if the lowest support at $747 gives way there is little to keep price from falling toward $745. The long-term bull trend remains intact above $640 with SPY well above structural support. As long as price holds above key structural levels, this remains a broader dip-buying environment. Absent a catalyst, resistance sits at $765, $767, $770, $775, while support rests at $760, $757, $750, $747. With SPY closing in the upper half of the range and the Put side in control, we favor shorting rallies near $765. Bitcoin slipped 0.73% but held above $81,544, and the MAG stocks had a mostly red day led lower by Meta, down 3.72%, with Apple the lone bright spot, up 0.43%, so sustained weakness across both leadership groups would be required to signal a deeper pullback. The VIX closed at 20.22, up 22.84%, suggesting elevated fear given the sharp selloff that started right at the open and kept pressure on the market all session. SPY closed well above structural support near $640, keeping the broader uptrend intact even as short-term momentum has turned lower.
Market State Indicator (MSI) Forecast
Current Market State Overview:
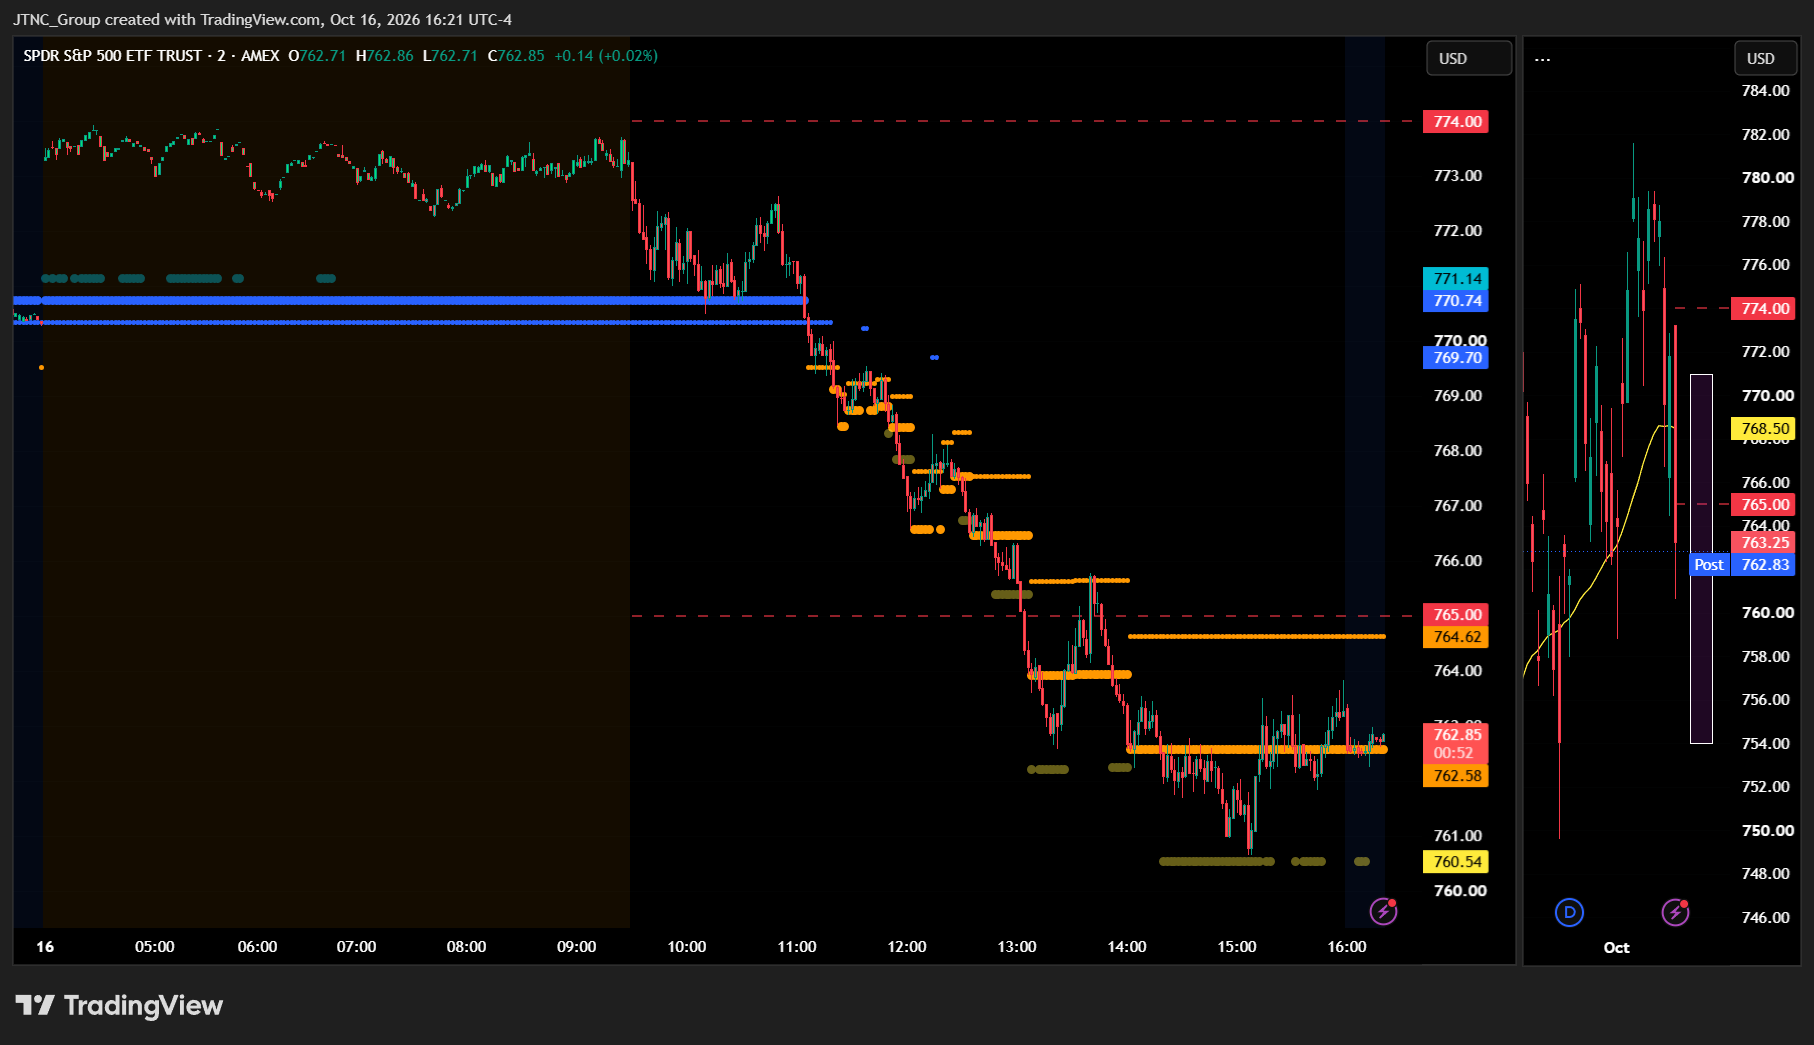
The MSI ended Friday in a Bearish Trending Market State with SPY closing at $763.23. MSI resistance is $764.62 and MSI support is $762.58 heading into Monday. The MSI did not rescale overnight and carried its very narrow bullish range from Thursday into the session. Extended targets printed above in the premarket, but once the regular session began they stopped, and through the morning there were no extended targets at all even though the market looked poised to move higher. Late in the morning the very narrow range finally gave way. The MSI flipped to a Bearish Trending state and put in a series of rapid rescalings lower with extended targets printing below, and price broke Thursday's low and the 50 DMA. A late day bounce provided some relief. By the close the MSI had settled into an average-width $2.04 bearish state with no extended targets printing below.
For Monday that implies the likelihood of further weakness. The absence of extended targets at the close means the sellers paused rather than pressed into the bell, but the state is bearish and the trend is down. Should extended targets start printing below once again, a test of lower levels is likely.
Key Levels and Market Movements:
Thursday we stated, "Bulls want to see overnight price hold above $770.74 and stay near the $771.77 close," and added, "Bears want to see $770.74 and $770.33 fail," while also noting, "If $770.33 breaks with the MSI rescaling lower and extended targets printing below, that level flips to resistance." We also said that as long as SPY held above $772, higher prices were likely. The bulls got their wish early. SPY held above $770.74 overnight, extended targets printed above in the premarket, and SPY opened at $773.24. That was as good as it got. With no extended targets printing through the morning, the push higher never came, $772 broke before noon, and price fell off a cliff. Once $770.74 and $770.33 gave way, the MSI flipped to Bearish Trending with extended targets printing below, exactly the scenario we laid out for the bears.
Six trades followed, all with the trend until the very end. The first was selling the break of the narrow bullish range as the MSI rescaled bearish with extended targets printing below. From there the MSI rescaled lower several times in quick succession, and each retest of the newly rescaled MSI resistance from below, with extended targets still printing beneath price, was a fresh short. Those trades carried SPY through Thursday's $764.44 low, through the 50 DMA, and through $765 major support to a session low of $760.64. Sellers finally ran out of steam there, and the failed breakdown at the lows offered the sixth trade, a long back toward MSI resistance that produced the late day bounce. SPY settled at $763.23.
SPY lost 1.11% on volume of 55.49 million shares, near average and well above Thursday's turnover, while the Nasdaq fell more than 2% as tech took the brunt of the damage and dragged the broader market with it. The VIX jumped 22.84% to 20.22, a sign that fear is creeping back into the market. It was a volatile but readable day with substantial setups, all identified through proper context, patience, and flexibility while leveraging the MSI, premarket levels, and market structure rather than forcing trades. The MSI continues to prove its reliability as the cornerstone of our trading process.
Trading Strategy Based on MSI:
Monday has light economic news, so the tape will key off Friday's momentum and any weekend headlines. The MSI closed in an average-width $2.04 Bearish Trending state with no extended targets printing below. That implies the likelihood of further weakness on Monday, and should extended targets start printing below once again, a possible test of lower levels. $764.62 remains MSI resistance and $762.58 remains MSI support.
Bulls want to see overnight price hold above $762.58 and stay near the $763.23 close. From there they need to reclaim $764.62 and push back through Thursday's $764.44 low and $765 major support, with the 50 DMA near $768.50 the real test. If the MSI rescales higher and extended targets print above, that would be the first sign that sellers are losing their grip. Bears want to see $762.58 fail with the MSI rescaling lower and extended targets printing below. That would press SPY back toward Friday's $760.64 low and $760, with lower levels in play if the rescaling continues. With tech under heavy pressure and the VIX back above 20, the burden of proof is on the bulls.
With bears holding the edge, the primary setup for Monday is selling a rally into $764.62 MSI resistance that fails, using a reclaim of $765 as the line in the sand, and targeting $762.58 and then the $760.64 low. If $762.58 breaks with the MSI rescaling lower and extended targets printing below, that level flips to resistance, and traders can sell rallies into it while targeting $760.64 and the premarket levels below. A failed breakdown below $762.58 that quickly reclaims the level offers a long back toward $764.62, but keep it small and quick while the MSI stays bearish. A failed breakout above $764.62 that slips back under offers another short back toward $762.58.
The long-term bull trend remains intact above $640 and failed breakouts and failed breakdowns continue to offer the highest-probability setups. Remain flexible, avoid trading during Ranging Market States unless a clear failed breakout or breakdown presents itself, and ensure all trades are fully aligned with MSI signals. Providing real-time insights into market control, momentum shifts, and actionable levels, the MSI when integrated with our Pre-Market and Post-Market Reports continues to sharpen execution precision and elevate trade quality. If you haven't yet integrated MSI and our model levels into your process, now is the time. Contact your representative to get started as these tools are designed to support consistency and enhance performance.
Dealer Positioning Analysis
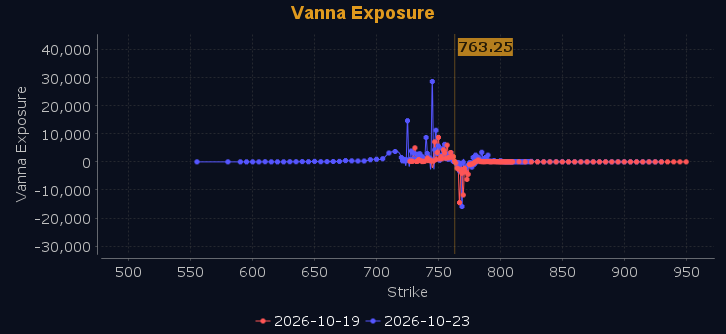
Dealers are selling SPY $775 to $800 and higher strike Calls while buying $764 to $774 Calls, indicating the Dealers' desire to participate in any relief rally on Monday. They are heavily buying ATM Calls, and their positioning and hedging remain unchanged. The ceiling for Monday appears to be $782. To the downside, Dealers are buying $763 to $705 and lower strike Puts in a 3:1 ratio to the Calls they're selling, displaying continued concern that prices could move lower. Below $767 is bearish and above $770 is bullish, with everything in between being choppy and trap filled. Should SPY fail to move above $770, expect weakness to continue on Monday. Above $770 the market will attempt to clear $774, however gamma turns positive there and Dealers will look to sell rallies. Below $767 gamma is negative, and there is little below $762 to keep SPY from falling to $760. Should things turn very ugly, SPY could visit $750. We continue to favor trades with the trend on Monday and will restrict mean reversion trade opportunities until SPY clears $770. Dealer positioning is unchanged at neutral/slightly bullish.
Looking Ahead to Next Friday:
Dealers are selling SPY $777 to $800 and higher strike Calls while buying $764 to $776 Calls, indicating the Dealers' desire to participate in any short squeeze or relief rally on Monday. They are buying ATM Calls to stay positioned for that upside. The ceiling for the week appears to be $785. To the downside, Dealers are buying $763 to $700 and lower strike Puts in a 4:1 ratio to the Calls they're selling, displaying continued concern that prices could move lower. Dealers remain hedged but have not added to their protection for next week. Below $769 is bearish and above $770 is bullish, with the range in between being choppy and trap filled. There is major support at $760 with major resistance at $775. Gamma is negative, and as such expect more trending opportunities into the end of next week. For the week Dealer positioning is unchanged at neutral/slightly bearish. We advise reviewing Dealer positioning daily for directional clues. These positions evolve quickly and tracking them is essential for staying ahead of shifting market sentiment.
Recommendation for Traders
Short rallies near $765, targeting $760 and $757, with stops above $767. A break under $747 opens the door to $745.
With no economic news Monday, keep size light and review the premarket analysis posted before 9 AM ET for any changes in the model's outlook and Dealer Positioning.
Good luck and good trading!
