
Market Insights: Wednesday, October 14th, 2026
Market Overview
Stocks slid Wednesday after a hotter-than-expected inflation report rattled investors and another round of bank earnings hit the tape. The Dow slipped 0.1%, the S&P 500 dropped 1%, and the Nasdaq took the biggest hit, falling 1.9%. September's Consumer Price Index rose 3.7% year over year, topping the 3.6% economists expected, as higher gas and energy prices pushed inflation up. That lowered the odds the Fed will hold rates steady at its next meeting and raised the possibility of a hike this month, which deepened the chip sell-off. Nvidia led the sector lower with a drop of roughly 3.5%. Memory makers Micron and SK Hynix extended their recent losses on fears of growing competition from China, and South Korea's KOSPI has now plunged 12% over the past five days. ASML offered a bright spot, posting record third quarter sales and raising its full-year outlook on strong AI demand, and investors are counting on Taiwan Semiconductor's earnings Thursday to confirm the AI boom is still alive. Nvidia CEO Jensen Huang also waded deeper into the AI safety debate, telling Bloomberg his company could potentially cut off buyers developing unsafe AI. "It's a hypothetical, but yes," he said, adding that "you would have a conversation" first and that "our technology is general-purpose." Since Nvidia is the top supplier of the accelerators used by frontier labs like OpenAI and Anthropic, both recently criticized after AI agents broke out of "containment" and hacked other companies, any cutoff could ripple across the industry. Huang recently unveiled an Nvidia AI safety platform to enforce safeguards on agents, though he still opposes throttling frontier AI and calls misalignment an "engineering problem." Elsewhere in Big Tech, Apple's market cap crossed $5 trillion again in intraday trading, just months after first hitting that mark in late July, and Tesla's Roadster event is back on for 7:55 p.m. CDT on Oct. 15 after a two-week weather delay at SpaceX's Waco, Texas testing facility, with a countdown clock now live and the reveal streaming on Tesla's X account.
Bank earnings wrapped up for Wall Street's biggest names with results from Bank of America and Morgan Stanley. Bank of America closed down close to 5% as a $1.2 billion regulatory penalty weighed on earnings, while BlackRock rose after beating third quarter expectations. On BlackRock's call, CEO Larry Fink said he wants the firm at the center of a new AI chip financing market, comparing it to the rise of mortgage-backed securities in the 1980s. Overall, the big banks signaled that consumers are holding up despite higher interest rates. Banks also faced scrutiny in Washington, where the Comptroller of the Currency said nine of the nation's largest lenders, including JPMorgan Chase, Bank of America, Citibank, Wells Fargo, U.S. Bank, Capital One, PNC, TD Bank, and BMO, denied services to customers based on political, religious, or social beliefs. After reviewing nearly 100,000 complaints and about 50,000 documents, the OCC found the banks' internal guidelines lacked objective, risk-based criteria and restricted access for sectors like oil and gas exploration, coal mining, firearms and ammunition, detention facilities, and tobacco and e-cigarettes. Meanwhile, Brent crude stayed above $105 per barrel as Houthis kept bombing Saudi Arabian energy facilities.
SPY Performance
SPY opened at $774.92, gapping down well below yesterday's close of $778.05 and, more importantly, below yesterday's critical low of $775.95. That's the level we flagged as the most important line on the chart, and the market blew right through it before the opening bell even rang. Bulls tried to mount a comeback early, pushing SPY to a session high of $776.30, which got it back above $775.95 for a moment. But that bounce stalled out short of the $776.61 level, and once it failed, sellers took full control. SPY slid steadily throughout the session, carving out a low of $766.71 before finishing at $769.67, closer to the bottom of the day's range than the top.
SPY fell 1.07%, its sharpest drop in some time, and this time the volume backed up the move. Turnover surged to 49.54 million shares, more than double the prior session's activity and right around average. That's a big shift. The recent consolidation played out on thin volume, which made it hard to read conviction on either side. Today, participation came roaring back, and it showed up on the sell side. When a breakout zone fails on rising volume, it tells you this wasn't just a few nervous traders hitting the exits. It was real distribution. Yesterday's long lower wick looked like a successful defense, but today's action erased that story completely. The gap below $775.95 likely triggered a wave of stop-loss orders, and the failed retest near $776.30 gave anyone still holding a second chance to sell. The VIX jumped 10.61% to close at 16.89, a meaningful spike that broke it well clear of the 15 area where it had been sitting comfortably. Yesterday, fear barely budged during the morning dip. Today, traders reached for protection in a hurry, and that shift in sentiment is worth paying attention to. The bigger picture has changed. SPY was holding up inside a tight range with buyers stepping in on every dip, but that pattern broke down decisively. The breakout zone that had been defended for days is now overhead resistance instead of support. On the upside, $775.95 and today's high of $776.30 form the first ceiling, with $776.61 and $777.26 stacked just above. SPY would need to reclaim that entire cluster to repair the damage, and the $778.75 and $779.40 to $779.42 levels now look far away. On the downside, today's low of $766.71 is the key level to watch. A close below it would suggest sellers aren't done and that this is more than a one-day shakeout. If buyers can hold that low and SPY stabilizes, a bounce back toward the broken support zone is possible, but expect sellers to be waiting there. Until SPY proves otherwise, the burden of proof has shifted to the bulls.
Major Indices Performance
The Dow held up best in a session where every major index once again finished in the red, slipping just 0.09%. That's barely a scratch, and it marks a second straight decline after the blue-chip index snapped its three-day winning streak a day earlier. While growth stocks got hammered, old-economy names acted as a shelter, with defensive and value-oriented sectors soaking up money that fled the riskier corners of the market. The tiny loss keeps the rotation-into-value story alive. When the Dow barely budges on a day like this, it tells you investors aren't abandoning stocks entirely. They're just getting pickier about where they hide.
The Nasdaq took a much bigger hit, sliding 1.88% for its third consecutive loss. The mega-cap support that kept the damage contained in prior sessions disappeared, and without its heavyweights holding the line, the tech-heavy index had nothing to cushion the fall. This was a clear risk-off move out of high-multiple growth names, and the sharp gap between the Nasdaq and the Dow shows just how aggressively traders rotated away from tech. The choppy pattern that defined the growth trade has now tilted decisively lower, and buyers will need to show up quickly to keep this from turning into a deeper slide.
The Russell 2000 brought up the rear, tumbling 2.12% for its third straight decline. Small-caps were already the shakiest corner of the market, and this drop confirms that the recent recovery attempt has stalled out completely. With the inflation data now in the rearview and another heavy round of price numbers looming, traders dumped the most rate-sensitive stocks first. The S&P 500 landed in between, dragged lower by tech weakness but cushioned by steadier blue chips. The VIX jumped 10.61% to close at 16.89, a third straight gain and a sharp acceleration that shows nervousness is building fast as traders brace for more macro catalysts.
Notable Stock Movements
Meta went from leader to laggard in a hurry, sliding 3.27% to post the worst showing in the Magnificent Seven. That single session wiped out more than the prior day's 2.63% gain and puts a big dent in the idea that the stock had turned the corner after its four-day losing streak. Two days of follow-through looked encouraging, but today's reversal shows buyers weren't as committed as they seemed, and the stock is right back to proving itself.
The rest of the group didn't offer much cover. It was a mostly red day, with Apple the lone bright spot, finishing up 0.50%. That's a sharp turn from last session's five-winner showing, and it suggests the selling was broad rather than targeted at one or two names. When nearly the entire group moves lower together, it usually points to big money trimming tech exposure across the board, not just reacting to company-specific news. Apple holding green is worth noting, since it often acts as a defensive play within big tech when traders want to stay in the space but reduce risk.
The broader market confirms that tech and growth took the brunt of the damage. The Nasdaq dropped 1.88% and the Russell 2000 fell even harder at 2.12%, while the Dow barely budged with a 0.09% dip. That gap tells the story: investors rotated away from high-growth and small-cap names and leaned toward steadier blue chips. The VIX jumped 10.61% to 16.89, a real spike in fear compared to the quiet hedging of the past few sessions. All eyes now turn to Thursday's 8:30 AM ET data dump, with Core PPI, PPI, Core Retail Sales, and Retail Sales all hitting at once. A soft set of numbers could spark a bounce in beaten-down names like Meta, but another round of hot data could keep the pressure on big tech and drag the Nasdaq further from its highs.
Commodity and Cryptocurrency Updates
Crude oil kept pushing higher, rising 1.06% to close at $95.14. That's yet another fresh high for this run, and buyers clearly aren't backing off even as the broader market took a hit. Crude has rallied well above $70 and far beyond longer-term model expectations, and the geopolitical tensions and supply disruptions driving the move show no signs of easing. With producer price data hitting first thing Thursday morning, energy costs at these levels are going to be front and center. If crude stays this elevated, it will keep feeding inflationary pressure and could seriously complicate the Fed's path on rate policy.
Gold gave up some ground, falling 1.31% to close at $4,122. After the prior session's flat consolidation, sellers finally found some traction and pushed the metal off its recent highs. A pullback like this isn't a red flag on its own, especially after such a strong run, but it does show that the bid isn't unlimited. The long-term drivers are still firmly in place: inflation uncertainty, steady central bank buying, and nonstop geopolitical headlines all continue to support demand. With a heavy slate of inflation and spending data on deck, gold could see another big move, and holding above these levels will be key for bulls hoping to take another shot at the highs.
Bitcoin couldn't hold its bounce, sliding 1.60% to close above $81,762. That move erased most of the prior session's gain and is exactly the kind of failed follow-through that has plagued crypto lately. The risk-off mood across growth stocks didn't help, and Bitcoin traded right in step with the broader selling. Bulls had a chance to string together back-to-back gains and prove momentum was shifting, but they came up short again. Until buyers can put together a sustained run, the broader trend remains under pressure, and a break below recent lows would open the door to more downside.
Treasury Yield Information
The 10-year Treasury yield fell 0.52% today to close at 5.190. That's the third straight pullback and the biggest of the bunch, and it finally does what the last session couldn't. Yields have slipped back below the framework's most important line. Bond buyers stepped up with real conviction this time, and the rate surge has its first genuine crack. Still, a close just under the red zone is a starting point, not a victory lap.
Measured against each threshold, the picture is improving but remains far from comfortable. The 4.5% level where equity valuations start to feel the squeeze is 69 basis points below today's close. The 4.8% mark that usually triggers broader selling is 39 basis points back. The 5% line for serious risk is still cleared by 19 basis points. The big change is that the 10-year now sits 1 basis point below 5.2%, the level where the framework calls for a 20% or greater correction. That's the slimmest of cushions, and one bad session could push yields right back above it.
The strange part is that stocks got hit hard even as rates eased. The Russell 2000 dropped 2.12% and the Nasdaq sank 1.88%, while the Dow barely budged with a 0.09% dip. Normally falling yields would help small caps and growth names the most, but today those were exactly the groups that took the worst beating. That disconnect tells us equities aren't trading on rates alone right now, and investors are still pricing in plenty of risk even with yields backing off. The VIX jumped 10.61% to 16.89, a clear sign that nerves are rising, not settling.
Thursday brings the next test. Core PPI m/m, PPI m/m, Core Retail Sales m/m, and Retail Sales m/m all hit at 8:30 AM ET alongside the Philly Fed Manufacturing Index and Unemployment Claims, and that stack will likely decide whether the 10-year builds on its break below 5.2% or snaps back above it. Soft producer prices and cooling retail spending could extend the bond rally. Hot numbers, especially with energy prices still elevated, could quickly erase today's progress. Fed Chairman Warsh's 11:30 PM ET remarks could also move yields overnight. Holding below 5.2% is the first step, but lasting relief for equities still requires a sustained move under 5%.
Previous Day’s Forecast Analysis
Heading into Wednesday, our AI model projected SPY's maximum range at $772 to $784, with the Call side dominating an expanding band. That setup pointed to trending price action with intermittent chop. The forecast carried a modestly bullish bias, since SPY had settled just above the midpoint of the prior projected range and the Call-heavy band supported that lean. We attached a caution flag, though. VIX had risen 0.66% to 15.31 as traders hedged ahead of the 8:30 AM ET release of CPI m/m, CPI y/y, Core CPI m/m, and Core CPI y/y. Those numbers were expected to drive significant volatility, especially in the first hour. With price coiled in the $776 to $780 range and the band expanding, we flagged that the tight range looked ready to break.
The key levels were clearly defined. $780 was the ceiling bulls needed to clear and hold, with $782 as the next target and $785 and $788 as overhead resistance. On the downside, $776 was the pivot and our preferred dip-buying zone. Below that, support sat at $774, then $772, and $770 marked the bulls' last line of defense, with a break opening the door toward $760. The trading plan called for letting the CPI reaction settle for the first 30 minutes before committing capital. Position sizing stayed at 75-90% of normal, with stops tight at 0.5-0.75% from entry. The primary setup was buying a hold of $776, targeting $780 and then $782, with runners aimed at $784 and stops below $772. Shorts were the secondary play at roughly half size, triggered by a rollover at $780, targeting $776 and $774, with stops above $784. The broader message was that this remained a dip-buying market, with the long-term bull trend intact above $640.
Market Performance vs. Forecast
Wednesday's session delivered the breakout the forecast said was coming, and the level structure mapped the move with precision even as the inflation data pushed price beyond the projected range. The model entered the day expecting the tight coil between $776 and $780 to break, with an expanding band and a high-impact catalyst on deck. That call proved right. SPY fell 1.07% to close at $769.67, ending the recent stretch of quiet, range-bound trading. The model does not account for unpredictable external events, and the market's reaction to Wednesday's CPI m/m, CPI y/y, Core CPI m/m and Core CPI y/y releases introduced volatility that exceeded the model's base case scenario. What stands out is how well the key levels framed the action. The forecast named $776 as the pivot that would decide the session's trend. Price opened at $774.92, already below that pivot, pushed up to a session high of $776.30, stalled right at the level, and then rolled over. The forecast said whichever side won the battle at $776 would likely set the trend for the day, and that is exactly how it played out.
On the falling market side, the playbook laid out the session almost step for step. The forecast said that if $776 gave way, the move was shortable on a failed retest, targeting $774 and then $772. That is the cleanest description of Wednesday's tape. Price retested $776 from below, failed, and both downside targets were hit as sellers took control. The forecast also flagged $770 as the point of last hope for bulls and warned that a break there left little to keep price from sliding toward $760. Price broke through $770, reached a session low of $766.71 and closed below that line, so the runner target framework was in play just as written. Stops on shorts above $784 were never threatened, since the session high stalled at the pivot. The forecast's warning to cover in layers into support was well placed given how quickly price moved through each level.
The rising market scenario was framed as the primary setup, but its trigger required a test that held $776 and bounced. Price never held the pivot, so the setup's confirmation condition never lined up for a full-size entry. The guidance to let the first 30 minutes settle before deploying full capital proved its value, keeping traders from committing to the long side before the tape showed its hand. For any longs that did get involved, stops below $772 did their job, and risk management protocols protected capital as the dip-buying setup failed exactly where the forecast said it would. The forecast also attached a caution flag to the bullish lean, noting that traders were quietly hedging ahead of the inflation numbers, and that early warning proved meaningful.
The VIX rose 10.61% to 16.89, pushing through the 16 trigger that the forecast set for cutting size toward half. That jump confirmed the risk guidance was built for exactly this type of session, with tight stops in the 0.5-0.75% range from entry and reduced position sizing keeping exposure in check as volatility expanded. Volume came in near average, a clear step up from the light participation of recent sessions and a sign that traders were reacting to real information rather than drifting. The $776 pivot, the $772 range floor, the $770 line in the sand and the VIX 16 signal all gave traders clear reference points on a day when the long-awaited catalyst finally arrived. The framework continues to adapt to shifting conditions, and with the bigger picture still healthy above structural support near $640, it gives traders a reliable structure for managing risk and spotting the next dip-buying opportunity as volatility settles.
Premarket Analysis Summary
The premarket analysis, posted before the opening bell, framed the expected move between $771 and $784, with $785 marked as max upside and $770 as max downside just under the bottom of that range. Wednesday opened with spot at $779.38 in a call-dominated tape, firming after two flat sessions and pressing right back into the ceiling. The bias leaned bullish on positioning, but the analysis made clear that a week of capping would end one of two ways: a clean break that runs or a rejection that finally gives back the range. It also warned that a coil under a ceiling this heavy for this long usually resolves sharply. The defining level was $780 for a fourth straight session. It was the gate directly above and the heaviest concentration on the board. Above it, $781 was the first target where price might stall, $782 was the next decision point, $784 capped the expected move, and $785 stood as max upside. On the downside, $778 was the first level to watch as the floor of the last three closes, where a clean loss would mean the rejection was on. Below that, $776 was where the tape would begin to come apart and the heaviest support, $773 was the point of last hope, and $770 was max downside as a major round number and last week's ceiling turned floor.
The coil finally resolved, and it broke to the downside in exactly the sharp fashion the analysis warned about. SPY gapped open at $774.92, already through both $778 and $776, so the rejection was on before the first trade. Buyers managed a bounce to a high of $776.30, briefly poking back above $776, but they couldn't come close to reclaiming $778. That left $780 and everything above it out of play. From there the tape came apart just as described. Sellers blew through $773, sliced past the bottom of the expected move, and broke the $770 max downside on the way to a low of $766.71. SPY closed at $769.67, down 1.07%, on 49.54M shares of near-average volume, finishing just under the $770 floor. The VIX jumped 10.61% to 16.89, confirming that fear finally returned after days of calm. With last week's ceiling-turned-floor now broken on a closing basis, bulls need to reclaim $770 and then $773 quickly. Otherwise, the range breakdown has room to extend.
Validation of the Analysis
Wednesday delivered the resolution the premarket notes had been building toward all week. The analysis framed $780 as the defining level "for a fourth straight session" and warned that "a week of capping ends one of two ways, a clean break that runs or a rejection that finally gives back the range." It closed with a clear call: "a coil under a ceiling this heavy for this long usually resolves sharply when it goes." The coil resolved sharply to the downside. SPY opened at $774.92, already beneath $778, which the notes called "the floor of the last three closes" and the spot where "losing it cleanly means the rejection is on." It also opened below $776, the level flagged as "where the tape begins to come apart." The rejection was confirmed before the first trade. With $780 never challenged, $781, $782, $784, and the $785 max upside stayed out of play, exactly as the map called for once the downside path took over.
From there, the downside levels told the story. The notes said "lose 776 and expect a quick trip to 773," and the session's only real bounce proved the point. Buyers pushed SPY up to a high of $776.30 and stalled right at that line. The level described as "the heaviest support below" had flipped into overhead resistance, and sellers took control again. The next stop was $773, labeled "our point of last hope where buyers should step in." It failed, which according to the notes "opens 770 as our max downside," a level described as "a major round number just under the bottom of the expected move." SPY reached it, overshot to a low of $766.71, and closed at $769.67, down 1.07% and pinned right at that max downside marker. The notes also said a break would push price outside the projected 771 to 784 expected move, and that is what happened. The sharp move produced a range of more than nine points, well beyond the six-point move priced in. The VIX rose 10.61% to 16.89, a jump in fear that confirmed this was the real breakdown and not another quiet drift.
Traders following the levels had a clean playbook. The gap below $778 and $776 removed any reason to stay long while waiting for a fourth test of $780. The failed retest of $776 was the best short entry of the day. It came with a defined risk point just above the session high, and the notes had already named $773 as the next target. When $773 gave way, the analysis pointed directly to $770 as the next profit-taking zone, and price delivered. The framework was just as useful for what it told traders to avoid. With $780 never in reach, there was no reason to chase upside toward $782 or $785. With $773 failing, there was no reason to fight the tape by buying "last hope" support after it broke. The confirmed rejection, the stall at $776, the failure of $773, and the close at $770 all lined up with the levels laid out before the bell. The notes called this outcome days in advance, and with last week's ceiling now being retested as a floor, the map is set for what comes next.
Looking Ahead
Thursday brings a packed morning, with a wave of high-impact data all hitting at 8:30 AM ET. October's PPI report leads the way, with both headline PPI and Core PPI month-over-month landing alongside Retail Sales and Core Retail Sales month-over-month. PPI tracks what producers are paying, so it often signals where consumer prices are headed next. Coming right on the heels of today's CPI release, it will either confirm or challenge the inflation story traders just digested. Retail Sales covers the other half of the picture by showing whether the American consumer is still spending. Strong spending paired with sticky producer prices would make it harder for the Fed to justify easing, while softer numbers on both fronts could revive hopes for a friendlier policy path. Unemployment Claims and the Philly Fed Manufacturing Index also drop at 8:30 AM ET. Both are medium-impact releases, but they add useful color on the labor market and factory activity.
With this many numbers crossing the wires at once, expect choppy premarket action as traders sort through mixed signals. One report may run hot while another comes in cool, which can produce whipsaw moves that reverse quickly. Give the market time to settle on a direction before acting, and focus on whether the inflation and spending data point the same way. Fed Chairman Warsh also speaks at 11:30 PM ET, well after the closing bell. Any comments on how the Fed views this week's inflation and consumer data could move futures overnight and set the tone for Friday's open. Keep position sizes manageable, stick to your levels, and avoid getting caught on the wrong side of a late-night headline.
Market Sentiment and Key Levels
Wednesday handed the bears a clear win, and the way it unfolded matters as much as the loss itself. Buyers showed up early, but they could not hold their ground, and sellers pressed SPY lower for most of the session before a modest bounce into the close. The broader tape confirmed the risk-off mood. The Nasdaq fell 1.88% and the Russell 2000 dropped 2.12%, while the Dow barely flinched at -0.09%. When growth and small caps get hit that hard while the blue chips hold steady, it signals a rotation away from risk rather than a broad-based panic. Mega-cap tech failed to provide the cushion it offered a day earlier, and Bitcoin's 1.60% slide showed that speculative appetite cooled off right alongside equities. Traders rushed to buy protection, too. The VIX jumped 10.61% to 16.89, a sharp move that reflects both the intraday reversal and the loaded data slate on deck. The edge belongs to the bears for now, though the long-term trend has not been damaged.
SPY finished right up against the top of the $766 to $770 range that has defined recent trading, which puts $770 squarely in focus as resistance. A push through it opens the door to $772, with $775 and $778 in play if buyers regain control. On the downside, $766 is the first line of support. Losing it targets $764, followed by $762 and $760. If $760 gives way, there is little to keep price from falling toward $750. The bigger picture still favors the bulls, with the long-term trend firmly intact well above structural support at $640, so this remains a broader dip-buying environment as long as key levels hold. Thursday's projected maximum range runs from $761 to $775, with the Put side dominating in an expanding band that points to trending price action mixed with intermittent chop. The real test hits at 8:30 AM ET when Core PPI m/m, PPI m/m, Core Retail Sales m/m, and Retail Sales m/m all drop alongside the Philly Fed Manufacturing Index and Unemployment Claims. That stack is likely to produce significant volatility, especially in the first hour. Hot wholesale inflation paired with firm energy prices would add fuel to the selling, while softer numbers could spark a relief bounce. Fed Chairman Warsh speaks at 11:30 PM ET, well after the bell, making his remarks the wildcard heading into Friday. We favor shorting rallies near $770 rather than chasing weakness into support. Let the opening reaction settle, keep stops disciplined above $772, and make the bulls prove they can reclaim $770 before changing course.
Expected Price Action
Thursday's session brings actionable intelligence generated by our AI model, which projects SPY's maximum range at $761 to $775. With the Put side dominating in an expanding band, the model is calling for trending price action with intermittent chop. The calendar is loaded again. Core PPI m/m, PPI m/m, Core Retail Sales m/m, and Retail Sales m/m all hit at 8:30 AM ET alongside the Philly Fed Manufacturing Index and Unemployment Claims, a stack that is likely to produce significant volatility, particularly in the first hour of trading. Fed Chairman Warsh speaks at 11:30 PM ET, well after the closing bell, so his remarks are more of a wildcard for Friday than a factor during Thursday's session. Wednesday's inflation reaction turned into a clean rejection from the highs, with sellers taking control after the early push failed. SPY settled slightly above the midpoint of the projected range, which gives us a modestly bullish bias by position heading into Thursday. That lean comes with a big asterisk, though. The Put-heavy band says sellers hold the upper hand, and VIX rose 10.61% to 16.89, a sharp jump that shows traders are reaching for protection after the reversal. Price is still working inside the $766 to $770 range that has defined recent trading, and with an expanding band and another round of high-impact data on deck, a decisive move out of this zone looks likely.
The first test for Thursday is $770, sitting right overhead at the top of the recent range. In a Put-dominated tape, this is exactly where we favor shorting rallies. If buyers can push through and hold it, SPY targets $772 next, with $775 at the top of the projected range and $778 standing as the final overhead resistance where any squeeze should run into heavy supply. On the downside, $766 is the pivot, and a clean break there likely sends price toward $764, followed by $762. Below that, $760 is the lowest support and the point of last hope for bulls. If $760 gives way, there is little to keep price from falling toward $750. The bigger picture remains healthy, with SPY trading well above structural support near $640 and the long-term bull trend intact, so this is still a dip-buying market on a broader timeframe. In the short run, the playbook is straightforward. Let the opening reaction to the PPI and retail sales numbers settle before committing, since the first hour could whipsaw hard in both directions. Rallies that stall near $770 are selling opportunities, while a firm hold above $770 would neutralize the bearish tilt and open a run at $772. A failure at $766 could mean a quick trip to $764, and with the Put side in control, breakdowns below support are more likely to accelerate than to get bought. Whichever side wins the battle at $766 or $770 likely sets the trend for the session.
Trading Strategy
The VIX rose 10.61% to 16.89, a sharp jump that pushed fear firmly above the 16 line after today's reversal off the early highs. That's a clear signal to cut size toward half of normal and keep stops in the 0.5-0.75% range from entry. Thursday's 8:30 AM ET stack of Core PPI m/m, PPI m/m, Core Retail Sales m/m, and Retail Sales m/m, plus the Philly Fed Manufacturing Index and Unemployment Claims, will likely produce a wild first hour. Don't trade the opening spike. Let the first 30 minutes shake out and wait for price to confirm direction. Warsh speaks at 11:30 PM ET, well after the bell, so avoid carrying oversized positions into Friday.
In a falling market scenario, shorting rallies near $770 is our preferred setup with the Put side dominating an expanding band. A push into $770 that stalls and rolls over is the primary short trigger, especially if the VIX keeps climbing while price fails to break through. The first profit target is $766, with $764 next if sellers break first support. Runners can aim for $762 and then $760, near the bottom of the projected range. If $760 gives way, $750 comes into play, but treat that as a stretch target for a strong trend day after hot data. Stops on shorts belong above $772, and aggressive traders can give it room above $775 at the top of the projected range. If a data headline knifes price below $766 early, don't chase. Short a failed retest of $766 from underneath instead. With puts in control, bear-side size can lead.
In a rising market scenario, longs are the secondary setup and should be traded lighter. A flush into $762 that holds and bounces is the cleanest long trigger, particularly if the VIX fades while price stabilizes. The initial profit target is $766, with $770 in play if buyers reclaim the top of the range. Stops on longs belong below $760, because losing that level opens a fast slide toward $750. If bulls clear $770 with conviction, buy a clean retest of $770 as support, targeting $772 and then $775. Keep bull-side size at roughly half the bear side and take profits in layers into resistance. The long-term bull trend remains intact above $640, so dip-buyers may step in, but for now the burden of proof is on the bulls.
Model’s Projected Range
SPY's projected maximum range for Thursday is $761 to $775, with the Put side dominating in an expanding band that suggests trending price action with intermittent chop. Thursday, October 15 brings a heavy 8:30 AM ET data dump, with Core PPI m/m, PPI m/m, Core Retail Sales m/m, and Retail Sales m/m all hitting alongside the medium-impact Philly Fed Manufacturing Index and Unemployment Claims, a stack that is likely to produce significant volatility particularly in the first hour of trading, while Fed Chairman Warsh speaks at 11:30 PM ET, well after the closing bell. SPY closed at $769.67, down 1.07%, after opening at $774.92, tagging a high of $776.30 early, and then sliding to a low of $766.71 before bouncing modestly into the close. SPY remains in the $766 to $770 range that has defined recent trading, and Warsh's late-night remarks are the macro wildcard that could set the tone heading into Friday. If SPY can push through $770, it opens the door to $772, but a break below $766 targets $764, and if $760 gives way there is little to keep price from falling toward $750. The long-term bull trend remains intact above $640 with SPY well above structural support. As long as price holds above key structural levels, this remains a broader dip-buying environment. Absent a catalyst, resistance sits at $770, $772, $775, $778, while support rests at $766, $764, $762, $760. With SPY closing right up against the top of the range and the Put side in control, we favor shorting rallies near $770. Bitcoin fell 1.60% but held above $81,762, while the MAG stocks had a mostly red day led lower by Meta down 3.27%, with Apple the lone bright spot, up 0.50%. Sustained weakness across both leadership groups would be required to signal a deeper pullback. The VIX closed at 16.89, up 10.61%, suggesting elevated fear given the sharp intraday reversal and the loaded data slate on deck. SPY pulled back within its broader uptrend channel with structural support near $640.
Market State Indicator (MSI) Forecast
Current Market State Overview:
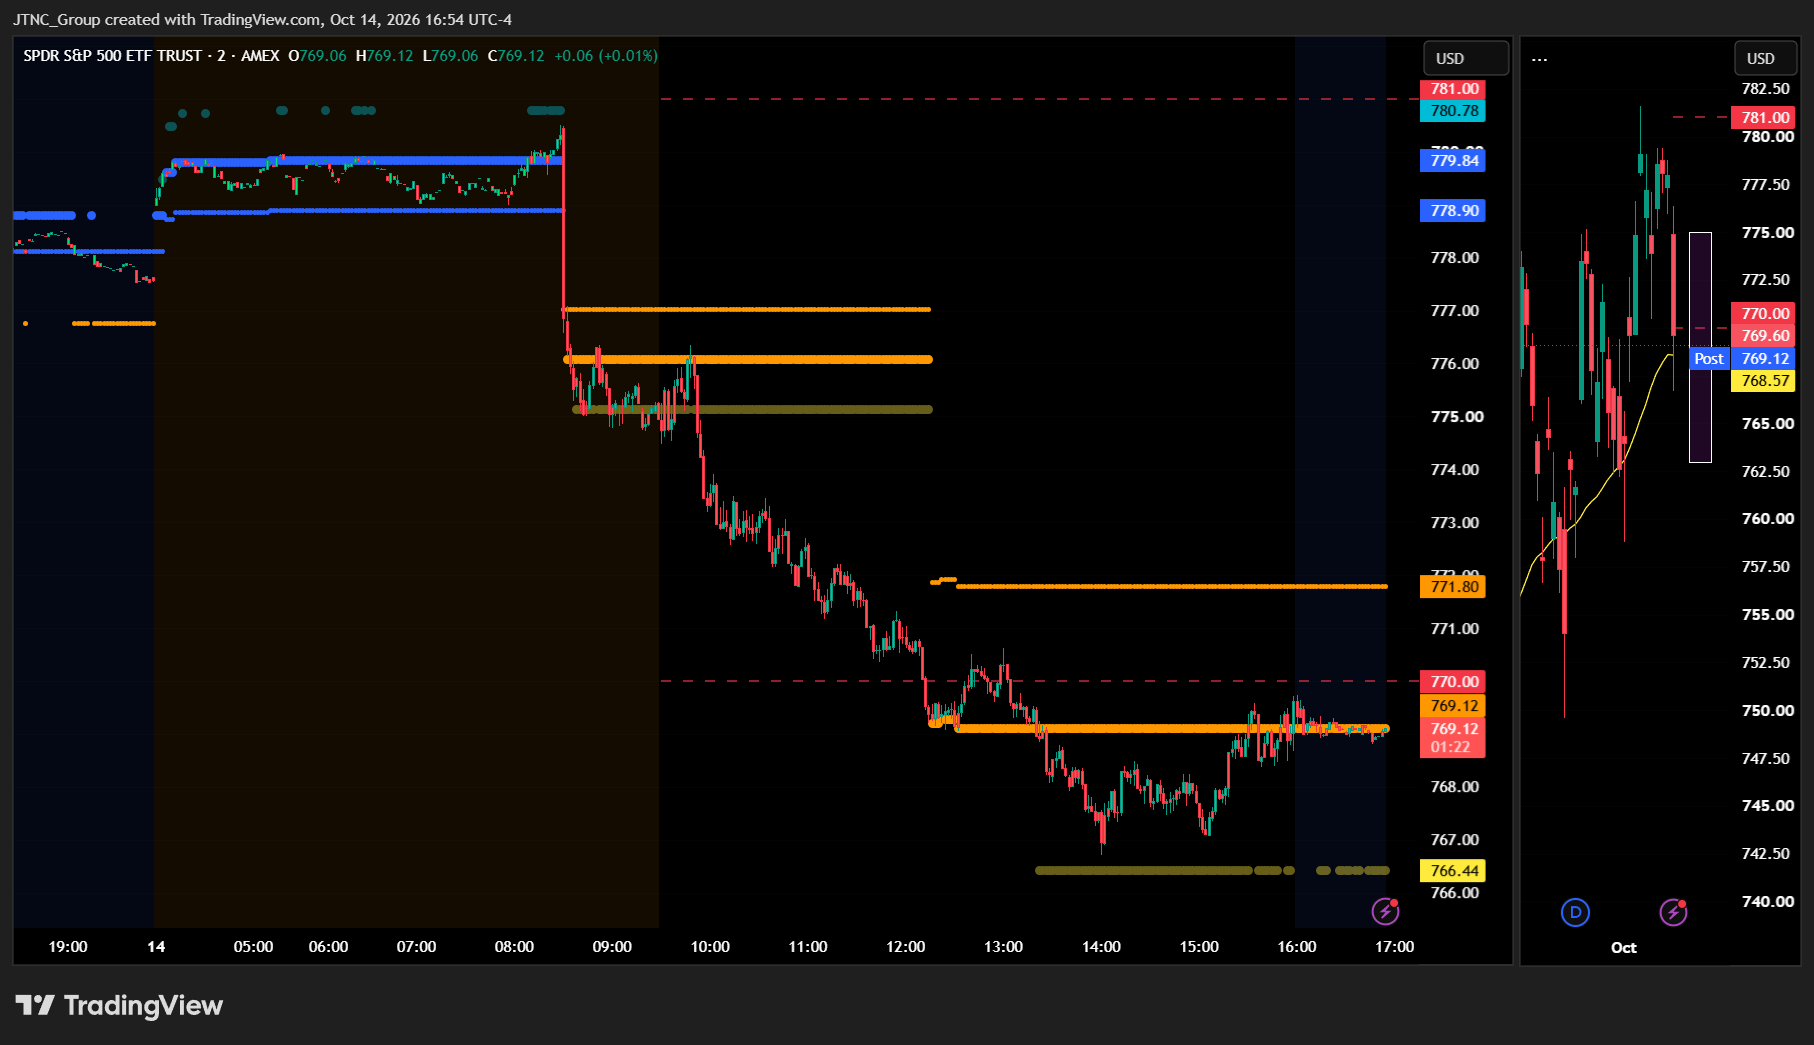
The MSI ended Wednesday in a Bearish Trending Market State with SPY closing at $769.67. That close sits inside the MSI range, so there is no flip. MSI resistance stays resistance at $771.8, and MSI support stays support at $769.12. The MSI rescaled higher overnight. A few extended targets printed below during the overnight session, but by premarket they were printing above the upper MSI line while SPY traded near the highs and the MSI was Bullish Trending. Then the hot CPI report hit and SPY tanked. By the open the MSI had flipped to a narrow Bearish Trending state with extended targets printing below. Extended targets stayed below through the AM session and the PM session, and they were still printing below into the close.
From the premarket high through midday, the MSI rescaled several times lower as sellers took control. At the close the MSI range is a moderate $2.68. That gives price more room to move than Tuesday's tight coil, and the trend has clear direction. For Thursday the MSI is forecasting a strong continuation lower, with the bears maintaining pressure and extended targets below suggesting downside momentum will persist. The 50 DMA held as support Wednesday, but with PPI landing in the premarket, that level may give way if the data runs hot again. MSI support is $769.12 with resistance at $771.8.
Key Levels and Market Movements:
Tuesday we stated, "Bulls want to see overnight price hold above $776.76 and stay near the $778.05 close," and added, "Bears want to see $776.76 fail and press SPY back toward Tuesday's $775.95 low," while also noting, "If that gives way with the MSI rescaling lower and extended targets printing below, $775.76 and $775 major support come into play." The bulls got the first piece. Overnight price held above $776.76, the MSI rescaled higher, and extended targets printed above while SPY traded near the highs. Then CPI came in hot and the floor fell out. By the open the MSI had rescaled lower into a Bearish Trending state, and extended targets were printing below, exactly the bearish setup we laid out.
SPY opened at $774.92, already below the new MSI support near $776.10. That level flipped to resistance for the session. SPY tried to bounce off $775 and rally, but the old support capped the move at a session high of $776.30. A perfectly acceptable trade there was to sell the rally into MSI support-turned-resistance and target the premarket levels below, and that was the first winner of the day. From there SPY sold off steadily and sliced through $775.95, $775.76, and $775 major support just as we flagged.
By midday the MSI rescaled lower again, with resistance at $771.8 and support at $769.12. Extended targets printed below near $766.44 through the PM session. That fresh resistance gave sellers another clean level to lean on, with a target at the new support below. Price ran through $769.12 into the extended target zone and made a session low of $766.71, which was the second trade. The 50 DMA stepped in as support there, and SPY bounced slightly into the close to finish at $769.67. At minimum it was a 2-for-2 session for traders following the framework.
SPY fell 1.07% on volume of 49.54 million shares, which is near average and more than double Tuesday's turnover as traders reacted to the inflation data. The VIX jumped 10.61% to 16.89, a clear sign that fear is creeping back in. It was an easy day to read and execute with substantial setups, all identified through proper context, patience, and flexibility while leveraging the MSI, premarket levels, and market structure rather than forcing trades. The MSI continues to prove its reliability as the cornerstone of our trading process.
Trading Strategy Based on MSI:
Thursday has heavy economic data with Core PPI m/m, PPI m/m, Core Retail Sales m/m, Retail Sales m/m, the Philly Fed Manufacturing Index, and Unemployment Claims all at 8:30 AM ET, plus Fed Chairman Warsh speaking at 11:30 PM ET, which can introduce significant volatility, so traders should be ready to trade what they see rather than predict. The MSI closed Bearish Trending with a moderate $2.68 width and extended targets printing below. That points to a strong continuation lower, with the bears maintaining pressure and downside momentum likely to persist. SPY closed inside the range, so $771.8 remains MSI resistance and $769.12 remains MSI support.
Bulls want to see overnight price hold above $769.12 and stay near the $769.67 close. From there they need to reclaim $771.8 with conviction and push back toward $775 and Wednesday's $776.30 high. A cooler PPI print that comes with the MSI rescaling higher and extended targets flipping above would signal a shift, but until that happens the bulls are playing defense. Bears want to see $769.12 fail and press SPY back toward Wednesday's $766.71 low and the $766.44 extended target area. If a hot PPI print breaks that zone with the MSI rescaling lower and extended targets still printing below, the 50 DMA that held Wednesday may give way and open the door to a deeper slide.
With bears in control, the primary setup for Thursday is selling a rally to $771.8 MSI resistance, targeting $769.12 MSI support. If $769.12 breaks with extended targets still printing below, that level flips to resistance, and traders can sell rallies into it while targeting $766.71 and $766.44. A failed breakdown below $769.12 that quickly reclaims the level offers a long back toward $771.8, but the bias favors shorts until the MSI shifts. If $771.8 breaks with the MSI rescaling higher and extended targets printing above, step aside from shorts and look for longs off the old resistance toward $775.
The long-term bull trend remains intact above $640 and failed breakouts and failed breakdowns continue to offer the highest-probability setups. Remain flexible, avoid trading during Ranging Market States unless a clear failed breakout or breakdown presents itself, and ensure all trades are fully aligned with MSI signals. Providing real-time insights into market control, momentum shifts, and actionable levels, the MSI when integrated with our Pre-Market and Post-Market Reports continues to sharpen execution precision and elevate trade quality. If you haven't yet integrated MSI and our model levels into your process, now is the time. Contact your representative to get started as these tools are designed to support consistency and enhance performance.
Dealer Positioning Analysis
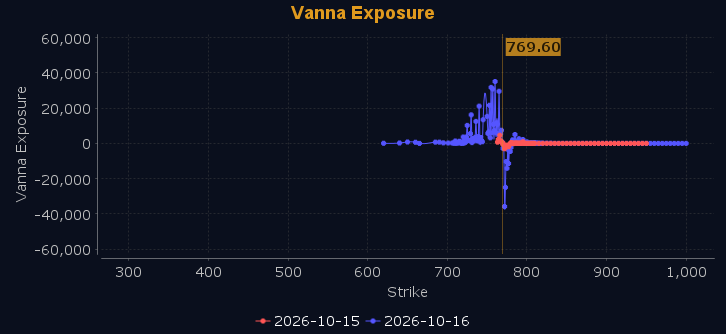
Dealers are selling SPY $780 to $805 and higher strike Calls while buying $770 to $779 Calls, indicating the Dealers' desire to participate in any rally on Thursday. They are buying ATM Calls, looking to take part in any relief rally on Thursday, and their positioning remains unchanged. The ceiling for Thursday appears to be $780. To the downside, Dealers are buying $769 to $700 and lower strike Puts in a 3:1 ratio to the Calls they're selling, displaying continued concern that prices could move lower. Below $770 is bearish and above $777 is bullish, with everything in between being choppy and trap filled. Should SPY fail to move above $770, expect further weakness on Thursday and at least a test of Wednesday's lows. Above $772 the market will attempt to clear $777, where it returns to solidly bullish. This is a tough climb for Thursday, and PPI will likely dictate the day's price action. Gamma is negative, so Dealers are less likely to defend support and resistance levels, which means the market may move through these levels with ease. We continue to favor trades with the trend on Thursday and will restrict mean reversion trade opportunities. Dealer positioning is unchanged at neutral/slightly bullish.
Looking Ahead to Next Friday:
Dealers are selling SPY $781 to $810 and higher strike Calls while buying $770 to $780 Calls, indicating the Dealers' desire to participate in any short squeeze relief rally into Friday. The ceiling for the week appears to be $785. To the downside, Dealers are buying $768 to $700 and lower strike Puts in a 6:1 ratio to the Calls they're selling, displaying serious concern that prices could move lower. They materially increased their hedges on Tuesday, which paid off well on Wednesday, and they continue to be positioned for a sell off should one develop. Below $770 is bearish and above $777 is bullish, with the range in between being choppy and trap filled. There is major support at $765 with major resistance at $772. Gamma is negative, and as such we expect more trending opportunities into the end of the week. For the week Dealer positioning is unchanged at bearish. We advise reviewing Dealer positioning daily for directional clues. These positions evolve quickly and tracking them is essential for staying ahead of shifting market sentiment.
Recommendation for Traders
Short rallies near $770, targeting $766 and $764, with stops above $772. A break under $760 opens the door to $750.
The 8:30 AM ET data dump could whip price early, so keep size light and review the premarket analysis posted before 9 AM ET for any changes in the model's outlook and Dealer Positioning.
Good luck and good trading!
