Market Insights: Friday, October 10th, 2025
Market Overview
Markets dropped sharply on Friday as renewed tariff threats from President Trump reignited fears of an escalating trade war with China, triggering a violent risk-off rotation across asset classes. The S&P 500 plunged 2.70%, the Nasdaq tumbled 3.56%, and the Dow shed 1.90%, marking one of the worst sessions in recent months. The sell-off was sparked by a fiery Truth Social post from Trump, where he accused China of bad faith negotiations, floated canceling an upcoming summit with President Xi, and threatened a “massive increase” in tariffs on Chinese goods. These remarks followed retaliatory measures by Beijing, including new port fees, a fresh antitrust probe into Qualcomm, and a halt on soybean imports.
The sharp move lower came after a week of steadily climbing prices that had pushed major indexes to record levels. Friday’s reversal was swift and relentless, with semiconductor and tech stocks leading the decline. Nvidia, Tesla, and Amazon were hit particularly hard, each dropping more than 5%. The rout mirrored the April 2nd “liberation day” selloff, raising questions about whether this will mark another short-lived dip or the start of a deeper pullback. With official economic releases still frozen due to the ongoing government shutdown, traders had little else to counter the impact of the surprise tariff news. Meanwhile, the University of Michigan’s sentiment report showed continued concern over inflation and the labor market.
With volatility surging and the VIX spiking above 21, investors are reassessing risk amid a backdrop of geopolitical tension, macroeconomic uncertainty, and stretched valuations. Attention now turns to next week’s start of earnings season, where banks will set the tone. Until then, traders are bracing for potential follow-through early next week, as the market searches for a floor and reevaluates the bull trend’s durability under renewed stress.
SPY Performance
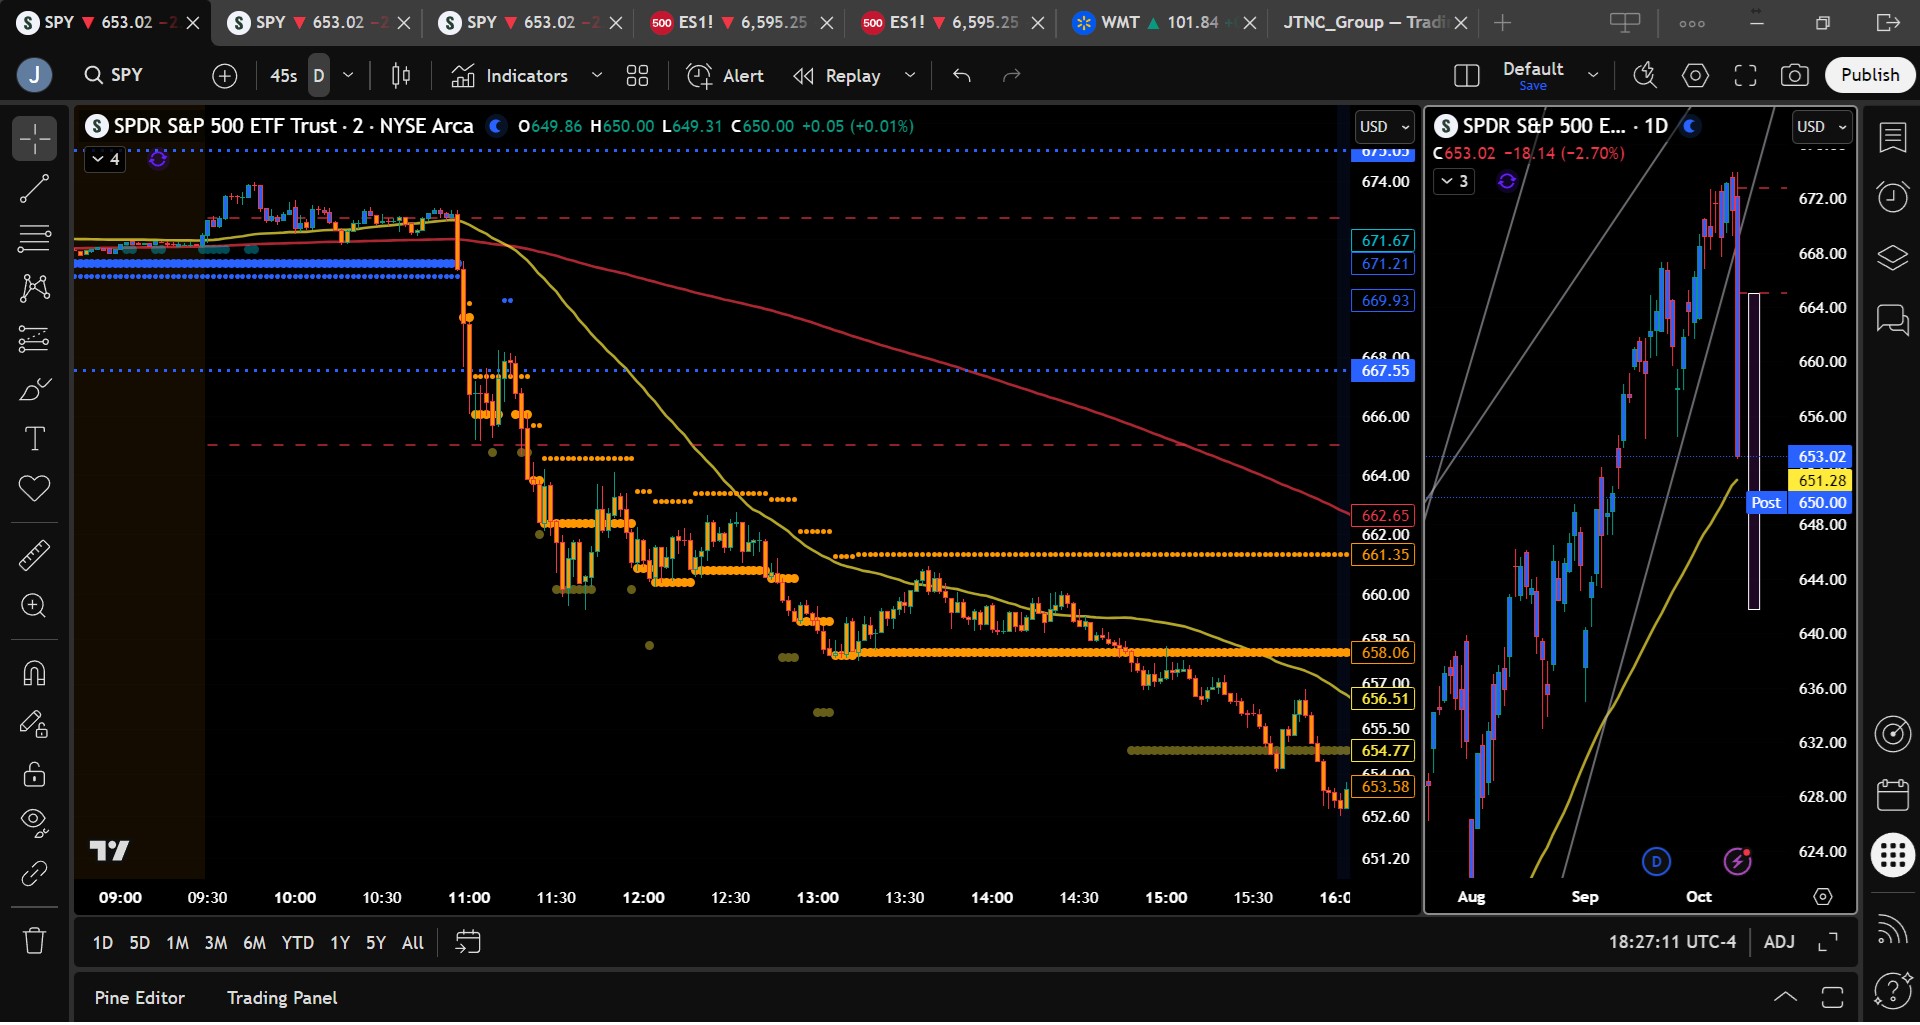
SPY plunged 2.70% to close at $656.02 after opening at $672.13 and trading as high as $673.95 before crashing to an intraday low of $652.84. Volume surged to 144.5 million shares, more than double the average, signaling panic-like selling and forced de-risking. The breakdown through $665 marked the end of the week-long bull consolidation, as price closed well below the key $663 support zone. This was the largest single-day percentage drop in months, reflecting a clear sentiment shift.
Major Indices Performance
The Nasdaq led the market lower, diving 3.56% as tech stocks were hammered. The S&P 500 fell 2.70%, and the Dow declined 1.90%, weighed down by industrials and financials. The Russell 2000 dropped 3.13%, underperforming amid fears of broad economic fallout from a prolonged trade war. Every major index posted a significant red candle, reversing the week’s gains and confirming near-term technical damage. Sector performance was red across the board, with no safe havens.
Notable Stock Movements
All Magnificent Seven stocks ended in the red, with Nvidia, Tesla, and Amazon each down more than 5%, leading the tech rout. Apple, Alphabet, and Microsoft also declined, while Meta and Netflix followed the broader market lower. Qualcomm sold off sharply on reports of a Chinese antitrust investigation. Gold miners bucked the trend as gold rallied, but most equities saw heavy liquidation. Semiconductors, cloud software, and EV names were hit hardest, while even defensive sectors offered little shelter.
Commodity and Cryptocurrency Updates
Crude oil fell 5.20% to $58.31, breaking below the $60 level our model had forecasted for months. With oil now below this threshold, the door is open for a further decline toward $50, especially if economic sentiment continues to sour. Gold rose 1.56% to close at $4,037 as investors sought safety. Bitcoin plunged 6.98% to finish below $113,000, continuing its volatile streak and reflecting broader risk-off sentiment. Ethereum also fell and is now below the critical $4,300 level.
Treasury Yield Information
The 10-year Treasury yield dropped 2.84% to close at 4.034%, as bond markets rallied on risk aversion and flight to safety. Yields remain in a neutral zone, but the sharp decline on Friday is a warning sign that macro fears are returning. If yields begin to trend higher again and surpass 4.5%, equities could face further pressure. A move above 5% would confirm a full macro-driven reset, potentially causing a correction of 20% or more.
Previous Day’s Forecast Analysis
Thursday’s forecast called for resistance near $675 and support at $667.50 and $665, with bias above $672 suggesting upside continuation unless price fell below $670.75. The roadmap noted low odds of a breakout and advised smaller profit targets due to expected chop. However, the tariff-driven drop was not anticipated, and the rapid downside broke every level, invalidating the initial expectation of limited expansion.
Market Performance vs. Forecast
SPY opened near forecast levels but quickly reversed, invalidating the upside structure. The drop below $670.75 triggered downside acceleration through each target. Price blew past all major support zones, closing at $656.02, well below the forecasted lower bound. The roadmap levels failed to hold in the face of the unexpected macro shock, demonstrating that even precise technical forecasts must yield to headline-driven risk events.
Premarket Analysis Summary
The 7:58 AM note projected a bullish lean above $672, targeting $672.75 and $675, while warning of pressure below $670.75. It highlighted a risk-off dynamic beneath the surface and recommended caution. While the initial forecast aligned with early strength, the premarket also noted the possibility of downside pressure should $670.75 break. The collapse that followed confirms the utility of the roadmap’s conditional logic, though the size of the move was beyond normal expectations.
Validation of the Analysis
Friday’s move validates the risk-aware tone of the roadmap, which warned against over-aggression and favored quick profits. The loss of $670.75 was flagged as a downside trigger, and while the extent of the drop was surprising, the structure aligned with that breakdown. Despite the failed bullish bias, traders who followed the key levels and honored the stop conditions were able to adapt quickly. Once below $667.50, price cascaded through each support zone, as the macro narrative took over.
Looking Ahead
SPY’s close at $656.02 represents a technical breakdown, though it remains above the $640 line that defines the broader bull trend. Monday is a bank holiday, so Tuesday will bring the first real chance at follow-through or reversal. With earnings season beginning and CPI data due midweek, traders will be watching for stabilization. For bulls to regain control, SPY must reclaim $660 and ideally $663. Below $660, all bounces should be treated as shorting opportunities.
Market Sentiment and Key Levels
SPY sits precariously at $653.02, well below recent support but still above the critical $640 threshold. Resistance lies at $656, $658, $660, and $661, while support levels are $651, $650, and $645. A break below $651 could invite additional selling. Bears are now in control near-term, but with sentiment stretched, an oversold bounce is possible. Still, bulls must reclaim $663 to reset the structure.
Expected Price Action
SPY’s projected range for Monday is $645 to $663, with downside momentum likely to persist early before any bounce attempt. No major economic data is scheduled, but upcoming earnings could begin to reshape expectations. A break below $651 opens room to test $645 or lower. Resistance at $660 and above is expected to cap bounces. Price must reclaim $663 to reestablish bullish dominance. Traders should anticipate whipsaw price action with expanding volatility.
Trading Strategy
The priority now is capital protection. Traders should remain cautious on long exposure, fading rallies toward $660–$663 and targeting support levels at $651 and $645. If SPY rebounds above $663, the bull case returns, but until then, treat each bounce as a selling opportunity. Avoid chasing breakdowns and instead focus on failed rallies. The VIX surged 31.65% to 21.63, confirming rising fear and validating prior guidance to hedge long exposure. Avoid overnight risk and maintain flexibility.
Model’s Projected Range
SPY’s projected maximum range for Monday sits between $641.75 and $665, with the Put side dominating in an expanding band that suggests trending price action interlaced with periods of chop. There is no scheduled economic data, but earnings from major banks kick off next week and could help shape market direction. Today, however, it was tariff news out of the White House that rattled investors, much like last April, when markets saw their worst day since the famed “liberation day.” Drops of 2% or more are rare, so be careful about reading too deeply into a single session. The key question now is whether the market will repeat the relatively short-lived April 2nd to April 7th dip that gave way to a furious rally, or whether this will resemble the February 21st to April 7th decline that saw a 21% drawdown. Time will tell, but now is the time to trade what you see. If you are not fully hedged as we’ve been suggesting for months, you are late to the party. Our general expectation for Monday is follow-through selling early before the market finds a base and attempts a recovery. With price still above the $640 “line in the sand” for the bulls, they remain in the game and will do all they can to defend that level if tested next week. For the bulls to regain control, price must reclaim $660. Below that level, every bounce should be viewed as a shorting opportunity since the bears now hold near-term control. That said, chasing a market that has already fallen nearly 3% in one day is risky. Instead, we favor fading rallies up to as high as $660. Above $660, the bulls can begin to retake the reins, and a move above $663 would restore their complete control. SPY would need to close below $640 for the broader bull trend to break, and with Friday’s close still above that level, it’s not yet a one-sided bear market. Macro risks remain elevated between the ongoing government shutdown and renewed tariff talk, so continue to trade the market in front of you, not the one you expect. For weeks we’ve said that until meaningful weakness emerges, the trend remains higher. Now, that weakness has arrived, with crypto selling off and all Mag stocks declining. If this persists, it could finally trigger the 10–15% correction we’ve been forecasting. However, this could just as easily prove to be a one- or two-day event. Stay flexible and focus on real-time signals. The 50-day moving average sits at $651 and is a logical level to test before any meaningful recovery. For Monday, resistance sits at $656, $658, $660, and $661, with support at $651, $650, and $645. Above $660 there is strong resistance likely to cap gains, while below $651 there is little structural support to prevent further decline. Since reclaiming $585, SPY had maintained a steady uptrend fueled by dip buyers, until today. Mag stocks and crypto all fell, with ETH breaking below $4300, raising concerns of a broader risk-off rotation if ETH remains below that level alongside ongoing weakness in Mag leaders. For Monday, we will continue trading with the prevailing trend and fading rallies up to $660. The VIX spiked 31.65% to 21.63, confirming market stress. For weeks we’ve advised adding protection to long portfolios, as VIX below 23 supports the bullish case, but a breakout above it could finally trigger the long-anticipated correction. SPY closed well below the redrawn lower bull trend channel from the April lows, implying the early stages of a potential bear trend. The model has not yet redrawn this channel as one day does not make a trend. But several consecutive closes below the bull channel would confirm the formation of a new bear channel.
Market State Indicator (MSI) Forecast
Current Market State Overview:
The MSI ended the day in a narrow Bullish Trending Market State, with SPY closing well below MSI support turned resistance. There were extended targets printing below at the close and for most of the day session. The MSI opened the day in a very narrow bullish state but as price reached a new high, it fell sharply and continued falling blowing past every major support level along the way. The MSI rescaled lower several times with extended targets which highlighted the herd working to push price to lows not seen since September 10th. For Monday the MSI is implying more follow-through to today’s decline with $651 and the 50 DMA as a likely support level which may entice the bulls back to the market. MSI resistance is $658.06 and higher at $661.35.
Key Levels and Market Movements:
On Thursday we wrote, “watch the MSI for clues and trade what you see, given the external risks currently facing the market,” and noted, “Absent a catalyst, it is likely the market attempts to reverse today’s decline and recover some of the lost ground,” while also stating, “We expect more two-way trading as we continue to buy dips at major support or short weakness at or near $674 on failed breakouts.” With this context, and with the MSI holding in a narrow bullish range overnight and at the open near all-time highs once again, we looked for a failed breakout to get short. A textbook setup came at $673.85, and with no extended targets above, we entered short targeting MSI support at $671.24 for T1. The market chopped sideways for a bit until unexpected news of new tariffs on China hit the wires, sending prices tumbling sharply. Once the MSI rescaled lower, we set T2 at $666.00, which was hit by 11 am. With two targets secured and a stop moved to breakeven, we had little to do but trail the remainder. While we considered reloading the short, it was Friday, and with a big winner already booked, we opted for profit protection mode instead. Price continued to fall throughout the afternoon, every bounce being sold, and with massive profits in the bank, we held our remaining 10% runner into the close, exiting at $653.50. It was a huge trade to close out an extremely profitable week once again the result of a clear plan, disciplined execution, and strong alignment between MSI signals, our broader market model, and key technical levels. The MSI continues to be a cornerstone of our consistent trading process.
Trading Strategy Based on MSI:
Monday has no economic news, but with markets on edge following today’s tariff announcement, it’s critical to trade what you see. It is highly probable the market will at least test the 50 DMA at $651 before attempting any meaningful recovery, and we do believe such a recovery effort will come. However, rallies up to $660 should be viewed as opportunities to get short—unless a new external catalyst shifts sentiment. As such, remain flexible and watch the MSI closely for clues about the next directional move. Avoid fading extended targets. The market’s projected range for Monday is wide, so aligning with the MSI trend and riding it remains the best approach to capture gains. Failed breakouts and failed breakdowns are particularly valuable setups in this type of environment. Overnight, the bulls want to defend the 50 DMA at $651, and if it holds, the market will likely attempt a recovery. Should this level fail, $645 and even $640 come into play, with $640 serving as the critical line that must hold to preserve the broader bull trend. A break above $660 would likely lead to a test of $663, where the bulls could regain full control. Remember, the bears take charge on a drop below $640—and as always, failed moves remain among the highest-probability setups. Stay nimble, avoid trades during Ranging Market States, and ensure full alignment with MSI. Providing real-time insights into market control, momentum shifts, and actionable levels, the MSI when integrated with our Pre-Market and Post-Market Reports continues to sharpen execution precision and elevate trade quality. If you haven’t yet integrated MSI and our model levels into your process, now is the time. Contact your representative to get started as these tools are designed to support consistency and enhance performance.
Dealer Positioning Analysis
Summary of Current Dealer Positioning:
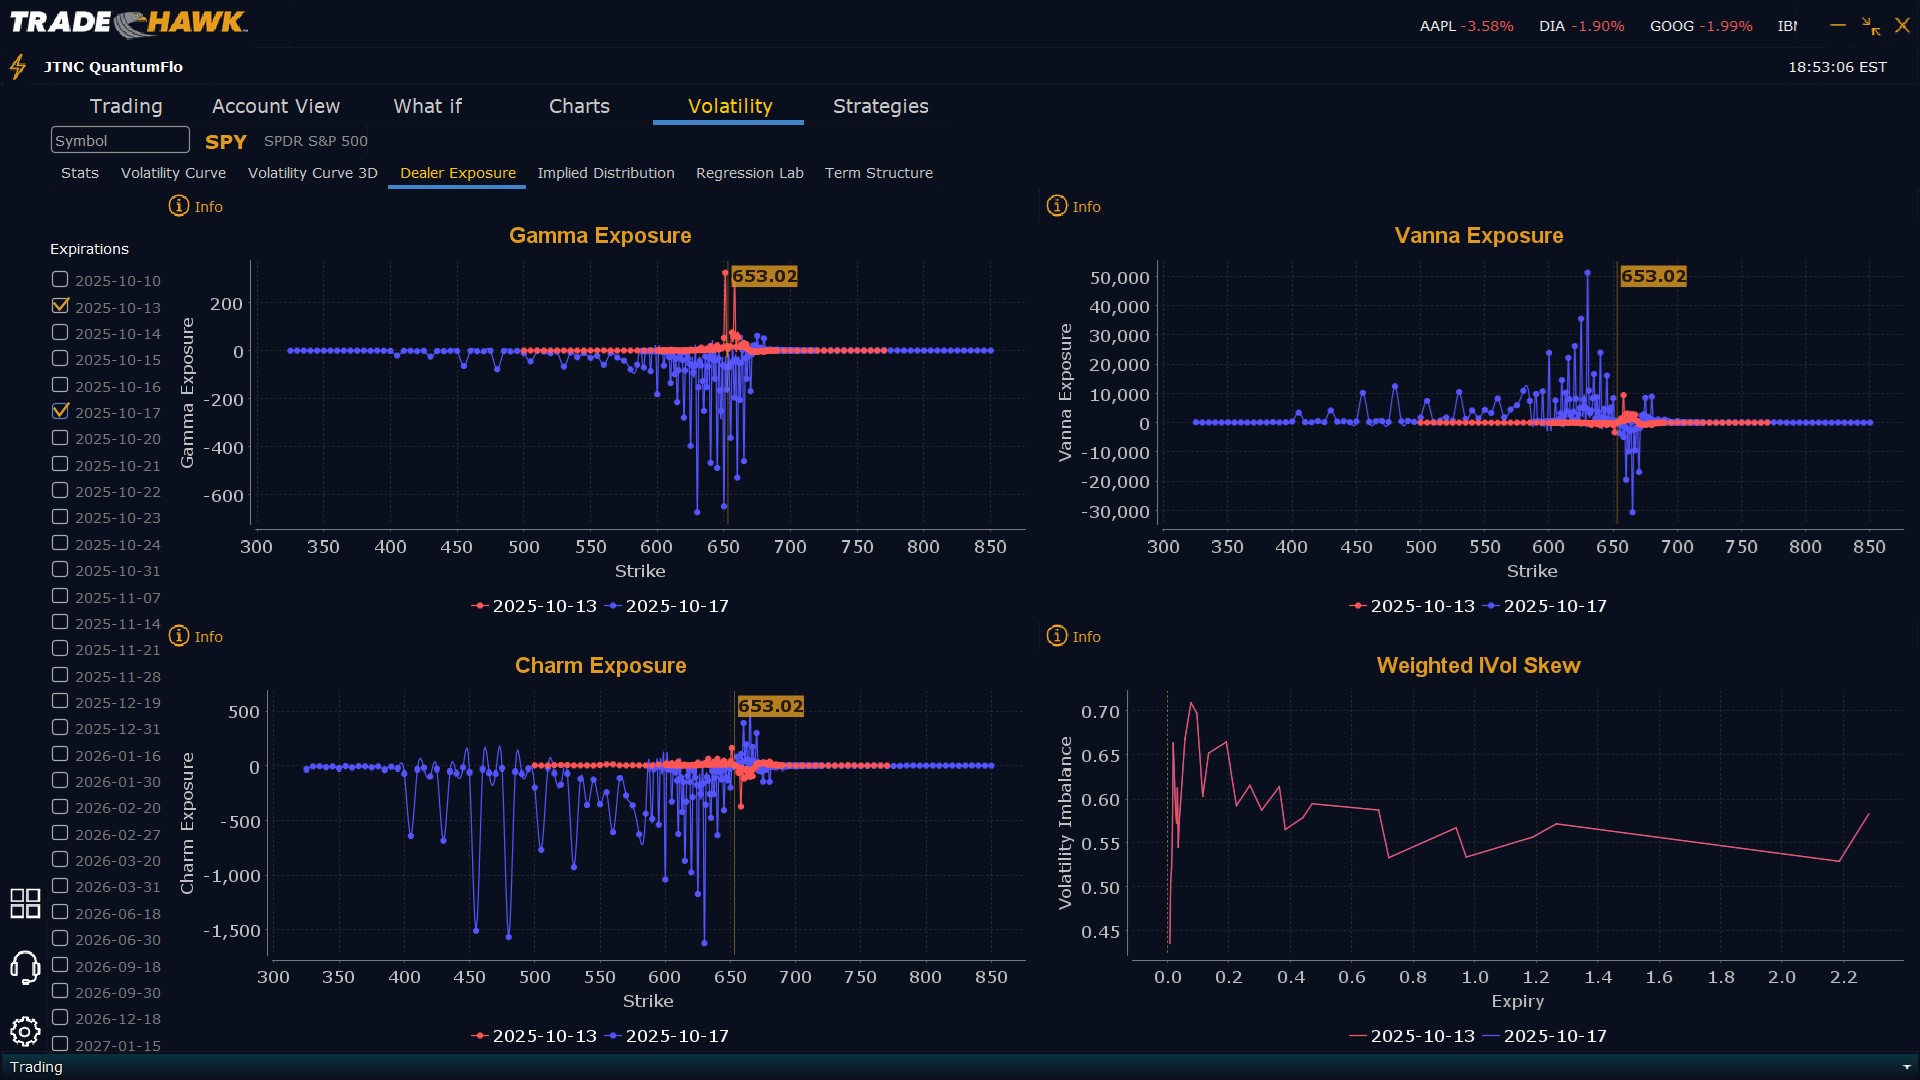
Dealers are selling SPY $654 to $690 and higher strike Calls while also selling $651 Puts implying the Dealers’ belief that the market may trade near the current levels but not decline further than $651 on Monday. Dealers only sell near or ATM Puts when they believe prices will rise. The ceiling for Monday appears to be $658. To the downside, Dealers are buying $653 to $600 and lower strike Puts in a 3:1 ratio to the Calls/Puts they’re selling/buying displaying a bit less concern that prices could move lower on Monday. Dealer positioning is unchanged from bearish to bearish although slightly less so.
Looking Ahead to Next Friday:
Dealers are selling SPY $669 to $690 and higher strike Calls while also buying in size $654 to $668 Calls indicating the Dealers’ desire to participate in any relief rally next week. The ceiling for the week appears to be $675. To the downside, Dealers are buying $653 to $540 and lower strike Puts in a 5:1 ratio to the Calls they’re selling/buying, reflecting a bearish outlook for the week. For the week Dealer positioning is unchanged from bearish to bearish. We advise reviewing Dealer positioning daily for directional clues. These positions evolve quickly and tracking them is essential for staying ahead of shifting market sentiment.
Recommendation for Traders
SPY’s trend has cracked but not yet broken. Price remains above $640, the ultimate line for bulls. However, below $660, sellers are in control. Focus on trading failed rallies and respecting downside momentum. Avoid hero trades. The VIX spike confirms risk has returned. Remain nimble, guard capital, and trade with the roadmap, MSI, and model levels fully aligned.
Good luck and good trading!
