
Market Insights: Tuesday, September 29th, 2026
Market Overview
Stocks wobbled Tuesday but managed to close off their session lows as the bond market kept everyone on edge. The Dow fell 0.2%, trimming bigger losses from earlier in the day, while the S&P 500 dipped 0.1% and the Nasdaq finished little changed. The 30-year Treasury yield climbed as high as 5.62%, its highest level since 2002, and mortgage rates are now closing in on 7.6%. Those bond jitters haven't hit stocks hard yet, but Wall Street is watching closely for any further climb. Oil stayed elevated on geopolitical tensions but actually slipped on the day as Saudi Arabia resumed exports through its East-West pipeline and US and Iranian officials met with mediators to restart their choppy talks. Brent crude hovered near $96 per barrel and WTI traded at $91. The economic data wasn't pretty either. Consumer confidence sank to its lowest level since 2014, and job openings fell to 7.097 million in August, missing expectations of 7.228 million and the prior month's revised 7.335 million. Under the surface of this long-running "low hire, low fire" market, though, Indeed found that annual growth in job postings has turned positive for the first time since 2022. "Our data shows hiring intentions rising slightly, but it's unclear if those intentions will turn to action," said Indeed senior economist Cory Stahle. That sets up an important jobs report on Friday.
The AI trade stayed front and center after Reuters detailed a leaked Anthropic IPO prospectus showing the lab is targeting a $2 trillion valuation while warning that AI could pose "existential risks to humanity." Anthropic hasn't made an official filing public yet. Rival OpenAI also shelved its frontier model over safety concerns that surfaced during internal testing, and CEO Sam Altman is delivering a keynote at the company's developer event as Meta's Muse agentic model ramps up competition. According to Axios, OpenAI's annual recurring revenue is approaching $70 billion, up more than 70% since the start of the third quarter, while Anthropic said in May that its revenue run rate hit $47 billion, up from $30 billion in April. Much of the AI boom rides on these two going public, with Anthropic expected to launch its IPO this fall and OpenAI early next year. The IPO backdrop isn't getting any friendlier as yields surge, though, as health tech startup Oura shelved its planned debut "due to uncertainty." Micron offers the next big AI litmus test when it reports Wednesday afternoon, and Nike follows Thursday with the bears circling hard. Short interest just hit an all-time high of 87 million shares, according to S3 Partners, up from 55 million over the past year, with the short percentage of float jumping from under 3% to over 7%.
SPY Performance
SPY opened at $766.83, a modest gap higher that briefly suggested buyers wanted to shake off yesterday's weakness. That optimism didn't last long. SPY managed a session high of just $766.95, barely a hair above the open, before sellers stepped in and took control almost immediately. The selling pressure pushed SPY down to a low of $762.35, which took out yesterday's low and marked a fresh short-term bottom. Dip buyers showed some life from there and lifted SPY to a close of $764.30. That finish landed near the middle of the range, but it still gave back the entire opening gap and then some.
SPY slipped 0.17%, a much smaller loss than yesterday's drop but still the second straight down day. Volume came in at 31.16 million shares, below average and lighter than the prior session. That tells you this wasn't aggressive liquidation so much as buyers stepping back and letting prices drift lower. The VIX barely moved, edging up 0.12% to close at 16.09, which shows traders aren't scrambling for more protection but aren't comfortable unwinding it either. That flat volatility reading fits a market caught in wait-and-see mode rather than one bracing for a bigger move. The good news for the bulls is that the dip below yesterday's low found buyers and didn't turn into a flush. The bad news is that a failed opening gap and a new short-term low add another warning sign to the pullback. The bulls need a session with real conviction to prove this is just a pause and not the start of something heavier.
Major Indices Performance
The Nasdaq held up best in another down session, slipping just 0.09%. After taking the hardest hit the prior day, tech-heavy stocks found their footing and nearly finished flat. That's a meaningful change in tone. The aggressive selling that battered growth names one session earlier cooled off, and a couple of mega-cap winners helped balance out a steep drop in one of the market's most widely held names. Buyers weren't exactly charging back in, but the fact that tech didn't extend its losses suggests some bargain hunters are willing to step in when the biggest names get knocked down.
The Dow fell 0.26%, marking a second straight loss after the prior session's pullback. The decline was far milder this time around, but it shows that blue-chip buyers still aren't ready to fully commit to industrials and financials. Pressure in commodity-linked areas didn't help, as sharp drops in energy and precious metals weighed on parts of the market tied to those trades. The S&P 500 also finished modestly lower, with the selling feeling more like a slow grind than a panic-driven rush for the exits.
The Russell 2000 brought up the rear with a 0.41% drop, flipping the script from the prior day when small-caps held up best. The riskier end of the market once again showed it can't build any real momentum, and that's a warning sign worth watching. When small-caps lag on a day when the broader market is only slightly lower, it tells you investors aren't eager to take on extra risk right now. Smaller companies tend to be more sensitive to borrowing costs and economic uncertainty, and traders are clearly keeping them at arm's length until the backdrop improves. The VIX rose 0.12% to close at 16.09, essentially holding steady near the 16 level. That tells you nerves haven't faded, but they haven't escalated either, and the market is stuck in a cautious holding pattern rather than a full-blown retreat.
Notable Stock Movements
Apple took the spotlight today for all the wrong reasons, leading the Magnificent Seven lower with a sharp -2.66% drop. That's a hefty move for a stock usually seen as one of the steadiest names in big tech. When Apple sells off like that, it rattles confidence across the whole sector, because many investors treat it as a core holding they rarely touch. A drop of that size suggests some big money decided to lighten up, and it's worth watching whether the selling carries into the next session.
The broader group finished mostly in the red again, but there was a twist. Meta and Amazon both closed green, and Meta's bounce is the real headline after back-to-back heavy losses. Buyers finally stepped in to catch the falling knife, at least for one day. Amazon's gain adds a second bright spot. Two winners against five losers is still a losing scorecard, but it beats yesterday's lopsided result and shows the selling isn't hitting every mega-cap equally.
This mixed showing matches the market's cautious but not panicked tone. The VIX rose 0.12% to 16.09, which tells you fear didn't really spread even as the biggest names wobbled. Traders seem to be rotating within big tech rather than running from it entirely. Meta's rebound offers some relief, but Apple's slide is a fresh warning that leadership is shaky. Until the Magnificent Seven can move higher together, it's hard to trust this group to power a lasting rally.
Commodity and Cryptocurrency Updates
Crude oil gave back ground today, sliding 3.66% to close at $89.21 and erasing yesterday's modest bounce. Even with the sharp drop, prices remain well above $70, and crude continues to defy longer-term model expectations by a wide margin. The geopolitical tensions and supply disruptions behind this rally are still in play, but today's selling suggests some traders are locking in profits after the big run. The concern hasn't changed. If energy prices stay this elevated for an extended stretch, they'll keep feeding into inflation, and that makes the Fed's job on rate policy much harder.
Gold stayed under pressure today, falling 2.65% to close at $4,207. That's back-to-back rough sessions for the metal, and it's clear the profit-taking wave hasn't fully run its course yet. After such a historic climb, a cooling-off period isn't surprising, but the speed of these drops has caught plenty of traders off guard. Still, the long-term case for gold remains intact. Inflation uncertainty, steady central bank buying, and ongoing geopolitical headlines are still the core forces supporting prices. What matters now is whether dip buyers show up with conviction or whether the metal needs more time to find a floor.
Bitcoin went nowhere today, finishing essentially flat at 0.00% and closing above $83,503. After a string of losses, a quiet session at least gives the bulls a breather, and it's a small positive that crypto didn't get dragged lower alongside the softer tone elsewhere. That said, flat isn't the same as strong. Bitcoin still lacks the momentum to mount a real recovery, and buyers aren't stepping in aggressively. Until a fresh catalyst shows up, crypto looks likely to keep treading water while traders wait for a clearer signal on direction.
Treasury Yield Information
The 10-year Treasury yield pushed higher again today, rising 0.29% to close at 5.260. That makes five straight sessions of upward pressure. The pace cooled considerably from yesterday's sharp jump, but the direction didn't change. Bond buyers still aren't showing up, and the 10-year isn't just testing the framework's final line anymore. It's building a base above it.
Every threshold on the chart is now further behind us. The 4.5% level where equity valuations start feeling the strain sits 76 basis points below today's close. The 4.8% mark that typically sparks broader selling is 46 basis points back. The 5% line for serious risk has been cleared by 26 basis points. Most importantly, the 10-year now sits 6 basis points above 5.2%, the level where the framework calls for a 20% or greater correction. Yesterday's break above that line wasn't a one-day overshoot. Today added to it.
Stocks slipped again, but the reaction was muted compared to yesterday. The standout detail is where the pain landed. Small caps took the biggest hit, which makes sense because smaller companies lean more heavily on borrowing and feel rising rates faster than anyone else. The tech-heavy Nasdaq held up best, a shift from yesterday when growth names led the decline. The VIX rose 0.12% to 16.09, which is barely a blip. That's what should worry investors. Yields are living in the framework's most dangerous territory, and fear is sitting at a level that suggests the market still thinks this is manageable. History says complacency at these rate levels usually doesn't last.
What to watch next is whether the 10-year can hold above 5.2% through the rest of the week. Each close above that level strengthens the case that a deeper correction is coming rather than just a string of small down days. Slipping back under 5.2% would take some pressure off, but real relief still requires a move back below 5%, most likely sparked by a softer inflation report or a clearly more dovish tone from the Fed. Until one of those shows up, the slow grind lower in stocks looks less like a bottom forming and more like the early stage of a bigger repricing.
Previous Day’s Forecast Analysis
Heading into Tuesday, our AI model projected SPY's maximum range at $760 to $771, with the Put side dominating in an expanding band. That setup pointed toward trending price action with intermittent chop rather than a quiet, range-bound day. The bias was bearish. Monday's tape had failed to reclaim the $770 gate and lost the $768 cushion, leaving dealers positioned to sell into weakness beneath the heavy put concentration at $766. The VIX rising 8.34% to 16.11 backed that cautious read, and the message was clear: bears had taken back control, and bulls needed to prove they could defend the floor.
The forecast named $765 as the most important support and the first test of the session. A clean break there would put $763 in play as the point of last hope, and a failure at $763 would open a quick trip to $760, the line in the sand for the month at the bottom of the projected range. On the upside, $768 flipped from support to resistance, and reclaiming it would be the first sign of repair. Above that, $770 was the gate that mattered most, and $771 marked where the tape would begin to heal. $773 stood as the heaviest resistance overhead, with $775 and $777 sitting above the model's ceiling.
The trading strategy called for position sizing of 40-50%. If the VIX broke above 17 on another red tape, traders were told to cut net long exposure and tighten stops to 0.5-0.75% from entry. On the bull side, the preferred setup was a morning dip that held the $764-$763.50 zone and then pushed back through $767. Targets were $768.50 and $770, with stops below $763, and the plan warned against chasing a gap above $768 without a clean retest.
On the bear side, the playbook was to fade a stall in the $767.50-$768.50 band. Targets were $765 and $763.75, with stops above $769.75. A weak open that sliced below $763.50 without a bounce was also shortable at reduced size, targeting $761-$762. With volatility rising, bear-side size could match the bull side. Still, the plan urged traders to cover in layers, since dip-buyers had been quick to defend this market.
Market Performance vs. Forecast
Tuesday's session followed the model's bearish script closely, and the key levels gave traders a clean map from open to close. SPY opened at $766.83, right around the $766 heavy put concentration the forecast flagged as the zone where dealers were positioned to sell into weakness rather than cushion it. That positioning showed up immediately. The session high of $766.95 came almost at the opening bell, and the forecast's warning that opening pops were prone to fading fast proved spot on. Buyers never got close to the $768 level that had flipped from support to resistance, let alone the $770 gate. The model does not account for unpredictable external events, but the tape stayed well contained inside the projected $760 to $771 range all day. The forecast named $765 as the first test and warned that a clean break would put $763 in play as the point of last hope. That is how it unfolded. Sellers pushed through $765, and the session low of $762.35 probed just beneath $763 before buyers stepped back in to lift SPY to a $764.30 close, down 0.17%. The $760 line in the sand was never threatened.
The continuation setup in the falling market scenario delivered the most useful guidance. The forecast said that a slice below $763.50 was shortable at reduced size, targeting $761-$762. Price broke $763.50 and pressed toward that target zone, with the session low landing just above it. Traders who covered in layers into support, as the forecast advised, locked in gains ahead of the late recovery rather than getting greedy for the final leg. The $767.50-$768.50 fade zone never came into play because the bounce never reached it, which kept disciplined traders from forcing a short at a level the tape never offered.
On the rising market side, the preferred long trigger required a dip that held $764-$763.50 and then pushed back through $767. Price never reclaimed $767, so no long entries fired under the framework's rules. That discipline kept traders out of a session that never showed the repair the setup demanded. The caution against chasing a gap above $768 was never tested, since the open came in below that level. The forecast also noted that the prior decline came on light participation, and volume ran below average again Tuesday. That fits a slow grind lower rather than aggressive liquidation, and it lines up with buyers stepping in near $763 and the modest recovery off the lows.
The VIX rose 0.12% to 16.09, essentially flat and holding just above 16, which matched the forecast's view that fear was elevated but not in panic territory. The 17 threshold never triggered, so the more conservative 40-50% position sizing stayed within the framework's rules and kept exposure measured on a red tape. The bearish bias, the $766 dealer positioning, the $765 break, the $763 point of last hope and the untouched $760 floor all delivered actionable guidance. The framework continues to adapt to shifting conditions and gives traders a reliable structure for managing risk and spotting opportunity heading into the next session.
Premarket Analysis Summary
The premarket analysis posted at market open set SPY's projected range for the session between $760 as max downside and $773 as max upside, with spot entering at $767.46 in a call-dominated tape. That marked a bounce after Monday's fade through $768 ended near $765, with the tone firming again overnight. The expected move ran from $759 to $773, and the analysis noted that ranges should stay contained unless one side forced the issue. The defining level was $768, the gate right overhead, the heaviest concentration on the board, and yesterday's breakdown level. Reclaiming and holding it was framed as the signal that the fade was behind us. Above $768, $769 was the first step, and $770 was the major round number bulls really needed. $771 was the next decision point, while $773 capped the expected move as max upside. On the downside, $766 sat beneath spot as the first level to watch and the floor of the morning's bounce, and losing it cleanly would put SPY straight back into the prior decline. $764 was the most important level below and the site of the heaviest battle, $762 was the point of last hope, and $760 was max downside, this month's line in the sand. The analysis summed it up this way: reclaim $768 and $770 gets tested, but lose $766 and expect a quick trip to $764, then a real fight there.
The session never gave bulls the reclaim they needed. SPY opened at $766.83, below the $768 gate and just above the $766 floor of the morning's bounce, and the session high of $766.95 couldn't even get back to $767. That left $769, $770, $771, and $773 untouched all day. Once $766 gave way, SPY slid straight back into the prior decline, and the quick trip to $764 played out just as the analysis warned. The real fight at $764 turned out to be a tough one, as sellers briefly pushed through $762, the point of last hope, to a low of $762.35 before buyers stepped in. The $760 max downside was never threatened. SPY closed at $764.30, down 0.17%, right back at the $764 battle zone and well inside the $759 to $773 expected move. Volume of 31.16M came in below average, and the VIX rose just 0.12% to 16.09, a tape that leaned lower without real conviction.
Validation of the Analysis
Today's session showed how the premarket framework can define the condition that decides the day and then lay out exactly what happens when buyers can't meet it. The analysis named $768 "the defining level," the heaviest concentration on the board and yesterday's breakdown point, and set the condition plainly: "reclaim and hold it, and the fade is behind us." Bulls never came close. SPY opened at $766.83, below that gate, and the session high of $766.95 stalled beneath $767. Because $768 was never reclaimed, $769, "the first step," and $770, the level "bulls really need," never came into play, and traders following the framework had no reason to take the long side. The failure to reclaim $768 was itself the signal to lean short.
From there, the downside road map played out almost word for word. The framework warned that losing $766, "the floor of this morning's bounce," would put SPY "straight back into yesterday's decline," and that is what happened. Sellers broke $766 and drove price into $764, "the most important level below and where the heaviest battle sits." The analysis called for "a quick trip to 764, then a real fight there," and the fight was real. Sellers pushed briefly through $762, the point of last hope, to a session low of $762.35, but the break never turned into the ugly slide the framework cautioned about. Buyers stepped in, the $760 line in the sand was never threatened, and SPY closed at $764.30, right back at the $764 battle zone and well inside the $759 to $773 expected move. The trading opportunities were clean and clearly defined. Shorts taken on the failure below $768 or the loss of $766 had a textbook first target at $764, and traders who stayed with the move had the $762 area as the spot to cover. The late bounce off the lows rewarded traders who waited for buyers to defend that zone before leaning long. Every major call held. The $768 gate capped the tape, the loss of $766 triggered the slide the analysis described, and $764 hosted the real fight it was billed to be.
Looking Ahead
Wednesday brings a heavy slate of economic data that can introduce significant volatility, particularly in the first hour of trading. ADP private payrolls hit at 8:15 AM ET, followed at 8:30 AM ET by the final read on second-quarter GDP and the August PCE price index, the Fed's preferred inflation gauge, along with personal income and spending. The PMI data adds one more test of the economy's momentum. With Treasury yields already at multi-decade highs, a hot inflation print could push yields higher still and pressure stocks, while a cooler reading would give bulls a reason to step back in. Micron reports after the close, offering the next big test for the AI trade. It's also the final trading day of September and the third quarter, so portfolio managers squaring up books and rebalancing into the close can create flows that have nothing to do with fundamentals.
With major data landing before the open, expect the premarket to set the tone and the opening hour to be volatile as traders digest the numbers. Don't try to predict the reaction. Let price confirm direction before committing, respect key technical levels, and keep position sizes sensible until the market shows its hand. Watch the final stretch of the session too, because quarter-end flows can produce late-day surges that reveal where the real money is leaning. Trade what you see rather than what you expect, and use the data reaction to build clean setups heading into the new quarter.
Market Sentiment and Key Levels
The bears still hold a slight edge, but today felt more like a stall than a real push lower. A 0.17% slip is barely a scratch, and SPY spent the session in a tight range that never gave either side much to celebrate. The early high came right at the open, and the market couldn't build on it, which tells you buyers weren't eager to chase. The VIX barely moved, rising 0.12% to 16.09, so fear isn't spreading, but it isn't going away either. Light volume again points to a market waiting for a catalyst rather than one being driven by aggressive selling. Under the surface, things looked shakier than the headline number suggests. Small caps lagged the most, and the Dow gave up more ground than the Nasdaq, which shows that weakness is spread across the market rather than just in tech. When the riskier corners of the market fall behind, that usually means investors are becoming less willing to take chances. The bears haven't landed a knockout blow, but the bulls haven't shown the strength needed to take control back.
The first resistance to watch is $766.95, today's session high, where the opening push stalled right away. Above that, $769.54 is the bigger hurdle. It was the prior session's high, and reclaiming it on stronger volume would suggest the recent drift lower is running out of steam and give bulls a chance to rebuild momentum. On the downside, $763.72 is the first level of support. SPY dipped below the prior session's low during the day but managed to close back above it, which counts as a small win for dip buyers. The real line in the sand is $762.35, today's intraday low. A decisive break beneath that level would mean buyers have stepped aside and could open the door to a deeper pullback as sellers gain confidence. The biggest wild cards remain elevated Treasury yields and energy prices, which keep inflation concerns in play and tie the Fed's hands, even with oil pulling back sharply today. Weakness in a heavyweight tech name also weighed on the index, and the market can't afford many more stumbles from its biggest components. If the VIX starts to climb and volume picks up on down days, the bears could turn this slow grind into something sharper. Until SPY can clear the prior session's high with conviction, staying cautious and selective remains the smarter play.
Expected Price Action
Wednesday's session brings actionable intelligence generated by our AI model, which projects SPY's maximum range at $760 to $771. With the Put side dominating in an expanding band, the model is calling for trending price action with intermittent chop, and Wednesday's GDP, PCE, and PMI data give the market the catalyst it needs to pick a direction. Tuesday's tape kept the pressure on the bulls, but the selling was more of a slow leak than a flood. SPY never threatened $767, the ceiling of the band that has framed this market all week. It spent the session drifting lower and settled in the lower half of the projected range, just above the $763 floor. That gives us a bearish bias heading into Wednesday. Bears are still in control of the short-term trend, even if they are not pressing hard. VIX rose 0.12% to 16.09, which is essentially flat. Fear is holding steady rather than building, and light participation shows sellers still lack real conviction. Bulls have a window to stabilize things, but the burden of proof sits squarely on them.
The first test for Wednesday is $763, the bottom of the recent band and the most important support on the board. Holding that floor is the single biggest job for buyers. A clean break of $763 puts $760 in play quickly, and as the premarket notes warned, $760 can happen fast once that floor gives way. Below $760, the bottom of the projected range, $758 and $755 are the next cushions. If the lowest support fails, there is little standing in the way of a slide toward $750. On the upside, $767 is the level that matters most. Reclaiming it would be the first real sign of repair and would open the door toward $770. Above that, $772 and $777 sit above the model's $771 ceiling as overhead resistance where any rally should run into supply. The bigger picture remains healthy with SPY trading well above structural support near $640, so this is still a dip-buying market on a broader timeframe. In the short run, though, the playbook is simple. Holding $763 keeps the chop alive inside the band, reclaiming $767 flips momentum back to the bulls, and losing $763 means the trip toward $760 could come in a hurry.
Trading Strategy
The VIX rose 0.12% to 16.09, essentially flatlining after the previous session's sharp spike. That tells us something important: fear didn't unwind. Options traders kept paying for protection rather than dumping hedges, so the elevated reading has now held for two straight sessions. At 16.09, volatility sits in a cautious middle ground, not panicked but clearly not complacent, which keeps the burden of proof on the bulls. The 17 threshold is still the line in the sand. A push through that level on another red tape is the cue to trim net long exposure and tighten stops to the 0.5-0.75% range from entry. Until the VIX slips back toward 15, position sizing should stay at 40-50% of normal. The encouraging detail is that the tape drifted lower on thin participation, so this looked more like hesitation than institutions heading for the exits.
In a rising market scenario, the key level to defend is $763-$762.50, the zone where buyers absorbed the midday pressure and kept the drift orderly. A morning test that holds that floor and then drives back through $767 is the preferred long trigger, since clearing that level would mean buyers have finally chewed through the early-session supply. The first profit target is $768.50, with a secondary target of $770 if momentum builds and the VIX starts sliding back under 16. Stops on longs belong below $761.75, because a break there would show the recent floor giving way to a fresh leg of selling. Avoid chasing any gap above $768 without a clean retest. With volatility refusing to cool, early rallies can reverse quickly, and a patient pullback entry offers far better risk-reward than paying up into resistance.
In a falling market scenario, $766.50-$767.50 is the resistance band to fade. A bounce that stalls in that zone and rolls over is a clean short trigger, particularly if the VIX holds above 16 while price struggles to make progress. The initial profit target is $764, with $762.50 in play if sellers press back into the recent lows. Stops on shorts belong above $768.75 to protect against a squeeze through the opening highs. If the market opens soft and slices below $762 without a real bounce attempt, that breakdown is shortable at reduced size, targeting $759-$760. Because the VIX is holding steady rather than accelerating, bear-side size should run slightly lighter than the bull side for now. Cover in layers into support and don't overstay, since dip-buyers have repeatedly stepped in on these slow, grinding pullbacks, and a quiet tape can snap higher fast on one positive headline.
Model’s Projected Range
SPY's projected maximum range for Wednesday is $760 to $771, with the Put side dominating in an expanding band that suggests trending price action with intermittent chop. Wednesday brings GDP, PCE, and PMI data, which are likely to produce significant volatility particularly in the first hour of trading. SPY closed at $764.30, down 0.17%, after opening at $766.83 and tagging a high of $766.95 before sliding to a low of $762.35, with volume coming in lower than average as buyers never really stepped up. SPY is trading near our model's first support at $761, with broader macro headlines continuing to drive sentiment. If price pushes through $768, the next target is $770, but if $761 gives way, expect a move toward $757, and if the lowest support at $750 breaks, there is little to keep price from falling toward $740. The long-term bull trend remains intact above $640 with SPY well above structural support. As long as price holds above key structural levels, this remains a broader dip-buying environment. Absent a catalyst, resistance sits at $768, $770, $775, $780, while support rests at $761, $757, $755, $750. We favor buying dips at $761. Bitcoin went nowhere, finishing flat at -0.00% with a close above $83,503, while the MAG stocks had a mostly red day led by Apple dropping 2.66%, with Meta the standout exception after climbing 3.24%, so leadership was weak outside of Meta but not broken enough to call a trend change. The VIX closed at 16.09, up 0.12%, suggesting elevated fear given the market's inability to hold its opening levels, though the move was small. SPY remains well above its structural support near $640, keeping the bigger-picture uptrend in place even as short-term price action softens.
Market State Indicator (MSI) Forecast
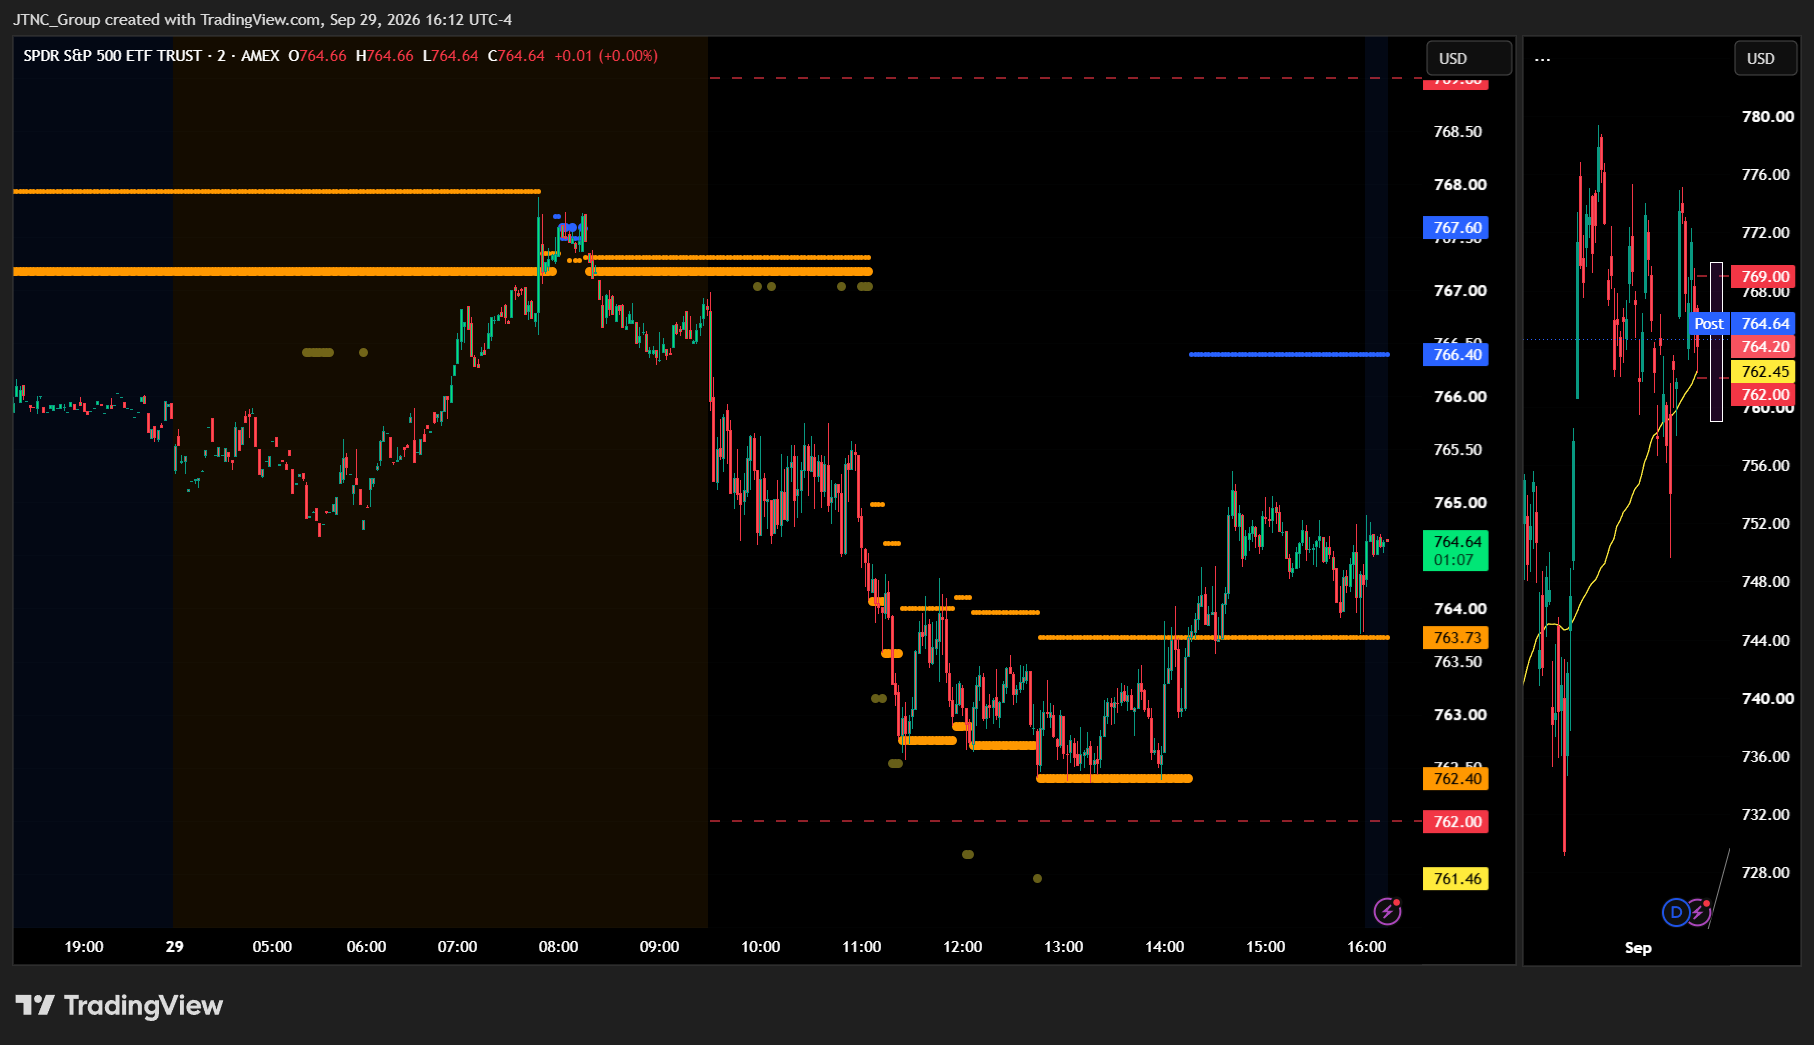
Current Market State Overview:
The MSI ended in a Ranging Market State with SPY closing at $764.30. SPY closed inside the MSI range, so MSI support at $763.73 stays support and MSI resistance at $766.4 stays resistance heading into Wednesday. Extended targets were not printing at the close. In premarket, extended targets were visible below, some near $766.6 and some just under the MSI lines around $767. That showed sellers were already leaning on the market before the bell. During the regular session, extended targets printed below through the AM session and into the PM session. Then they stopped printing, and that was the first sign the selling pressure was running out.
The MSI rescaled lower overnight into an extremely narrow Bearish Trending state. With the occasional extended target below, the MSI was forecasting a decline, but probably nothing too drastic. That is exactly how the day played out. The MSI stayed Bearish Trending and rescaled several times lower through the late AM and early PM selloff. Once the extended targets stopped printing, it rescaled into a much wider Ranging state and held there into the close. The MSI range settled at a moderate $2.67 spread, far wider than Monday's $0.76. That points to more room for price to move rather than the tight coil we saw a day earlier.
SPY bounced off MSI support-turned-resistance just after the open, and it was pretty much downhill from there. Price didn't bottom until the PM session, when extended targets quit printing below and SPY reversed off MSI support. SPY closed down 0.17%, a slow grind lower rather than a flush. Dealers remain positioned for trending action once a direction is set. There is major support at $761 and major resistance at $770.
The MSI is forecasting a sideways to slightly lower session for Wednesday as a continuation of today's action. Without extended targets at the close, the move may be modest and is likely to find support at key levels below. GDP and PCE data hit in premarket, so watch for the MSI to rescale and trade with whatever trend develops. Once the market starts to trend, it is likely to keep going given current dealer positioning. MSI support is $763.73 with resistance at $766.4.
Key Levels and Market Movements:
Monday we stated, "Bulls want to see overnight price hold above $765 and reclaim $767.18, which is now support-turned-resistance," and added, "Bears want to see $767.18 hold as resistance and $765 give way, pressing price back toward the session low of $763.72," while also noting, "The primary setup for Tuesday is to sell rallies into $767.18 support-turned-resistance, targeting $765." Tuesday followed the bears' script almost line for line. Bulls never reclaimed $767.18, and the MSI rescaled lower overnight into a narrow Bearish Trending state instead of the squeeze higher bulls were hoping for. Once $767.18 held as resistance, $765 gave way and price pressed right through Monday's low of $763.72.
SPY opened at $766.83, sitting just below the new MSI range, which sat near $767.2 to $767.8 in premarket and at the open. Longtime users of this tool know we prefer to trade with the MSI when price comes from outside the range. In a Bearish Trending state, that means selling rallies into resistance. Just after the open, SPY pushed to the session high of $766.95, right into MSI support-turned-resistance and the premarket extended target zone near $767, and then failed. That rejection was the first short trigger. Traders sold the bounce and targeted the premarket level near $766.6 and then the $765 area below, and SPY got there without much of a fight.
From there the MSI kept rescaling lower through the late AM and early PM selloff, with extended targets printing below the whole way. That set up the second trade: selling each rally into the new MSI resistance levels as they formed. Since there was no MSI target below, traders aimed for the heavy dealer support at $765 and then Monday's low of $763.72. SPY sliced through both and printed the session low of $762.35.
The third trade came in the PM session. Extended targets stopped printing below, the MSI turned Ranging, and SPY reversed off MSI support. That was a textbook failed breakdown. Traders who bought the reclaim of $763.72 and the new MSI support at $763.73 caught the bounce off the lows as price worked back into the $764s. SPY settled at $764.30.
That was down 0.17% on volume of 31.16 million shares, which is below average. The VIX edged up 0.12% to 16.09, so fear barely moved despite the steady selling. At minimum it was a 3-for-3 session for traders following the framework. It was an easy day to read and execute with substantial setups, all identified through proper context, patience, and flexibility while leveraging the MSI, premarket levels, and market structure rather than forcing trades. The MSI continues to prove its reliability as the cornerstone of our trading process.
Trading Strategy Based on MSI:
Wednesday has heavy economic data with GDP and PCE which can introduce significant volatility, so traders should be ready to trade what they see rather than predict. Both reports land in premarket, so the MSI is likely to rescale before the bell. Traders should wait to see which state the MSI settles into rather than jumping in on the first headline. The MSI closed Ranging after a down session, and the default outlook is sideways to slightly lower as a continuation of Tuesday's action. With no extended targets at the close, though, any push lower may be modest and is likely to find support at key levels below. The $2.67 spread gives price more room to move than Monday's tight box. Major support at $761 and major resistance at $770 frame the bigger picture.
Bulls want to see overnight price hold above $763.73 MSI support and absorb the data without breaking down. From there they want a push through $766.4 MSI resistance toward $767.18 and the $770 major resistance level. If the MSI rescales higher after the data and extended targets start printing above, the shift has real conviction, and traders should lean into strength. Bears want to see $763.73 fail and press price back toward the session low of $762.35 and the major support at $761. If the data sparks a rescale lower and extended targets print below, dealer positioning suggests the move could carry through the session.
The primary setup for Wednesday is to sell rallies into $766.4 MSI resistance, targeting $763.73 support, since Tuesday closed lower and the bias still leans that way. A clean failed breakdown below $763.73 or $762.35 that quickly reclaims would offer a high-probability long back toward $766.4. If bulls reclaim and hold $766.4 with conviction, it would signal a shift in control, and the next target is $767.18 followed by $770. If bears break $763.73 and the MSI moves into a Bearish Trending state, sell the rally back to $763.73 as support-turned-resistance, targeting $762.35 and $761. Failed breakouts and breakdowns inside the range remain the highest-probability trades until the data gives the MSI a clear direction.
The long-term bull trend remains intact above $640 and failed breakouts and failed breakdowns continue to offer the highest-probability setups. Remain flexible, avoid trading during Ranging Market States unless a clear failed breakout or breakdown presents itself, and ensure all trades are fully aligned with MSI signals. Providing real-time insights into market control, momentum shifts, and actionable levels, the MSI when integrated with our Pre-Market and Post-Market Reports continues to sharpen execution precision and elevate trade quality. If you haven't yet integrated MSI and our model levels into your process, now is the time. Contact your representative to get started as these tools are designed to support consistency and enhance performance.
Dealer Positioning Analysis
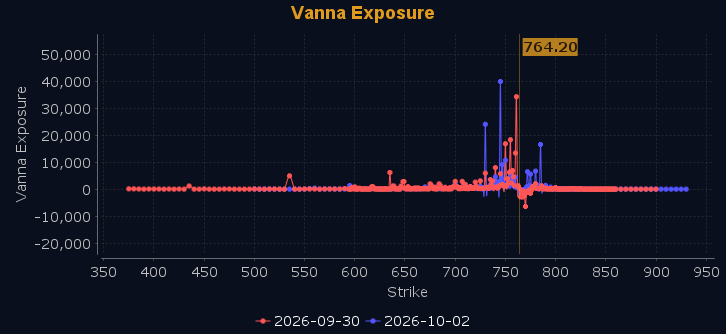
Dealers are selling SPY $771 to $800 and higher strike Calls while buying $765 to $770 Calls, indicating the Dealers' desire to participate in any relief rally on Wednesday. The ceiling for Wednesday appears to be $780. To the downside, Dealers are buying $764 to $700 and lower strike Puts in a 4:1 ratio to the Calls they're selling, displaying growing concern that prices could move lower. Dealers have increased their hedges for Wednesday, which implies some concern over a deeper sell-off. Below $765 is bearish and above $767 is bullish, with everything in between acting as high-noise chop. Should SPY fail to break above $767, expect the rally to be sold with a likely test of $761. Should $761 fail, Dealers will press shorts and push SPY back to last week's lows. A push above $770 will find little resistance to move prices higher toward the all-time high, but that's an unlikely scenario for Wednesday absent an external catalyst. Dealer positioning is unchanged at bearish.
Looking Ahead to Next Friday:
Dealers are selling SPY $770 to $805 and higher strike Calls while buying $765 to $769 Calls, indicating the Dealers' desire to participate in any rally into Friday. The ceiling for this week appears to be $785, but Dealer positioning suggests September will end with neither a bang nor a bust, perhaps right around $770. To the downside, Dealers are buying $764 to $700 and lower strike Puts in a 4:1 ratio to the Calls they're selling, reflecting meaningful concern that prices could move lower. Dealers have enough hedges to protect themselves should the market turn decidedly bearish, but they have not increased those hedges, which implies a balanced market. $761 is major support while $770 is major resistance, with everything in between being nothing but chop and traps. Dealers remain net gamma negative, which implies trending behavior that will reduce the effectiveness of both support and resistance. However, Dealers turn gamma positive at $768, which implies rallies will be sold. Below $765, expect price to accelerate lower, while above $768 price could drift to $770. For the week Dealer positioning is unchanged at neutral/slightly bearish. We advise reviewing Dealer positioning daily for directional clues. These positions evolve quickly and tracking them is essential for staying ahead of shifting market sentiment.
Recommendation for Traders
Favor shorts below $770 and only flip long on a reclaim of that level.
Keep size light and stops tight. Review the premarket analysis posted before 9 AM ET for any changes in the model's outlook and Dealer Positioning.
Good luck and good trading!
