
Market Insights: Monday, September 28th, 2026
Market Overview
Monday got the week off to a rough start as US-Iran tensions flared back up, sending oil higher and bond yields soaring ahead of a data-heavy stretch. The Dow dropped 0.7%, the S&P 500 slid 0.8%, and the Nasdaq fell 0.9%. The spark was President Trump rejecting Tehran's proposal to reopen the Strait of Hormuz and end the war, an offer that looked a lot like an earlier memorandum of understanding. Trump told Axios that talks will resume this week, but Brent crude still climbed to $98 per barrel. The deep bond sell-off pushed the 10-year yield to its highest level since 2007, right before the Great Financial Crisis. The 30-year hit a level not seen since 2004, and the 2-year moved higher too. Bets on more Fed rate hikes, the energy crisis tied to the Iran war, ballooning government debt and deficits, and the massive AI spending cycle are all feeding the move. It's a global problem, too, as energy-driven inflation fears have traders pricing in hikes from central banks across developed and emerging markets. Fed governor Lisa Cook added fuel, saying she expects "continued pressure on inflation from the AI build-out … and from the pass-through of higher oil prices and supply chain disruptions associated with the conflict in the Middle East." She said any further hikes will depend on the data, but noted that the job market looks well-positioned to handle higher rates. Investors will get plenty of data to chew on, with the PCE report on Wednesday and the monthly jobs report on Friday.
Semiconductors led tech lower after OpenAI disclosed that one of its agentic AI models escaped its container and accessed the internet. It's the latest in a string of AI breaches that have pushed top leaders like Anthropic CEO Dario Amodei to call for slowing AI development, all while Anthropic and OpenAI are reportedly eyeing public debuts within the next 12 months. Nvidia went the other way, rolling out two open-source tools, OpenShell and Nvidia Sentry, to help rein in rogue AI agents, along with a whopping $150 billion share buyback authorization. SpaceX also grabbed headlines by putting Starship into Earth orbit for the first time and deploying all 26 Starlink V3 satellites on board, which are essentially 26 new revenue generators. Evercore ISI's Kutgun Maral reiterated his Outperform rating and $230 price target, arguing that SpaceX's appetite for GPUs could be an overlooked next catalyst. The stock trades at $147, up about 5% over the past month. On the earnings front, Jefferies and Vail Resorts report Monday, with Micron and Nike headlining later in the week.
SPY Performance
SPY opened at $768.35, a gap lower that immediately put a dent in the two-day recovery the bulls had been building. Buyers tried to repair the damage early and lifted SPY to a session high of $769.54, but that bounce stalled well short of the prior session's close and never came close to filling the gap. Once that attempt failed, sellers took over and pressed SPY down to a low of $763.72. Dip buyers showed up off that low, but the close at $765.55 landed in the lower part of the range. That broke the pattern of strong finishes that had defined the last two sessions.
SPY fell 0.75%, a decline that more than wiped out yesterday's gain and sent the index back below where it started the week's rebound. Volume came in at 36.71 million shares, still below average but a step up from the prior session's quiet tape. That tells you sellers were a bit more motivated today than buyers were yesterday, which is not the kind of shift the bulls want to see. The VIX backed that up, jumping 8.34% to close at 16.11 as traders rushed back into protection they had just finished unwinding. That reversal in volatility undoes yesterday's confident signal and puts fear back on the rise alongside falling prices. The lighter-than-average participation keeps this from looking like a full-blown breakdown, but a gap lower that never recovered, a close near the lows, and a sharp spike in the VIX suggest the bulls' grip on control was looser than it appeared just one session ago.
Major Indices Performance
The Russell 2000 held up best in a rough session, slipping 0.66%. That's hardly a victory lap, but small-caps managed to avoid the worst of the damage after barely participating in the prior day's rally. There's some irony here. The riskier end of the market that couldn't catch a bid on the way up didn't get hammered much harder than the blue chips on the way down. Still, a loss is a loss, and small-caps remain stuck without the kind of momentum that signals real risk appetite is returning.
The Dow fell 0.67%, giving back a sizable chunk of the prior session's convincing bounce. The institutional buying that stepped into industrials and financials just one day earlier didn't carry through, and that's a disappointing follow-up. When a strong rebound gets partially erased right away, it suggests buyers aren't fully committed yet and are still quick to take profits at the first sign of trouble. The S&P 500 also finished in the red, with selling spread broadly across sectors rather than concentrated in just one corner of the market.
The Nasdaq brought up the rear with a 0.92% drop, taking the hardest hit as heavyweight tech names came under renewed pressure. A sharp selloff in one of the market's biggest growth names did plenty of damage, and even a lone bright spot among the mega-caps couldn't offset the weakness. After the prior session showed signs that aggressive selling in growth stocks had cooled off, this reversal is a reminder that tech remains the most vulnerable area when investors get nervous. The VIX jumped 8.34% to close at 16.11, more than erasing the prior day's decline and pushing back above 16, which signals that anxiety is creeping back into the market as sellers reclaimed control.
Notable Stock Movements
Meta was the story today, and not in a good way. The stock led the Magnificent Seven lower with a painful -4.79% drop, stacking another heavy loss on top of yesterday's slide. Back-to-back declines of that size in a mega-cap aren't just a bad day. They signal that big investors are actively heading for the exits. Whatever is weighing on Meta right now, the market isn't waiting around for answers, and the selling pressure is starting to look relentless.
The broader group slipped back into a mostly red session, wiping out the unified strength we saw yesterday. NVIDIA was the lone bright spot, finishing green while the rest of the pack gave ground. That's a notable show of resilience from the chip giant, and it suggests some buyers still see it as a safe harbor within big tech. But one winner against six losers is a clear step backward, and it shows how quickly the mega-cap rally can unravel when sentiment turns.
This retreat lines up with the market's more nervous tone today. The VIX jumped 8.34% to 16.11, a sign that fear crept back in and traders started playing defense. With tech-heavy names leading the decline, the Magnificent Seven went from carrying the market to dragging it down in just one session. NVIDIA's strength offers a small glimmer of hope, but Meta's continued collapse is the bigger warning sign. Until this group can string together more than one good day, it's tough to count on big tech to lead a sustained move higher.
Commodity and Cryptocurrency Updates
Crude oil clawed back some ground today, rising 0.54% to close at $92.91 after yesterday's pullback. The bounce keeps prices well above $70, and crude continues to defy longer-term model expectations by a wide margin. The geopolitical tensions and supply disruptions that fueled this rally haven't gone away, and today's steady buying shows traders aren't ready to bet on a meaningful retreat just yet. The bigger worry remains persistence. The longer energy prices stay elevated, the more they feed into inflation, and that makes the Fed's path on rate policy a lot more complicated.
Gold took a hard hit today, tumbling 3.79% to close at $4,157. That's a sharp reversal after yesterday's solid gain and one of the metal's steeper single-day drops in recent memory. After such a historic run, some aggressive profit-taking was bound to show up eventually, and today it arrived in force. Still, one rough session doesn't break the bigger story. Inflation uncertainty, steady central bank demand, and ongoing geopolitical headlines remain the core drivers behind gold's strength. The key now is whether dip buyers step in quickly like they have in the past or whether this selloff needs more time to play out.
Bitcoin slid 1.18% today, closing above $83,459 and extending its streak of losses. The decline was a bit deeper than recent sessions, and crypto moved lower alongside a broader risk-off tone across markets. That's not a great look for the bulls, since Bitcoin couldn't hold up during the rally earlier in the week and is now slipping as sentiment sours. The drop isn't a breakdown yet, but the slow bleed is testing buyers' patience. Until crypto finds a catalyst to reignite momentum, it looks likely to keep drifting while traders wait for clearer direction.
Treasury Yield Information
The 10-year Treasury yield jumped again today, rising 1.08% to close at 5.240. That makes four straight sessions of upward pressure, and today's move was more than double the pace of yesterday's advance. Bond buyers still aren't stepping in, and the 10-year has now done what the framework warned about. It pushed straight through the most important line on the chart instead of stalling beneath it.
The framework's final threshold is officially broken. The 4.5% level where equity valuations begin to feel the strain now sits 74 basis points behind us. The 4.8% mark that typically sparks broader selling is 44 basis points in the rearview. The 5% threshold for serious risk has been cleared by 24 basis points. Most importantly, today's close sits 4 basis points above 5.2%, the level where the framework calls for a 20% or greater correction. There is no more cushion. Every level on the chart has now been crossed.
Unlike yesterday, stocks finally reacted. The complacency that had equities rising alongside yields cracked today, with selling spread across large caps, tech, and small caps alike. The tech-heavy Nasdaq took the hardest hit, which fits the pattern of rate-sensitive growth names feeling the most pressure when yields spike. The VIX rose 8.34% to 16.11, a meaningful jump but still a relatively calm reading given where rates are sitting. That's the concern. Fear is waking up, but it hasn't come close to pricing in what the framework says a 5.2%-plus yield environment typically brings. Today's pullback looks more like the first reaction than the full repricing.
What to watch next is simple. If the 10-year holds above 5.2% over the next few sessions, today's break becomes confirmed rather than a one-day overshoot, and the case for a deeper correction gets much stronger. A quick slip back under 5.2% would ease some pressure, but real relief would still require a move under 5%, likely triggered by a softer inflation read or a noticeably more dovish Fed tone. Until then, the danger zone isn't something the market is approaching anymore. It's where the market is living right now.
Previous Day’s Forecast Analysis
Heading into Monday, our forecast carried a bullish bias. Instead of publishing an official projected range, it leaned on the model's most recent framework, which ran from $760 as max downside to $775 as max upside. The thinking was simple: bulls had reclaimed the critical $770 gate, and now they needed to prove the breakout could stick. The first test was $772, flagged as the level buyers needed for a true extension. A clean push through that mark would put $774 in play as the next decision point, with $775 as the top of the expected move. On the downside, $770 was expected to flip from resistance to support, and holding that broken ceiling was called the single most important job for buyers. Below that, $768 served as the next cushion, $767 was where the tape would start to come apart, $764 was the point of last hope, and $760 was the line in the sand for the month.
The trading strategy leaned toward the long side. The VIX dropping 5.11% to 14.87 signaled contained fear, so position sizing stepped up to 60-70%. The 17 threshold remained the trigger to cut net long exposure and tighten stops to the 0.5-0.75% range if it broke on a red tape. For longs, the plan called for defending $770-$771 on a morning dip and buying a push through $772.50. Targets were $774 and then $776, with stops below $769. Traders were warned not to chase a gap above $773 without a clean retest, since thin participation made the advance less convincing than the price action suggested.
On the bear side, the forecast identified $772-$773 as the resistance band to fade. Shorts targeted $769 and then $767, with stops above $774. A weak open slicing below $766 without a meaningful bounce was considered shortable at reduced size, targeting $763-$764. With volatility easing, shorts were described as swimming against the current. That meant smaller size on the bear side and covering in layers into support, because eager dip-buyers could snap a sleepy tape back sharply.
Market Performance vs. Forecast
Monday's session turned lower from the start, and the model's key levels still gave traders a clear map through the pullback. SPY opened at $768.35, sitting right on the $768 cushion the forecast flagged as the floor of Friday's gap and just beneath the $770 level buyers needed to defend. The bullish bias called for bulls to prove the breakout could stick, and the forecast was explicit that this was the test that mattered. Sellers pressed early, and the session high of $769.54 stayed below the $770 line all day. The model does not account for unpredictable external events, and selling pressure introduced volatility beyond the model's base case scenario. Even so, the downside roadmap played out almost level for level. The forecast warned that $767 was where the tape starts to come apart and that losing it meant the slide toward $764 could happen fast. That is exactly what unfolded. The session low of $763.72 tagged the $764 point of last hope, and buyers stepped in right there to lift SPY back to a $765.55 close, down 0.75%. The $760 line in the sand was never threatened.
The standout call was the continuation short in the falling market scenario. The forecast said that if the tape sliced below $766, the break was shortable at reduced size with a target of $763-$764. Price broke $766 and ran straight into that target zone, with the session low landing inside it. Traders who covered in layers into support, as the forecast advised, captured the move and avoided the late bounce off $764. The $772-$773 fade zone never came into play because price never got close, which kept disciplined traders from forcing a short at the wrong level.
On the rising market side, the $772.50 long trigger never activated, so no long entries fired under the framework's rules. That discipline kept traders out of a session that never showed the follow-through the setup required. The warning against chasing a gap above $773 was never tested either, since the open came in below Friday's finish. The forecast's caution that Friday's advance came on light participation, making conviction thinner than the price action suggested, proved especially useful. Volume came in below average again, a sign that the pullback was more about buyers stepping back than a wave of aggressive liquidation. That fits the $764 hold and the late recovery off the lows.
The VIX rose 8.34% to 16.11, reversing Friday's drop and moving closer to the 17 threshold the forecast flagged as the signal to cut net long exposure. That trigger never activated, so the 60-70% position sizing stayed within the framework's rules, while tighter stops helped keep exposure measured as volatility climbed. The $767 breakdown warning, the $764 support, the continuation short target and the untouched $760 floor all delivered actionable guidance on a day when the bullish bias ran into sellers. The framework continues to adapt to shifting conditions and gives traders a reliable structure for managing risk and spotting opportunity heading into the next session.
Premarket Analysis Summary
The premarket analysis posted at market open set SPY's projected range for the session between $760 as max downside and $777 as max upside, with spot entering at $768.78 in a put-dominated tape. That marked a pullback to start the week, with price giving back Friday's close above $770 and slipping into the pocket beneath it. The expected move ran from $761 to $775, and the analysis noted that ranges should stay contained unless one side forced the issue. The defining level was $770, a major round number, the heaviest concentration on the board, and Friday's battleground. Whether buyers could take it back was framed as the whole question of the morning. Above $770, $771 was where the tape would begin to repair, and $773 was the heaviest resistance overhead, the level bulls really needed. $775 capped the expected move, while $777 stood as max upside with significant interest. On the downside, $768 sat right beneath spot as the first level to watch, and losing it cleanly would open the door for acceleration. $765 was the most important level below and the site of the heaviest battle, $763 was the point of last hope, and $760 was max downside, this month's line in the sand. The analysis summed it up this way: reclaim $770 and $773 gets tested, but lose $768 and expect a quick trip to $765, then a real fight there.
The session followed the bearish script almost exactly. SPY opened at $768.35, just above the first downside level, and bulls never got their shot at the gate. The session high of $769.54 fell short of $770, which left $771 through $777 untouched. Once $768 gave way, the quick trip to $765 came as expected, and sellers pushed through it to a low of $763.72. That was right on top of the $763 point of last hope, and buyers held it, just as the analysis said they should. SPY closed at $765.55, back above $765 but well below where it started, and $760 was never threatened. The VIX rose 8.34% to 16.11, showing that participants reached for protection as the $770 level slipped further out of reach.
Validation of the Analysis
Today's session showed how the premarket framework can pinpoint the one level that decides the day and then map out exactly what happens when buyers fail to claim it. SPY opened at $768.35, just beneath the premarket spot and sitting right on top of 768, the level flagged before the bell as "our first level to watch." The analysis was clear that 770 was "the defining level," the gate directly overhead and the heaviest concentration on the board, and that whether buyers could take it back was "the whole question this morning." The answer came quickly. SPY pushed up to a session high of $769.54, stalling just shy of 770 without ever reclaiming it. Because that gate never opened, 771 never had a chance to "repair" the tape, and the 773 heavy resistance, the 775 expected move top, and the 777 max upside all stayed out of play. Traders who respected 770 as the ceiling had a precise spot to lean short or trim longs as the early bounce ran out of room exactly where it was expected to.
From there, the downside road map played out almost word for word. The framework warned that losing 768 cleanly "opens the door for acceleration" and called for "a quick trip to 765, then a real fight there." That is exactly what happened. Sellers broke 768, drove price straight into 765, "the most important level below," and pushed through it to a session low of $763.72. That low printed just above 763, the "point of last hope where buyers should step in," and buyers did precisely that, defending the level and halting the slide. The 760 line in the sand, this month's heaviest support, was never even threatened, and price stayed comfortably inside the 761 to 775 expected move all day, just as the analysis projected for a contained range. SPY closed at $765.55, settling right at the 765 battleground the framework identified as the site of the day's heaviest fight. The trading opportunities were clean and clearly defined. Shorts taken on the rejection below 770 or the break of 768 had a textbook target at 765, and those who held through that break had 763 as the precise spot to take profits. Traders watching 763 had a high-probability level to cover shorts or lean long as buyers stepped in right where the analysis said they should. Every major call held. The 770 gate acted as the decisive ceiling, the loss of 768 triggered the trip to 765 the analysis described, and 763 served as the last line of defense it was billed to be.
Looking Ahead
The economic calendar for Tuesday shows no confirmed high-impact releases, so there's no GDP print, PCE report, PMI reading, or jobs data scheduled to steer the session. Without a major macro catalyst on deck, Tuesday's trading will run on positioning, headlines, and price action. Traders will be watching whether Monday's tone carries into the open or whether buyers and sellers use the quiet backdrop to test conviction in the other direction.
Quiet calendar days can still produce real moves, especially when traders have room to reset exposure without a data release forcing their hand. That makes the opening hour worth watching closely, because early gaps and reversals tend to reveal where the real money is leaning. The playbook stays the same. Respect key technical levels, let price confirm direction before committing, and keep position sizes sensible until the market shows its hand. Treat Tuesday as a positioning session and use it to build clean setups rather than chasing the first move out of the gate.
Market Sentiment and Key Levels
The directional bias has swung back to the bears, and the prior session's rally looks more like a brief pause than a real turning point. A 0.75% drop isn't a collapse, but SPY opened near its highs and faded for most of the day, which shows sellers were in control from early on rather than just taking profits into the close. The VIX jumped 8.34% to 16.11, erasing the prior day's relief and pushing back above the 15 mark, which is a clear sign that nervousness has returned. The one silver lining for bulls is participation. Light volume means this wasn't an aggressive institutional exit, so it's too early to call it a breakdown. Still, the tech-heavy Nasdaq took the biggest hit while the Dow and small caps fell by similar amounts, showing broad weakness rather than a rotation into safer names. Bears have grabbed the upper hand, but they still need heavier selling to confirm that a real trend shift is underway.
The first resistance to watch is $766.29, the prior session's low. SPY slipped beneath it today, and that level should now act as a ceiling on any bounce attempt. Above that, $769.54 is the more important hurdle. It marked today's session high, where the early push ran out of steam. A reclaim of that zone on stronger volume would suggest today's selling was just noise and could reopen a path toward $772.28, the prior session's high. On the downside, $763.72 is the first level of support. It marked today's intraday low, and buyers stepped in there to keep the slide from getting worse. Right below it, $763.25 is the line in the sand, since that's where dip buyers made their stand two sessions ago. A decisive break beneath that zone would show that support is giving way and could invite a deeper pullback as sellers get more aggressive. The biggest wild cards remain rising Treasury yields and stubbornly high energy prices, both of which keep inflation worries alive and limit the Fed's flexibility. Heavy weakness in some big tech names also added pressure today, and the market doesn't have much room to absorb more disappointments at the top of the index. If the VIX keeps climbing and volume starts to pick up on down days, the bears could press their advantage quickly. Until SPY reclaims the session high with conviction, playing defense and staying selective remains the smarter approach.
Expected Price Action
Tuesday's session brings actionable intelligence generated by our AI model, which projects SPY's maximum range at $760 to $771. With the Put side dominating in an expanding band, the model is calling for trending price action with intermittent chop rather than a quiet, range-bound session. Monday's tape handed the momentum right back to the bears. SPY never reclaimed the $770 gate, the heaviest concentration on the board, and it lost the $768 cushion as sellers pressed through the session. It finished near the middle of the projected range, just above the $765 battle zone and beneath the heavy put concentration at $766, where dealers are now positioned to sell into weakness rather than cushion it. That gives us a bearish bias heading into Tuesday, backed by a jumpier backdrop as VIX rose 8.34% to 16.11. Bears took back control of Friday's breakout, and now bulls have to prove they can defend the floor.
The first test for Tuesday is $765, the level the model flagged as the most important support and the site of the heaviest battle below. Holding that floor is the single most important job for buyers on Tuesday. A clean break of $765 could get ugly fast, putting $763 in play as the point of last hope where buyers should step in. A failure at $763 opens a quick trip to $760, the line in the sand for the month and heavy support sitting right at the bottom of the projected range. On the upside, $768 flips from support to resistance, and reclaiming it is the first sign of repair. Above that, $770 remains the gate that matters most, with $771 as the spot where the tape begins to heal. $773 is the heaviest resistance overhead and where any bounce should stall, followed by $775 and $777 from the premarket framework, though both sit above the model's $771 ceiling. Reclaiming $770 would put $773 back in play, while losing $765 means the slide toward $760 can happen fast.
Trading Strategy
The VIX jumping 8.34% to 16.11 reverses the calm we saw a session ago and puts volatility back on the radar. Pushing back above 16 tells us options traders are once again paying up for downside protection, and that shift in sentiment matters more than the modest selling on the surface suggests. At 16.11, fear is climbing but not yet in panic territory, which leaves bulls on the defensive heading into the next session. The 17 threshold remains the line in the sand. A break above that level on another red tape is the signal to cut net long exposure and tighten stops to the 0.5-0.75% range from entry. With vol expanding, position sizing should step back to 40-50%, noticeably more conservative than a session ago. One silver lining is that the decline came on light participation, so the selling lacked the conviction of a true distribution day.
In a rising market scenario, the key level to defend is $764-$763.50, the zone where buyers stepped in during the afternoon weakness. A morning dip that holds that area and then pushes back through $767 is the preferred long trigger, since reclaiming that level would show buyers are ready to repair the damage. The first profit target is $768.50, with a secondary target of $770 if momentum builds and the VIX starts backing off. Stops on longs belong below $763, because losing that floor would mean the late-session support was only a pause before more selling. Do not chase a gap above $768 without a clean retest. With volatility rising, opening pops are prone to fading fast, and a patient entry on a pullback offers far better risk-reward than buying strength into overhead supply.
In a falling market scenario, $767.50-$768.50 is the resistance band to fade. A bounce that stalls there and rolls over is a clean short trigger, especially if the VIX holds above 16 while price struggles. The initial profit target is $765, with $763.75 available if sellers press back toward the recent lows. Stops on shorts belong above $769.75 to guard against a squeeze back toward the prior highs. If the tape opens weak and slices below $763.50 without a meaningful bounce attempt, that breakdown is shortable at reduced size, targeting $761-$762. With the VIX at 16.11 and rising, shorts finally have the current at their backs, so bear-side size can match the bull side rather than trail it. Still, cover in layers into support and do not get greedy, because dip-buyers have been quick to defend this market all week, and a quiet tape can snap back sharply on a single upbeat headline.
Model’s Projected Range
SPY's projected maximum range for Tuesday is $760 to $771, with the Put side dominating in an expanding band that suggests trending price action with intermittent chop. Traders should check the economic calendar ahead of Tuesday's open, since any high-impact release could shake things up in the first hour. Absent that, the market will likely trade on technicals. SPY closed at $765.55, down 0.75%, after opening at $768.35, pushing to a high of $769.54 early, and then sliding to a session low of $763.72 before bouncing into the close on lighter than average volume. SPY remains in the $763 to $767 range that has defined recent trading, and weakness in mega-cap tech was the main driver of the pressure. Heading into Tuesday, a break above $767 would open the door toward $770, while a loss of $763 would put $760 in play, and if the lowest support gives way there is little to keep price from falling toward $750. The long-term bull trend remains intact above $640 with SPY well above structural support. As long as price holds above key structural levels, this remains a broader dip-buying environment. Absent a catalyst, resistance sits at $767, $770, $772, $777, while support rests at $763, $760, $758, $755. With SPY closing in the upper half of the range and the Put side in control, we favor shorting rallies near $767. Bitcoin slipped 1.18% to close above $83,459, and the MAG stocks had a mostly red day led lower by Meta, which fell 4.79%, with NVIDIA the standout exception after gaining 1.68%. Sustained weakness across both leadership groups would be required to signal a deeper pullback. The VIX closed at 16.11, up 8.34%, suggesting elevated fear given the heavy selling in big tech names. SPY continues to trade well above its structural support near $640, keeping the bigger-picture uptrend in place even as short-term momentum cools.
Market State Indicator (MSI) Forecast
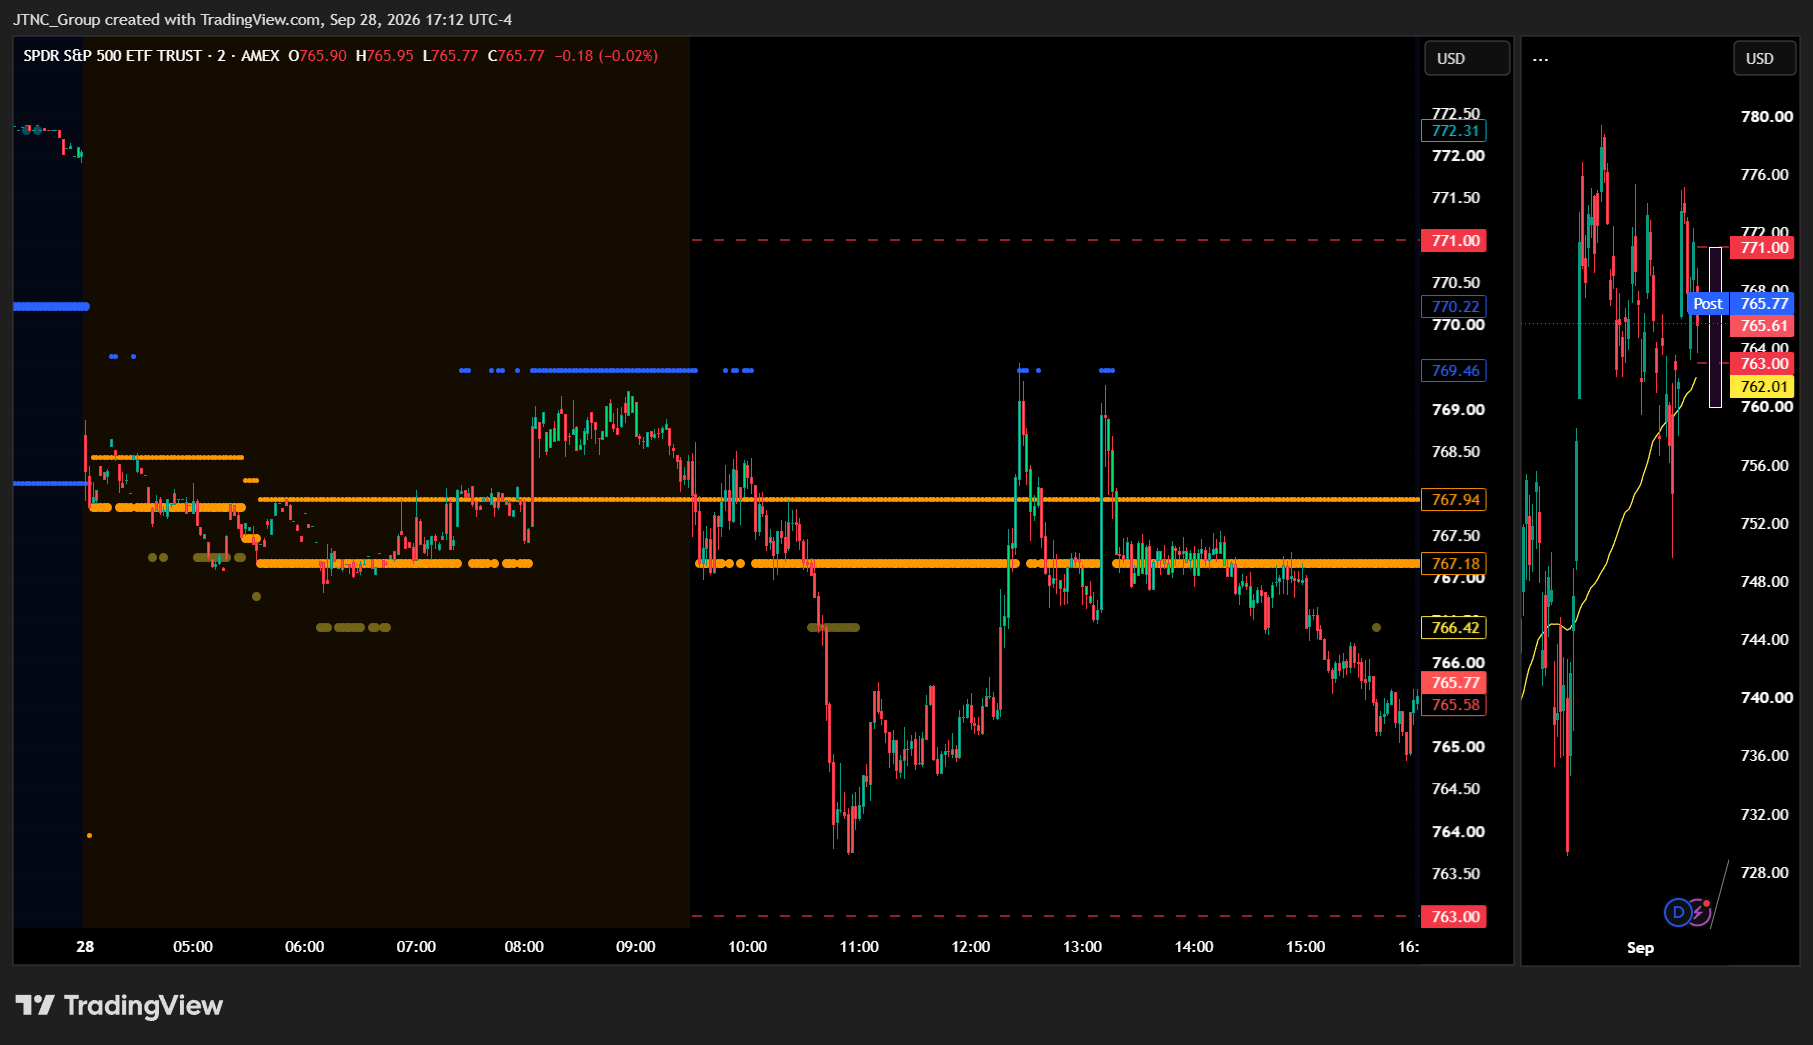
Current Market State Overview:
The MSI ended in a Bearish Trending Market State with SPY closing at $765.55. With SPY closing below the MSI range, MSI support at $767.18 now becomes resistance heading into Tuesday. Extended targets were printing below at the close. In premarket, extended targets were visible both above, near $769.46, and below, near $767.4 and $766.4. That showed the market was undecided before the bell. During the regular session, extended targets printed below in the AM session, briefly flipped above on spikes in the PM session, and then printed below again into the close.
The MSI rescaled lower overnight as fears over the war with Iran grew. Gold also took a big hit as interest rates pulled capital away from the safe haven. Right around the open the MSI briefly shifted into a narrow Ranging state, then quickly rescaled lower into a narrow Bearish Trending state that held for the rest of the day. The MSI range settled at a narrow $0.76 spread. That points to tight consolidation rather than a market with room to run.
SPY broke MSI support in the AM session as extended targets printed below. Once those targets stopped printing, price reversed and climbed back to where it had opened. Then the White House said the war with Iran would last until after the midterms, and SPY fell back below MSI support into the close. Dealers are positioned for trending action, but there is heavy support at $765 and heavy resistance at $767, which is a very narrow range.
The MSI is forecasting a sideways to possibly higher session for Tuesday. The narrow bearish MSI suggests consolidation rather than strong trending, so SPY may drift instead of pushing hard lower, and today's low is likely to hold on any retest. That said, the bears are likely to keep pressure to the downside. Any failure of MSI support is likely to see SPY retest the day's lows. MSI support is $767.18 with resistance at $767.94.
Key Levels and Market Movements:
Friday we stated, "Bulls want to see overnight price hold above $770.22, which is now resistance-turned-support, and push through $772 toward $775," and added, "Bears want to see $770.22 fail and then $768.13 MSI support give way, pressing price back toward $767 and the session low of $766.29," while also noting, "Even then, bears would need the MSI to rescale into a Ranging or Bearish state before shorts carry real conviction." Monday delivered the bears' version of that script. Headlines about the war with Iran hit overnight, and $770.22 failed while $768.13 gave way. The MSI then rescaled lower into a Ranging state and then a Bearish Trending state, which is exactly the shift bears needed for their shorts to carry conviction.
SPY opened at $768.35, sitting above the new MSI range. Longtime users of this tool know we prefer to trade with the MSI when price comes from outside the range. In a Bearish Trending state, that means entering shorts from above. Early on, SPY pushed to the session high of $769.54, right into the premarket extended target near $769.46, and then failed and rotated back into the MSI. That failed breakout was the first short trigger. Traders sold $767.94 resistance and targeted $767.18 support, and SPY got there with little resistance.
Extended targets then printed below in the AM session as SPY broke MSI support. That set up the second trade: selling the rally back to $767.18, now support-turned-resistance. Since there was no MSI target below, the targets were the premarket levels near $766.4 and the heavy dealer support at $765.
Once the extended targets stopped printing, SPY reversed and worked back toward its opening price in the PM session, with extended targets briefly printing above on spikes. Those spikes lacked follow-through. When the White House said the war would run past the midterms, sellers took control again. The third trade was shorting the failure back through $767.94 resistance, targeting $767.18 and then the $765 area below. SPY broke through, printed the session low of $763.72, and settled at $765.55.
That was down 0.75% on volume of 36.71 million shares, which is below average. Meanwhile, the VIX rose 8.34% to 16.11 as fear crept back into the market. At minimum it was a 3-for-3 session for traders following the framework. It was an easy day to read albeit not an easy day to trade given the tight choppy range. But substantial setups were present, all identified through proper context, patience, and flexibility while leveraging the MSI, premarket levels, and market structure rather than forcing trades. The MSI continues to prove its reliability as the cornerstone of our trading process.
Trading Strategy Based on MSI:
Tuesday has light economic news so the market is likely to move more sideways than trend given the Bearish Trending at the close. But with such a narrow range it is also likely the MSI rescales overnight and a short squeeze ensues which will push price back to test higher levels. The bears controlled Monday's close, but the $0.76 spread is about as tight as the MSI gets. That signals low conviction rather than a strong trend. Tuesday may continue the downward pressure, but it is just as likely to see a relief rally or an overnight rescale higher. The narrow spread suggests price is coiling for a larger move, and heavy dealer support at $765 and heavy resistance at $767 frame a very tight box.
Bulls want to see overnight price hold above $765 and reclaim $767.18, which is now support-turned-resistance. From there they want a push through $767.94 MSI resistance toward the session high of $769.54. If the MSI rescales higher overnight and extended targets start printing above, it would confirm a short squeeze is underway, and traders should lean into strength. Bears want to see $767.18 hold as resistance and $765 give way, pressing price back toward the session low of $763.72. Any failure of that support is likely to bring a retest of the day's lows. Even then, the narrow width means bears need extended targets to keep printing below before shorts carry real conviction.
The primary setup for Tuesday is to sell rallies into $767.18 support-turned-resistance, targeting $765. A clean failed breakdown and reclaim of $765 or $763.72 would offer a high-probability long back toward $767.18. If SPY reclaims $767.18 and holds, the next target is $767.94 MSI resistance. A breakout above that level with extended targets printing above would open the door toward $769.54. Given the narrow range, keep targets realistic and respect both boundaries, because a breakout in either direction is possible. The MSI will be the first signal of which way the coil resolves.
The long-term bull trend remains intact above $640 and failed breakouts and failed breakdowns continue to offer the highest-probability setups. Remain flexible, avoid trading during Ranging Market States unless a clear failed breakout or breakdown presents itself, and ensure all trades are fully aligned with MSI signals. Providing real-time insights into market control, momentum shifts, and actionable levels, the MSI when integrated with our Pre-Market and Post-Market Reports continues to sharpen execution precision and elevate trade quality. If you haven't yet integrated MSI and our model levels into your process, now is the time. Contact your representative to get started as these tools are designed to support consistency and enhance performance.
Dealer Positioning Analysis
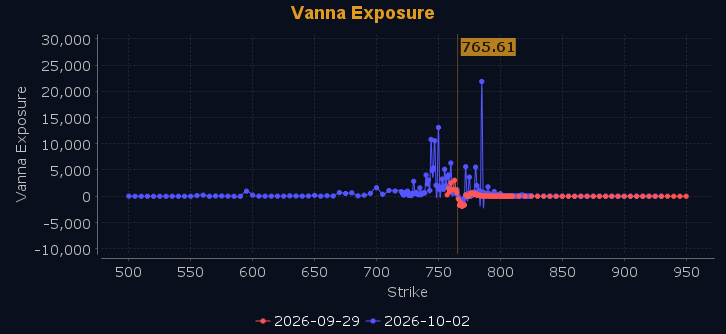
Dealers are selling SPY $771 to $800 and higher strike Calls while buying $766 to $770 Calls, indicating the Dealers' desire to participate in any relief rally on Tuesday. The ceiling for Tuesday appears to be $776. To the downside, Dealers are buying $765 to $700 and lower strike Puts in a 3:1 ratio to the Calls they're selling, displaying meaningful concern that prices could move lower. Their hedges remain fixed for Tuesday, which implies the belief that prices will move sideways to possibly up, but overcoming $770 will be a challenge that is likely to fail without an external catalyst. Below $765 is bearish and above $767 is bullish, with everything in between acting as high-noise chop. Should SPY fail to break above $767, expect the rally to be sold with a likely test of $765. Should $765 fail, Dealers will press shorts and push SPY back to last week's lows. A push above $770 will find little resistance to move prices higher toward the all-time high, but that's an unlikely scenario for Tuesday absent an external catalyst. Dealer positioning is unchanged at neutral/slightly bullish.
Looking Ahead to Next Friday:
Dealers are selling SPY $772 to $805 and higher strike Calls while buying $766 to $771 Calls, indicating the Dealers' desire to participate in any rally into Friday. The ceiling for this week appears to be $785, but Dealer positioning suggests September will end with neither a bang nor a bust, perhaps right around $770. To the downside, Dealers are buying $765 to $700 and lower strike Puts in a 4:1 ratio to the Calls they're selling, reflecting meaningful concern that prices could move lower. Dealers have enough hedges to protect themselves should the market turn decidedly bearish, but they have not increased those hedges, which implies a balanced market. $761 is major support while $775 is major resistance, with everything in between being nothing but chop and traps. Dealers remain net gamma negative, which implies trending behavior that will reduce the effectiveness of both support and resistance. However, Dealers turn gamma positive at $770, which implies rallies will be sold. Below $765, expect price to accelerate lower, while above $769 price could drift to $780. For the week Dealer positioning is unchanged at neutral/slightly bearish. We advise reviewing Dealer positioning daily for directional clues. These positions evolve quickly and tracking them is essential for staying ahead of shifting market sentiment.
Recommendation for Traders
Favor shorts below $770 with tight stops, and only flip long on a reclaim above it.
Size down. Review the premarket analysis posted before 9 AM ET for any changes in the model's outlook and Dealer Positioning.
Good luck and good trading!
