
Market Insights: Friday, September 25th, 2026
Market Overview
Friday brought a solid finish to a choppy week as investors weighed the crosscurrents of falling oil and rising bond yields. The Dow gained 0.9% to snap a three-week losing streak, while the S&P 500 and Nasdaq each rose about 0.5%, locking in weekly wins for all three. The bond sell-off pushed the 10-year yield to its highest level since the global financial crisis on inflation worries, which BlackRock's Rick Rieder called "not a crisis but an eye-opener." Oil moved the other way on optimism over a possible deal to reopen the Strait of Hormuz, with WTI falling to $92 per barrel and Brent slipping below $98. Pain at the pump hasn't eased much, though. Gas neared $4.50 a gallon on average, and the University of Michigan's final September consumer sentiment reading dropped to a four-month low as high gas prices and tariff worries weighed on shoppers. Bank stocks also clawed back some losses after tumbling about 2.6% on Tuesday, when Meta's viral Muse AI agent sparked fears that it could steer customers' idle cash into better-paying accounts, since the app can link financial accounts, monitor balances, and act on a user's behalf. Bank of America's Ebrahim Poonawala said Muse "establishes the opportunity" for margin compression, but he added that the risk isn't real "until deposit costs rise faster than can be explained by rates or competition." That squeeze is already building as banks chase deposits to fund faster loan growth while the Fed raises rates.
The Trump-Xi summit wrapped up Friday afternoon, heavy on choreography but light on results. Thursday's formal dinner featured a red carpet and dozens of top US tech executives, but the only clear outcome was that both sides seem willing to keep their trade relationship at the status quo for several months. AI safety saw little progress this week, but the two countries announced a November summit in Shenzhen to tackle the issue. Trump said he'll meet Xi there and posted that "much has been, and will be, accomplished." Meanwhile, early Uber investor and Tusk Strategies founder Bradley Tusk threw cold water on the AI labs, calling OpenAI and Anthropic "wildly overvalued" and saying he "would certainly short OpenAI" if it were publicly traded. He pointed to fierce competition from Meta, Google, and Grok, along with energy, regulatory, and data center headaches, public antipathy, and the risk of China invading Taiwan. In his view, those are all macro headwinds stacked against these companies.
SPY Performance
SPY opened at $768.78, a modest gap higher that built on yesterday's late-session recovery. Sellers tested that strength early and pushed SPY down to a low of $766.29, briefly dipping below the prior session's close and raising the question of whether the rebound had any staying power. It did. Buyers stepped in off that low and drove SPY steadily higher to a session high of $772.28. The close at $771.35 landed near the top of the range, marking the second straight day that the bulls finished strong after an early wobble.
SPY gained 0.54%, a solid follow-through that erased yesterday's small loss and then some. The catch is volume, which came in at 35.24 million shares, below average and a noticeable drop from the prior session's more active tape. That means today's advance was more of a steady grind than an aggressive buying spree, with sellers stepping aside rather than buyers charging in. The VIX told a more confident story, dropping 5.11% to close at 14.87 as traders unwound some of the protection they had been paying up for. That resolves some of the tension from yesterday, when fear was rising even as prices recovered. Now price and volatility are moving in the right direction together. The lighter participation keeps this from being a full all-clear, but two straight sessions of buyers defending dips and closing near the highs suggests the bulls have regained control for now.
Major Indices Performance
The Dow led the charge, jumping 0.93% as blue-chip names finally snapped their recent losing streak in convincing fashion. After several sessions of steady pressure on industrials and financials, institutional money stepped back into the traditionally valued corners of the market with real conviction. That's a meaningful shift in tone. When the index that had been lagging suddenly takes the top spot, it tells you buyers were willing to put money to work in the names they had been avoiding, not just chasing the usual suspects.
The Nasdaq added 0.48%, a solid follow-up to the prior session's stalemate. Gains in several heavyweight tech names did most of the lifting, though the index didn't have a perfectly clean day, with a couple of notable laggards keeping a lid on the advance. Still, turning a flat finish into a respectable gain shows that the aggressive selling in growth names has cooled off for now. The S&P 500 also finished comfortably higher, giving the broader market a much-needed break from its recent holding pattern.
The Russell 2000 brought up the rear, inching up just 0.07%. A gain is a gain, but small-caps barely participated in the rally, and that's worth watching. When large-caps and blue chips run while the riskier end of the market sits mostly flat, investors are clearly still favoring quality and size over speculative bets. The VIX dropped 5.11% to close at 14.87, snapping its two-day climb and signaling that some of the nervousness that had been building beneath the surface eased as buyers took control.
Notable Stock Movements
Microsoft stole the show today, leading the Magnificent Seven with a powerful 3.66% gain. That's a big move for a company of Microsoft's size, and it's exactly the kind of decisive push this group has been missing. When a mega-cap this heavy climbs that much in one session, it isn't retail noise. It's real money stepping in with conviction. After weeks of watching these names trade in fits and starts, Microsoft's surge is a reminder that buyers are ready to pay up when they see a reason.
The broader Magnificent Seven picture finally flipped to mostly green, breaking the red-majority pattern that has dogged this group for a while. Tesla and Meta were the only holdouts, and Meta took the hardest hit with a -3.33% drop. That's a sharp decline, and it shows that not every mega-cap is getting the benefit of the doubt right now. Tesla's continued weakness also keeps it stuck in the penalty box as the group's persistent laggard. Still, five winners against two losers is a clear improvement over the split decisions we've been getting, and it hints that the rotation may be settling into something more unified.
This stronger showing from the mega-cap core fits the market's more confident tone today. Fear eased and buyers showed up, and big tech carried more of the load than it has in recent sessions. That said, Meta's steep slide is a warning that traders are still being picky about who they reward. The Magnificent Seven are finally starting to act like leaders again, but one good day doesn't make a trend. If this group can keep lining up behind a common direction, the market has a real shot at breaking out of its holding pattern.
Commodity and Cryptocurrency Updates
Crude oil gave back ground today, sliding 2.29% to close at $92.44 and erasing yesterday's bounce. Even with the pullback, prices remain well above $70 and continue to defy longer-term model expectations by a wide margin. The geopolitical tensions and supply disruptions that sparked this rally are still simmering, so today's dip looks more like profit-taking than a shift in the bigger picture. The real concern is persistence. If energy prices stay elevated, they'll keep pushing on inflation, and that makes the Fed's job of calibrating rate policy much harder.
Gold put in a solid session today, climbing 0.52% to close at $4,320. After yesterday's flat trade, this move suggests buyers are stepping back in and the metal is shaking off its recent pullback. That's encouraging for the bulls. The drivers behind gold's historic run remain firmly in place, including inflation uncertainty, consistent central bank demand, and a steady flow of geopolitical headlines. As long as those forces stay intact, dips are likely to keep attracting buyers, and today's action reinforces that the longer-term uptrend is alive and well.
Bitcoin slipped 0.39% today, closing above $84,046 and extending its string of modest declines. Notably, crypto failed to join the broader risk-on rally in equities, which suggests enthusiasm in the space is still muted. The losses remain small, though, so this looks more like a slow grind than a breakdown. The key question is whether buyers can hold the line at current levels and reignite momentum, or whether Bitcoin needs more time to consolidate. For now, crypto remains stuck in neutral while other risk assets move ahead.
Treasury Yield Information
The 10-year Treasury yield pushed higher again today, rising 0.43% to close at 5.180. The pace slowed compared to the prior two sessions, but the direction didn't change. That makes three straight days of upward pressure, and each one has carried yields deeper into territory the framework flags as dangerous. Bond buyers still haven't shown up in any meaningful way, and the 10-year is now pressing right against the most important line on the chart.
The cushion is almost gone. The 4.5% level where equity valuations start to feel the strain is now 68 basis points behind us. The 4.8% mark that typically sparks broader selling sits 38 basis points in the rearview. The 5% threshold for serious risk has been cleared by 18 basis points. That leaves just 2 basis points separating today's close from 5.2%, the level where the framework calls for a 20% or greater correction. At this point, a normal day of drift could be enough to trigger it.
The strangest part of today's action was how stocks responded. Instead of flinching, equities pushed higher, with the blue chips leading the way, and the VIX dropped 5.11% to 14.87. Investors are acting like rising rates are a non-issue, and fear gauges are drifting lower even as yields climb toward the danger zone. That disconnect is exactly what should make traders uneasy. Complacency tends to be highest right before the rate reality forces a repricing, and a low VIX leaves little room for error if the 10-year breaks through.
The watch level couldn't be clearer. A close at or above 5.2% would be the framework's most serious warning signal, and the market is just a hair away from it. Relief would require a pullback under 5%, and that would likely need a softer inflation read or a noticeably more dovish Fed tone. Until then, the gap between rising yields and calm stocks is the biggest risk on the board.
Previous Day’s Forecast Analysis
Heading into Friday, the prior newsletter did not publish a projected range because the model's official range line was missing from the data. Instead, it leaned on the model's most recent framework, which ran from $754 as max downside to $772 as max upside. The bias was cautiously bullish, but it was framed as a lean and not a green light. Bulls still had to prove they could reclaim the level that had capped them all week.
That defining level was $768, the gate the model flagged as the one bulls really needed. A reclaim with conviction was expected to put $770 in play, a major round number and former floor turned resistance that sellers were expected to defend hard. Above that, $772 stood as the final upside target. On the downside, $765 was the first line bulls needed to hold, with $762 and $760 next in focus. The forecast called $760 the true line in the sand, with $758 as the point of last hope and $754 as max downside. With VIX rising 3.23% to 15.67 and the expected move widening, traders were told to brace for bigger swings into the weekend.
The trading strategy called for 50-60% position sizing and flagged 17 on the VIX as the trigger to cut net long exposure and tighten stops to 0.5-0.75% from entry. On the long side, the plan was to buy a dip that held $766-$767 and then pushed back through $769, targeting $771 first and $772-$773 second, with stops below $765. Chasing a gap above $769 without a clean retest was discouraged. On the short side, the $768.50-$769 band was the resistance to fade, targeting $765-$766 and then $764, with stops above $770. A weak open that sliced below $763.25 without a bounce was shortable at reduced size, targeting $760-$761. Shorts were told to cover in layers into support, since this market had shown a stubborn refusal to break down.
Market Performance vs. Forecast
Friday's session delivered the cautiously bullish lean the forecast laid out, with the model's key levels acting as a clear roadmap for the day. SPY opened at $768.78, already above the $768 gate the model called the level bulls really needed. From there, the reclaim did exactly what the framework said it would, putting $770 in play and then carrying price to $772, the max upside and final target in the stack. The session high of $772.28 poked just past that ceiling. The model does not account for unpredictable external events, and late buying pressure pushed price action a touch beyond the base case scenario. Even so, the forecast captured the shape of the day almost perfectly. Bulls were told they had to prove they could take back the level that had capped them all week, and they did just that.
The standout call was the rising market scenario. The forecast named $767 as the key level to defend and flagged a dip that held the $766-$767 zone as the setup to watch. The session low of $766.29 landed right inside that zone, well above the $765 stop, and price then cleared the $769 ceiling as buyers broke out of the range that had boxed them in. The first profit target of $771 was hit, and the secondary target of $772-$773 was reached as well. Price closed at $771.35, holding most of those gains and finishing up 0.54%. The downside levels never came into play. The $765 line held all session, and $762, $760 and the $763.25 continuation trigger were never threatened. That kept disciplined traders out of short continuation setups on a tape that never showed real weakness.
On the falling market side, the $768.50-$769 fade zone gave way once buyers pressed through it. Risk management protocols protected capital there, since the stop above $770 was built to guard against exactly this kind of squeeze through the recent ceiling. The forecast also warned that a sleepy tape could flip into a sharp move in minutes, and Friday's steady grind higher showed why covering in layers and staying nimble mattered. Volume came in below average, which fits the model's caution that breakouts from a quiet tape can lack deep conviction, even when they follow through.
The VIX dropped 5.11% to 14.87, breaking the two-session drift higher the forecast had highlighted and moving further away from the 17 threshold that would have signaled cutting net long exposure. Because that trigger never came close to activating, the recommended 50-60% position sizing kept traders exposed to the upside while staying measured. The $768 gate, the $766-$767 defense zone, both long profit targets and the $765 floor all delivered actionable guidance. The framework continues to adapt to shifting conditions and gives traders a reliable structure for managing risk and spotting opportunity heading into the next session.
Premarket Analysis Summary
The premarket analysis posted at market open set SPY's projected range for the session between $760 as max downside and $775 as max upside, with spot entering at $769.43 in a call-dominated tape. That marked a gap higher after the prior day's rebound, with price pressing right into $770 to close out the week. The expected move ran from $761 to $775, with more room priced below than above, and the analysis cautioned that Friday sessions after a sharp reversal can cut both ways. The defining level was $770, a major round number, the heaviest concentration on the board, and the gate directly above spot. Clearing and holding it would open the path higher, while failing there would make it the morning's high. Above $770, $771 was the first step and $772 was where price was expected to stall, the level bulls really needed for a real extension. $774 was the next decision point, and $775 capped the expected move as max upside. On the downside, $768 was the first level to watch as the floor of the morning's gap and heavy support. $767 was where the tape would begin to come apart, $764 was the point of last hope and the heaviest battle below, and $760 was max downside, this month's line in the sand. The analysis framed it simply: hold $768 and $770 gets a real test early, but lose $767 and expect a quick trip to $764.
The session gave both sides a moment before bulls took control. SPY opened at $768.78, just above the first downside level, then slipped through both $768 and $767 to a session low of $766.29. That break didn't produce the quick trip to $764 the analysis warned about, though. Buyers stepped in well above the point of last hope, and price recovered to reclaim the $770 gate. From there SPY cleared $771 and tagged the $772 stall level with a high of $772.28, right where the analysis projected price would struggle. SPY closed at $771.35, holding above $770 and $771 but below $772, which left $774 and $775 untouched. The VIX dropped 5.11% to 14.87, a sign that participants grew more comfortable with the recovery as the week wrapped up.
Validation of the Analysis
Today's session showed how the premarket framework can map out a two-sided Friday and then let price reveal which script is in play. SPY opened at $768.78, sitting right on top of the 768 level flagged before the bell as "the floor of this morning's gap and heavy support." Early on, sellers tested that floor and pushed price down to a session low of $766.29, dipping briefly under 767, the spot where the analysis warned the tape "begins to come apart." The key word in the framework was "clean," and this break was anything but. Buyers stepped in well above 764, the "point of last hope," so the feared trip to that level never materialized. The 760 line in the sand, this month's heaviest support, was never even in the conversation. Traders who respected 764 as the real line of defense had a clear read that the downside push lacked conviction.
From there, the upside road map played out almost word for word. The analysis called 770 "the defining level," the gate directly above and the heaviest concentration on the board, saying that clearing it would open the path higher. SPY reclaimed it, stepped through 771 as "the first step," and drove into 772, the exact level where the framework said "price should want to stall." The session high printed at $772.28, just a hair above that level, before the rally ran out of steam. SPY closed at $771.35, settling between 771 and 772, precisely inside the zone the analysis identified as the upper decision area. The 774 decision point and the 775 max upside were never reached, which fits with the expected move leaning more toward downside room than upside. The trading opportunities were clean and clearly defined. Longs taken on the defense above 764 and the reclaim of 767 and 768 had a textbook target at 770, and those who held through the 770 breakout had 772 as a precise spot to take profits. Anyone watching 772 had a high-probability level to lock in gains or lean short as price stalled exactly where it was expected to. Every major call held. The deeper support stayed intact, the 770 gate triggered the extension the analysis described, and 772 acted as the ceiling it was billed to be.
Looking Ahead
The economic calendar for Monday shows no confirmed high-impact releases, so there's no GDP print, PCE report, PMI reading, or jobs data lined up to set the tone for the new week. Without a scheduled macro catalyst, Monday's session will run on positioning, weekend headlines, and price action. Traders will be watching whether Friday's tone carries into the open or whether fresh money coming off the sidelines shifts the direction early in the week.
Quiet Mondays can still deliver real moves, especially when traders digest two days of news at once and reset their exposure. That makes the opening hour worth watching closely, because gaps and early reversals tend to reveal where conviction actually sits. The playbook stays the same. Respect key technical levels, let price confirm direction before committing, and keep position sizes sensible until the market shows its hand. Treat Monday as a setup session and use it to position cleanly rather than chasing the first move out of the gate.
Market Sentiment and Key Levels
The directional bias today tilts bullish, and buyers finally delivered the follow-through that was missing in the prior session. A 0.54% gain isn't a blowout, but SPY closing near the top of its range shows buyers were in charge from start to finish rather than just scrambling to defend lower levels. Just as important, the VIX dropped 5.11% to 14.87, snapping its two-day climb and slipping back below the 15 mark, which suggests fear is starting to unwind. The catch is participation. Light volume means this rally lacked the heavy institutional commitment that usually confirms a real trend shift, so bulls should be careful not to overread one good day. The Dow led the charge while small caps barely budged, pointing to a defensive, large-cap rally rather than broad-based risk appetite. Bulls have grabbed the upper hand, but they still need to prove it with stronger conviction.
Key resistance now sits at $772.28, today's session high, where the advance stalled into the close. A clean break above that level on stronger volume would be a meaningful signal and could open a path toward $773.02, the recent high where sellers stepped in and flipped momentum two sessions ago. Clearing that zone would put bulls firmly back in control. On the downside, $768.95 is the first level to watch. It capped the prior session's rally and should now act as support if this breakout is legitimate. Below that, $766.29 is the line in the sand. It marked today's intraday low, and a decisive break beneath it would suggest today's gains were a head fake and could invite a slide back toward $763.25, where dip buyers made their stand last session. The biggest wild cards remain elevated Treasury yields and still-high energy prices, both of which keep inflation concerns alive and tie the Fed's hands. A pullback in crude offered some relief today, but rates are still pressing on valuations. If fear gauges keep easing and volume picks up, bulls have a real shot at pushing through resistance. Until SPY clears the session high with conviction, staying selective and cautious remains the smarter approach.
Expected Price Action
Monday's session brings actionable intelligence generated by our AI model, though the model's projected range for Monday was not included in today's data, so we are not publishing a range figure or making a trend-versus-chop call. Instead, the focus is on the key levels from the model's most recent framework, which run from $760 as max downside to $775 as max upside. Friday's tape did exactly what bulls needed. SPY pushed through the $770 gate, the heaviest concentration on the board, and held above it into the close. It finished in the upper portion of the framework, just beneath the $772 stall level. That gives us a bullish bias heading into Monday, backed by a calmer backdrop as VIX dropped 5.11% to 14.87. Bulls took back the level that mattered, and now they have to prove the breakout can stick.
The first test for Monday is $772, the level the model flagged as the one bulls really need for a true extension. A clean push through $772 puts $774 in play as the next decision point, with $775 as the max upside and the top of the expected move. On the downside, $770 flips from resistance to support. Holding that broken ceiling as a new floor is the single most important job for buyers on Monday. Below that, $768 is the next cushion, since it marked the floor of Friday's gap. $767 is where the tape starts to come apart, and a break there would put the whole rebound in question. Under $767, $764 is the point of last hope and the heaviest battle below. A failure there opens a quick trip to $760, the line in the sand for the month. Holding $770 keeps the path toward $772 and $775 wide open, while losing $767 means the slide toward $764 can happen fast.
Note: Section 3 again ends at line "i." and does not include the "j." Model's Projected Range line. The levels above come from Friday's premarket notes. Please send the "j." line and I will revise the section to use the official projected range and bias.
Trading Strategy
The VIX dropping 5.11% to 14.87 is a meaningful shift after two straight sessions of volatility drifting higher. Slipping back below 15 tells us the protection buying we flagged earlier was unwound as buyers regained control, and options traders are no longer paying up for downside insurance. At 14.87, fear is firmly contained, which gives bulls a friendlier backdrop than they have had all week. The 17 threshold remains the line in the sand. A break above that level on a red tape is still the signal to cut net long exposure and tighten stops to the 0.5-0.75% range from entry. With vol easing, position sizing can step up to 60-70%, slightly more aggressive than a session ago. Keep one caution in mind, though. The advance came on light participation, so conviction behind the move is thinner than the price action suggests.
In a rising market scenario, the key level to defend is $770-$771, where price finished near the top of the day's range. A morning dip that holds that zone and then pushes through $772.50 is the preferred long trigger, since clearing the session peak would confirm buyers are ready to extend the breakout. The first profit target is $774, with a secondary target of $776 if momentum builds. Stops on longs belong below $769, because losing that level would mean the late-day strength was a head fake. Do not chase a gap above $773 without a clean retest. Rallies on thin participation have a habit of stalling once early buyers take profits, and a patient entry on a pullback offers far better risk-reward than buying the opening pop.
In a falling market scenario, $772-$773 is the resistance band to fade. A bounce that stalls there and rolls over is a clean short trigger, especially if the tape shows the same quiet participation that marked the last session. The initial profit target is $769, with $767 available if sellers press back toward the morning lows. Stops on shorts belong above $774 to guard against a squeeze into fresh highs. If the tape opens weak and slices below $766 without a meaningful bounce attempt, that continuation break is shortable at reduced size, targeting $763-$764. With the VIX at 14.87 and falling, shorts are swimming against the current, so keep size smaller on the bear side than on the bull side. Cover in layers into support and do not get greedy, because dip-buyers have proven eager to step in, and a sleepy tape can snap back sharply on a single upbeat headline.
Model’s Projected Range
SPY's projected maximum range for Monday is $766 to $778, with the Call side dominating in an expanding band that suggests trending price action with intermittent chop. Traders should check Monday's economic calendar for any high-impact releases like GDP, PCE, PMI, FOMC or NFP, which would likely produce significant volatility particularly in the first hour of trading, but absent any major data the market will trade on technicals. SPY closed at $771.35, up 0.54%, after opening at $768.78, dipping to a low of $766.29 and pushing to a high of $772.28 on lighter-than-average volume, a steady grind higher that kept buyers in control for most of the session. SPY is trading near our model's first support at $770, and any fresh macro or geopolitical headline could quickly shift the balance in either direction. If buyers can push through first resistance at $775, the next target up is $777, while a break below first support at $770 opens the door to $768, and if the lowest support at $763 gives way there is little to keep price from falling toward $760. The long-term bull trend remains intact above $640 with SPY well above structural support. As long as price holds above key structural levels, this remains a broader dip-buying environment. Absent a catalyst, resistance sits at $775, $777, $780, $787, while support rests at $770, $768, $765, $763. We favor buying dips at $770. Bitcoin slipped 0.39% but still closed above $84,046, while the MAG stocks had a mostly green day across the board led by Microsoft up 3.66%, with Meta the notable laggard down 3.33%, so leadership leaned bullish even as crypto softened a bit. The VIX closed at 14.87, down 5.11%, suggesting a significant reduction in fear as buyers stepped in and pushed SPY back toward the upper half of its range. SPY continues to trade within its broader uptrend with structural support near $640.
Market State Indicator (MSI) Forecast
Current Market State Overview:
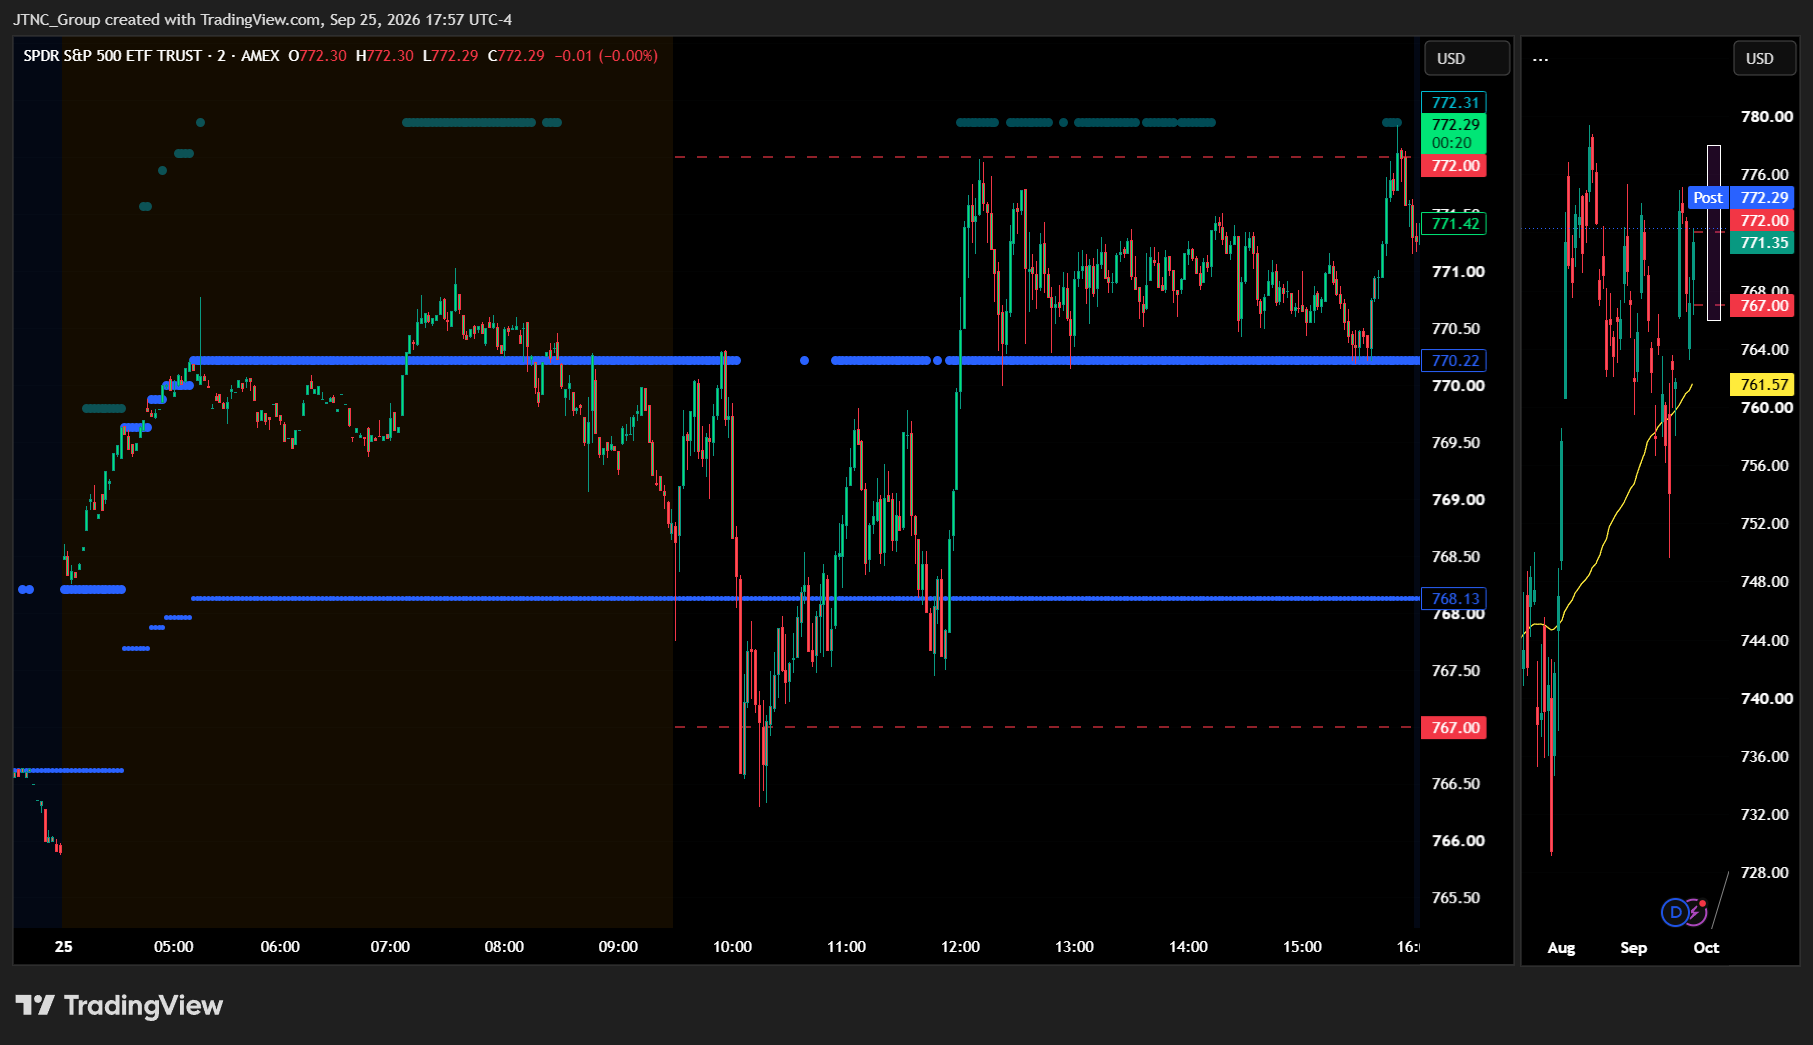
The MSI ended in a Bullish Trending Market State with SPY closing at $771.35. With SPY closing above the MSI range, MSI resistance at $770.22 now becomes support heading into Monday. Extended targets were printing above at the close. Extended targets were visible above in premarket, stepping higher from the early session into the morning as price climbed. They printed above again in the PM session and continued printing into the close. The MSI rescaled higher overnight as SPY broke the prior day's highs and tested major resistance at $770, which held in premarket. By the open the MSI was printing extended targets above with price sitting at MSI support. Price then dipped below MSI support in the AM session and moved back up into the range, which set up a textbook long trigger. SPY reclaimed resistance around noon and kept climbing through the PM session. The Bullish Trending state held from premarket, through the open, and into the close. The MSI range settled at a moderate $2.09 spread. That is wide enough to give price room to trend but still tight enough to keep the levels actionable. The one thing standing in the bulls' way is the $772 level we flagged as the cap, which held and turned SPY back twice, including at the end of the day. Even so, the MSI is forecasting a strong continuation higher for Monday, with the bulls in control and extended targets above suggesting the upside momentum will persist. SPY may test $767 and hold, and once $772 is breached, a move toward $775 is the most likely path. MSI support is $768.13 with resistance at $770.22.
Key Levels and Market Movements:
Thursday we stated, "Bulls want to see overnight price hold above $766.62 MSI support and push through $768.21 MSI resistance toward $770," and added, "If the MSI rescales higher overnight and extended targets begin printing above, it would confirm that buyers have more in the tank than the close suggested, and traders should lean into strength," while also noting, "Keep targets realistic, since resistance near $770 and $772 is likely to slow any advance." Friday checked every one of those boxes. The bulls held support overnight, and the MSI rescaled higher as SPY broke Thursday's highs and pressed into major resistance at $770. Extended targets printed above in premarket, confirming that buyers had more in the tank than Thursday's close suggested. The $770 level held in premarket, though, and SPY opened at $768.78 sitting right on MSI support. Longtime users of this tool know we prefer to trade with the MSI when price comes from outside the range, which means entering longs from below. Early in the AM session SPY broke through MSI support and tagged the session low of $766.29. It then moved back up into the MSI, and that failed breakdown was the first long trigger. The setup carries a better than 70% probability of reaching MSI resistance, and SPY did exactly that, buying at $768.13 and riding to $770.22 by noon. From there price broke through, and extended targets printed above for much of the afternoon. The second trade came on the first dip back to $770.22, as resistance turned support, targeting the $772 area above. That is exactly where the cap we identified on Thursday kicked in. SPY printed the session high of $772.28 and retraced, offering a tactical short from the failed breakout back toward $770.22. The fourth setup was buying that retest of $770.22 support once more for another run at $772. The cap held again into the close, and SPY eased back to finish at $771.35. That was up 0.54% on volume of 35.24 million shares, below average, while the VIX dropped 5.11% to 14.87 as fear drained out of the market. At minimum it was a 4-for-4 session for traders following the framework. It was an easy day to read and execute with substantial setups, all identified through proper context, patience, and flexibility while leveraging the MSI, premarket levels, and market structure rather than forcing trades. The MSI continues to prove its reliability as the cornerstone of our trading process.
Trading Strategy Based on MSI:
Monday has light economic news, but the moderate-width bullish MSI with extended targets above suggests continuation higher is the most likely outcome. The bulls controlled Friday from premarket through the close, and the MSI finished in a Bullish Trending state with a $2.09 spread and extended targets still printing above. That is a very different setup from Thursday's close, when buyers lacked urgency. This time the momentum is there, and the only thing holding price back is the $772 cap. Expect bulls to keep pressing that level, and once it gives way, look for a move toward $775.
Bulls want to see overnight price hold above $770.22, which is now resistance-turned-support, and push through $772 toward $775. If the MSI rescales higher overnight and extended targets keep printing above, it would confirm the breakout is underway, and traders should lean into strength. A dip toward $767 that holds would not break the bullish structure and would likely set up another buying opportunity. Bears want to see $770.22 fail and then $768.13 MSI support give way, pressing price back toward $767 and the session low of $766.29. Even then, bears would need the MSI to rescale into a Ranging or Bearish state before shorts carry real conviction.
The primary setup for Monday is to buy pullbacks to $770.22 support, targeting $772 and then $775 on a breakout. The deeper pullback level is $768.13 MSI support, where a failed breakdown and reclaim would offer the same high-probability long trigger that worked so well on Friday. A failed breakout above $772 that stalls without extended targets printing above could offer a tactical short back toward $770.22. Even so, the bias favors longs until the MSI shifts. As long as SPY holds above $768.13 with the MSI in a Bullish Trending state, dips should be treated as buying opportunities, and the MSI will be the first signal if that changes.
The long-term bull trend remains intact above $640 and failed breakouts and failed breakdowns continue to offer the highest-probability setups. Remain flexible, avoid trading during Ranging Market States unless a clear failed breakout or breakdown presents itself, and ensure all trades are fully aligned with MSI signals. Providing real-time insights into market control, momentum shifts, and actionable levels, the MSI when integrated with our Pre-Market and Post-Market Reports continues to sharpen execution precision and elevate trade quality. If you haven't yet integrated MSI and our model levels into your process, now is the time. Contact your representative to get started as these tools are designed to support consistency and enhance performance.
Dealer Positioning Analysis
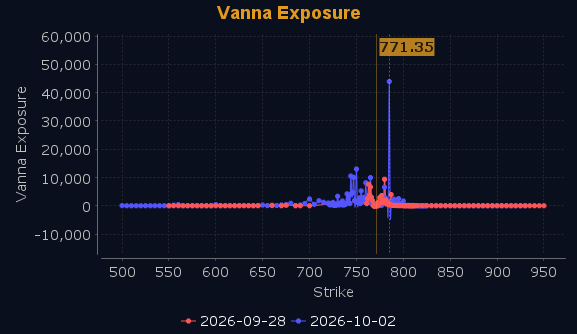
Dealers are selling SPY $772 to $800 and higher strike Calls, indicating the Dealers' belief that any rally on Monday will be capped. The ceiling for Monday appears to be $780. Dealers are neither buying ATM Calls nor selling ATM Puts, which implies a balanced market that is likely to trade in a range. To the downside, Dealers are buying $771 to $700 and lower strike Puts in a 3:1 ratio to the Calls they're selling, displaying meaningful concern that prices could move lower. They have reduced their hedges for Monday, however, which implies the belief that prices may drift higher from here. Below $770 is bearish and above $772 is bullish, with everything in between acting as high-noise chop. Should SPY fail to break above $772, expect the rally to be sold with a likely test of $765. Should $765 fail, Dealers will press shorts and push SPY back to last week's lows. A push above $772 will find resistance at $773 and $775, which will slow any ascent. Dealer positioning is unchanged at bearish.
Looking Ahead to Next Friday:
Dealers are selling SPY $772 to $805 and higher strike Calls, and they are no longer buying ATM Calls or selling ATM Puts. That points to a relatively balanced market that may move more sideways than trend. The ceiling for next week appears to be $785, but $772 is major resistance and needs to break for price to move back toward the all-time highs. To the downside, Dealers are buying $771 to $700 and lower strike Puts in a 4:1 ratio to the Calls they're selling, reflecting meaningful concern that prices could move lower if key levels fail to hold. Dealers are positioned to sell rallies and buy dips rather than trend trade, which implies sideways price action absent an external catalyst. A break of $765 will see SPY reach $760, where there is major support. A break above $772 will find heavy resistance at $775. For the week Dealer positioning is unchanged at neutral/slightly bearish. We advise reviewing Dealer positioning daily for directional clues. These positions evolve quickly and tracking them is essential for staying ahead of shifting market sentiment.
Recommendation for Traders
Lean long above $770 with tight stops, and flip short on a break below it.
Size down. Review the premarket analysis posted before 9 AM ET for any changes in the model's outlook and Dealer Positioning.
Good luck and good trading!
