
Market Insights: Wednesday, September 23rd, 2026
Market Overview
Wednesday was a rough day on Wall Street as surging Treasury yields and rising oil prices rattled investors across all three major indices. The Dow dropped 0.7%, the S&P 500 fell 0.8%, and the Nasdaq shed 1.1%, snapping its back-to-back record-high streak. The 10-year Treasury yield spiked to 5.11% — its highest level since 2007 — after hotter-than-expected US business activity data stoked fresh inflation fears and increased bets that the Fed has more rate hikes in store. Fed Governor Michael Barr reinforced that concern in a Chicago speech, calling for "further policy adjustments" to bring inflation down. Mortgage rates are feeling the heat too, with the average 30-year fixed jumping 9 basis points to 7.26% — the highest in nearly two years — pushing more borrowers toward adjustable-rate loans.
On the geopolitical front, the Trump-Xi summit is still the main event, but expectations have quietly been walked back. Chinese state media confirmed Xi departed with a noticeably smaller business delegation than originally anticipated, with the South China Morning Post reporting that a lack of deal progress led to the scaled-down entourage. The summit will cover trade, AI, rare earths, and the Iran situation, though experts aren't expecting major breakthroughs. Tech investors will be watching AI policy closely, especially after Anthropic CEO Dario Amodei published an essay on cooperative AI development — and a Silicon Valley all-star lineup including Nvidia's Jensen Huang, OpenAI's Sam Altman, and Google's Sundar Pichai is set to join both presidents for dinner Thursday. Rounding out the day's news, a Morgan Stanley banker accidentally emailed clients an internal document listing over 100 investment-banking deals the firm is pitching across Asia, Europe, the Middle East, and Africa — not exactly the kind of transparency Wall Street prefers.
SPY Performance
SPY opened at $772.79 and almost immediately ran into trouble, with the high of $773.02 coming right out of the gate before sellers took control and never really let go. The low of $766.50 told the real story of the session — this was a one-way move for most of the day, with buyers unable to mount any meaningful defense. The close at $767.83 settled near the lower end of the range, which is not the kind of tape action bulls want to see heading into the next session.
SPY finished down 0.72%, a modest loss on the surface but one that carried a bearish tone given how the price action unfolded. Volume came in at 37.59 million shares, below average but notably higher than the prior session, meaning this wasn't just random drift — there was enough participation to give the selling some credibility. The VIX backed that up, rising 2.02% to close at 15.17, reflecting a market that is starting to reprice risk after a stretch of relative calm. That combination of a lower close, a wider downside range, and a rising volatility reading suggests the bulls are losing some of the quiet confidence they had built up. Yesterday's flat session looked like a rest — today's action looks more like the bears finally decided to show up.
Major Indices Performance
The Dow took the biggest hit on the day, dropping 1.03% as blue-chip names bore the brunt of a broad risk-off session. The selling pressure across large-cap industrials and financials reflected a market growing increasingly uncomfortable with the macro environment, particularly as bond yields push into territory that makes equities look less attractive on a relative basis. When the Dow is leading to the downside, it's usually a signal that institutional money is pulling back from the more traditionally valued corners of the market.
The Nasdaq wasn't far behind, sliding 0.69% as weakness in some of its heavyweight components dragged the index lower. Tech held up marginally better than the Dow on a percentage basis, but it wasn't a clean day by any stretch. The S&P 500 also finished in the red, consistent with the broad selling tone that defined the session. The fact that growth and value both struggled together suggests this wasn't a rotation day — it was a risk reduction day.
The Russell 2000 was actually the worst performer of the group, falling 1.16% and reversing the relative strength small-caps had been flashing in recent sessions. That's a notable shift. When small-caps go from leading to lagging, it signals that risk appetite is deteriorating across the board, not just in specific pockets. Small-caps are sensitive to both economic growth expectations and credit conditions, so a decline of that magnitude is worth monitoring closely. The VIX rose 2.02% to close at 15.17, confirming that fear is quietly creeping back into the market even if it hasn't reached alarm levels just yet.
Notable Stock Movements
Alphabet took the lead on the downside today, and it wasn't close — a -3.80% loss made it the clear laggard of the group and the kind of move that reverberates well beyond just one name. Alphabet carries serious weight across the Nasdaq and the broader mega-cap landscape, and when a stock of that size drops nearly four percent in a single session, it sends a signal that's hard to ignore. This is the sort of loss that shifts sentiment, pressures index-level performance, and gives traders reason to question whether the risk-on posture is really intact or just running on borrowed time.
The broader Magnificent Seven picture was mostly red today, extending the fractured theme that has become a recurring pattern for this group. The exceptions were Meta, Microsoft, and Tesla, all of which managed to close in the green and provided at least some offset to the damage Alphabet inflicted. But three green names against a mostly red backdrop is not the recipe for group-level leadership — it's the same fragmented dynamic the complex has been stuck in, where isolated winners exist but unified conviction does not.
This kind of splintered performance from the mega-cap core fits the broader market's uneasy tone. When the Magnificent Seven can't get organized around a common direction, the tape loses one of its most reliable engines for trend development. With Alphabet dragging this hard and the group unable to rally around a coherent theme, the market is once again left searching for leadership that simply isn't showing up from the names that matter most.
Commodity and Cryptocurrency Updates
Crude oil slid another 2.20% today, closing at $92.51, and even with that kind of daily pressure, black gold is still sitting well above $70 — defying longer-term model expectations by a wide margin. The structural forces that pushed prices into the nineties remain very much in play, and any fresh geopolitical tension or supply disruption could reignite the move higher in a hurry. A sustained presence at these elevated levels keeps energy squarely in the inflation conversation, and that's exactly the kind of complication the Fed doesn't need while it's trying to stick the landing on rate policy.
Gold gave back some ground today, slipping 1.30% to close at $4,319. After the metal's impressive run to historically lofty levels, a down day like this is more of a breather than a breakdown. The macro backdrop — persistent inflation uncertainty, global central bank demand, and geopolitical noise — still provides a solid floor under prices, and one soft session doesn't change the longer-term story. Gold bulls aren't panicking here.
Bitcoin dropped 2.15% today, closing above $84,318, pulling back after what had been a solid run of momentum in recent sessions. Crypto giving back a couple percent on a broad risk-off day across markets isn't exactly shocking — when equities trade heavy, Bitcoin tends to feel it too. The key level to watch is whether buyers step back in around current prices or if the selling finds another gear. For now, the crypto trade is taking a pause alongside everything else.
Treasury Yield Information
The 10-year Treasury yield made a decisive move today, jumping 3.04% to close at 5.110. That's not a nudge — that's a statement. After spending the prior session teasing the 5% threshold, yields blew right through it and pushed firmly into territory the framework flags as spelling real trouble for equities. The danger zone is no longer at the doorstep. The market is standing inside it.
Every alarm in the framework is now flashing. The 4.5% level that starts compressing equity multiples is more than 60 basis points behind us. The 4.8% crossover that signals broader selling pressure is nearly 30 basis points in the rearview. And the 5% line that represents serious risk for stocks has been cleared with room to spare. At 5.110, the next number that matters most is 5.2% — the level where the framework calls for a 20% or greater correction. That's only 9 basis points away, and with momentum at today's pace, it's not a distant abstraction anymore.
What makes today's move particularly concerning is that the equity market actually responded this time. Unlike the uneasy equilibrium seen in recent sessions where stocks shrugged at yield increases, today's broad-based selling across every major index confirms the market is starting to price in the rate reality. That kind of correlation between rising yields and falling equities is exactly what the framework predicts once yields are sustainably above 5%.
The watch levels have shifted. The key question now is whether 5.110 holds as a ceiling or becomes a launching pad toward 5.2%. Any further push in that direction brings the correction scenario into serious play. Meaningful relief would require yields pulling back through 5% — and right now, there's no obvious catalyst to make that happen.
Previous Day’s Forecast Analysis
Wednesday's forecast called for SPY to trade within a thirteen-point range bounded by $769 on the downside and $782 as the max upside target, with Tuesday's close at $773.44 sitting near the middle and giving the session a neutral lean with a slight bullish tilt. The model framed $775 as the defining level of the day — the gate bulls needed to clear and hold to keep the trend constructive. A push through $775 with conviction was expected to open $776, then $777, and eventually $780 as the major round number where price would likely stall. The model's max upside sat at $782. On the downside, $773 was the first line to watch, $772 the next decision point, and $770 the critical floor that had supported the entire run — a clean break below that level was flagged as the trigger for a fast move toward $769.
The trading strategy leaned risk-on given the VIX dropping to 14.31, supporting 60-70% position sizing with stops in the 0.75-1% range from entry. The preferred long setup was a controlled pullback into $769-$771 that stabilized and reclaimed $772 intraday, targeting $775.14 as the first profit zone and $778-$780 as a secondary target. Stops on longs were placed below $767. On the short side, the strategy called for fading a rejection at the $774-$775 resistance band, targeting $770-$771 initially and $767-$768 if sellers took control, with stops above $776. The strategy emphasized not chasing price without confirming volume and cautioned that the compressed volatility environment made swift reversals a real risk for anyone overstaying short positions.
Market Performance vs. Forecast
Wednesday's session delivered a bearish move that the forecast's downside framework captured with notable precision at the structural level. SPY opened at $772.79, right in line with the model's first support zone at $773, and immediately signaled that the burden on bulls the forecast described — clearing and holding $775 — was not going to be met. The open itself validated the directional read: price never challenged $775, never gave bulls a meaningful setup, and instead resolved toward the downside path the forecast explicitly mapped out. The model's warning that "lose $772 and the trip to $770 happens fast" proved directionally accurate, as the session broke through that level and continued lower.
The forecast's falling market scenario identified $774-$775 as the resistance band to fade and flagged $770-$771 as the initial profit zone for shorts entering on that rejection. Wednesday's price action confirmed that fade entirely — price never reclaimed the $774-$775 zone after the open, and sellers established control through the session. The close at $767.83 pushed below the model's $769 max downside, which reflects the reality that the model's base case doesn't account for the kind of external catalysts that can drive price action beyond the projected range — and risk management protocols built into the framework, specifically stops on shorts above $776 and layered cover into support, protected capital and kept traders positioned correctly on the right side of the move through the bulk of the decline.
The VIX rising 2.02% to 15.17 is exactly the dynamic the forecast warned about — the model explicitly stated that "even a modest negative catalyst can produce an outsized snap higher in vol that catches complacent longs off guard" and identified a move back above 17 as the first real warning sign. Wednesday's vol expansion was a step in that direction, and the framework's caution about trimming net long exposure as vol climbs remains the right posture heading forward. The directional bias, the resistance levels, and the vol risk warning all proved valuable, and the framework's structural reads continue to provide a reliable foundation for navigating whatever the next session brings.
Premarket Analysis Summary
The premarket analysis posted at market open set SPY's projected range for the session between $768 as max downside and $780 as max upside, with spot entering at $773.05 in a call-dominated tape that had given back a point after the prior day's push stalled under $775. The expected move was five points, signaling contained ranges unless one side forced the issue. The defining level was $776 — identified as the heaviest concentration on the board and the critical hold for bulls to turn the pause into a continuation rather than a top. Clearing and holding $776 pointed toward $778 as the expected move top and $780 as the major round number and max upside. On the downside, $772 sat right beneath spot as the first watch level, $771 was the next decision point with little cushion, $770 was identified as the most important floor below — the week's base and a major round number where the heaviest battle sat — and $768 was max downside at the bottom of the expected move. The analysis warned that a clean break of $770 could get ugly fast, and placed the burden on price to reclaim $774 first before $776 could even be tested.
The market never gave bulls a chance to work with the upside framework. SPY opened at $772.79, immediately right at the first downside watch level, tapped a high of just $773.02 — barely a whisper above the open — and then broke down decisively through $772 and $771 before cracking the critical $770 floor the analysis had flagged as the line that would define the week. That clean break did exactly what the analysis warned, accelerating selling all the way to a session low of $766.50 and a close of $767.83, well through max downside at $768. The upside targets never came into play. The VIX rising 2.02% to 15.17 confirmed the shift in tone, with sellers firmly in control from the opening bell.
Validation of the Analysis
Today's session was a clear reminder that the premarket framework doesn't just identify levels — it tells you exactly what a break of those levels means, and the tape delivered that message in full. SPY opened at $772.79, essentially on top of the 772 level flagged before the bell as "the first level to watch" beneath spot. The analysis was explicit: lose 772 and expect a quick trip to 770. That's precisely what happened. The open was the high-water mark for buyers, with price immediately stalling at $773.02 before rolling over without a serious attempt to reclaim 774 or challenge 775. The bull case was dead on arrival.
From there, the downside road map executed with precision. The framework put 770 as "the most important level below — the floor of this week's run, a major round number, and where the heaviest battle sits," and warned that "a clean break there could get ugly fast." SPY didn't just test 770 — it sliced through it and drove all the way down to $766.50, with the session closing at $767.83. The analysis flagged 768 as the max downside at the bottom of the expected move, and price blew past even that level, signaling the kind of forced selling that the framework specifically cautioned about when it noted a failure at 770 could accelerate quickly. Traders who came in with the road map knew the moment 772 gave way at the open that the session was bearish, that 770 was the critical line, and that a break there meant the situation got materially worse. Every key structural call held directionally, and the sequence played out almost exactly in the order the analysis described it.
Looking Ahead
The economic calendar for Thursday is similarly quiet, with no confirmed high-impact releases on deck to shake things up. No GDP print, no PCE data, no Fed speakers flagged — just another session where the market has to find its own direction without a macro catalyst forcing the issue. That puts the tape back in charge, and traders will be watching closely to see whether Wednesday's price action generates any meaningful follow-through or simply fades into the noise.
With nothing scheduled to jolt sentiment, the focus stays on technical structure and how the market behaves around key levels. Clean setups are the priority in this kind of environment — let price confirm a direction, manage risk tightly, and avoid chasing moves that haven't been validated by volume or momentum. The absence of a catalyst doesn't mean opportunity disappears; it just means discipline becomes the edge.
Market Sentiment and Key Levels
The directional bias today leans bearish, and the bears have a credible case. A -0.72% close with SPY fading from the open and finishing near session lows tells you sellers were in control for most of the day. The VIX rising 2.02% to 15.17 confirms that fear is quietly creeping back into the market — not at alarming levels, but the direction matters. Below-average volume on a down day is a small silver lining, suggesting this wasn't a panic-driven flush, but the broad weakness across indices and the lack of any meaningful intraday recovery attempt doesn't inspire confidence from the bull camp. Gold dropping and Bitcoin sliding alongside equities removes some of the usual safe-haven counterbalance, leaving the tape looking broadly defensive without a clear place to hide.
Key resistance now sits at $773.02, the session high that SPY touched briefly at the open before sellers took over. A reclaim of that level on meaningful volume would be constructive and could put the $775 to $776 range back in play, where prior overhead supply would likely slow any recovery attempt. On the downside, $766.50 — today's intraday low — is the immediate support level to defend. A decisive break below that floor would signal that buyers aren't willing to step in at current prices and could open the door to a test of the $763 to $764 zone, where bulls would need to make a credible stand to prevent further deterioration. The 10-year yield closing at 5.110 is sitting in genuinely uncomfortable territory for equities, and any further move higher in rates would almost certainly act as the dominant headwind. A stabilization in yields combined with some relief from crude's elevated levels would give bulls a fighting chance, but right now the burden of proof sits squarely on their shoulders.
Expected Price Action
Thursday's session brings actionable intelligence generated by our AI model, with SPY projected to trade within a range framed by $768 on the downside and $780 as the max upside target. That twelve-point window keeps this in trending territory — traders should expect a directional move rather than a sideways grind, and having a directional bias locked in before the open is non-negotiable. Wednesday's close at $767.83 sits near the lower end of the projected range, which tilts the bias bearish heading into Thursday and puts the burden squarely on bulls to reclaim lost ground before the tape can even begin to think about upside.
The defining level heading into Thursday is $772 — the first gate above current price and where buyers need to show up in force. A reclaim of $772 with conviction puts $774 in play, then $775, which was where Wednesday's early rally ran out of steam and where the real battle between bulls and bears will be fought. Above $775, $778 is the next meaningful target before $780, the max upside and a major round number where sellers should be expected to press. On the downside, the immediate floor is $768, sitting just below Wednesday's close and the model's max downside — there is very little cushion there. A clean breach of $768 removes a critical support layer and opens the door for an accelerated move lower with limited technical footing beneath it. With VIX climbing to 15.17, there is enough nervousness in the market to keep sellers active on any failed bounce attempt. Bulls need to get back above $772 quickly on Thursday — reclaim it and $775 becomes the test that determines whether this is a dip or a breakdown; fail to hold $768 and the selling pressure accelerates in a hurry.
Trading Strategy
The VIX rising 2.02% to 15.17 is a modest but notable uptick in implied volatility, and it lines up cleanly with the broad market softness seen across the session. At 15.17, the options market is not yet flashing a panic signal — this is still a relatively contained fear reading — but the direction of travel matters. A VIX that is grinding higher even on a moderately down day suggests the market is quietly pricing in additional risk, and traders who built long exposure into recent strength need to take that seriously. A push above 17 would be the next meaningful threshold to watch, and if vol breaks above that level on a red tape, the appropriate response is to cut net long exposure and tighten stops to the 0.5-0.75% range from entry. Until that threshold is taken out, 55-65% position sizing is sensible — not an outright defensive posture, but measured caution that keeps powder dry for better setups ahead.
In a rising market scenario, the long setup requires patience. The key level to watch is a reclaim and hold of $770 on any early morning dip, since that zone represents the lower portion of where price consolidated during the session. A bounce off $769-$770 that pushes back above $772 intraday is the preferred long trigger, targeting $773 as the first profit zone near the session's opening level, with a secondary target of $775-$776 if broad participation returns and buyers show genuine conviction behind the move. Stops on longs belong below $766.50 — a breach of the session low on renewed volume signals that the dip-buyers are not in control and the trade has failed. Do not chase an open above $772 without a clean retest — entries taken into strength on a tape that just sold off carry significantly higher risk of fading.
In a falling market scenario, $772-$773 is the resistance band to fade. That zone marked the opening range before sellers took control, and any morning bounce that stalls in that area is a clean short trigger. The initial profit target is $769-$770, with $767 available if sellers stay organized and buyers fail to generate meaningful counter-pressure. Stops on shorts belong above $773.50 to protect against a squeeze back through the opening range. If the tape opens weak and breaks below $767.83 — the prior session close — without a credible bounce attempt, that continuation break is shortable at reduced size targeting $764-$765. With the VIX at 15.17 and trending upward, short positions carry a slightly friendlier volatility backdrop than they did a session ago, but this is not the time to overstay — cover into support levels in layers and respect that a single positive headline in a low-volume environment can trigger a fast, aggressive reversal.
Model’s Projected Range
SPY's projected maximum range for Thursday is $762 to $773, with the Call side dominating in an expanding band that suggests trending price action with intermittent chop. Thursday brings Unemployment Claims data, which is unlikely to move the market. Wednesday's session saw SPY open at $772.79, tag a high of $773.02 early, then fade throughout the day to a low of $766.50 before closing at $767.83, down 0.72% on the session, with volume coming in below average and the VIX rising 2.02% to 15.17. SPY remains in the $765 to $770 range that has defined recent trading, with ongoing trade policy uncertainty continuing to weigh on sentiment as markets digest the broader macro backdrop. On Thursday, the first resistance our model shows is $770 — a clean break above that level targets $771 next, while a failure at $765 support opens the door toward $762, and if that level gives way there is little to keep price from falling toward $755. The long-term bull trend remains intact above $640 with SPY well above structural support. As long as price holds above key structural levels, this remains a broader dip-buying environment. Absent a catalyst, resistance sits at $770, $771, $773, $775, while support rests at $765, $762, $760, $755. Given the close at $767.83, we favor buying dips near $765 where our model shows the first meaningful floor. Bitcoin dropped 2.15% to close above $84,318 while the MAG names were mostly red across the board, led lower by Alphabet at -3.80%, with Meta the lone bright spot up 1.02% — sustained weakness across both leadership groups would be required to signal a deeper pullback. The VIX closed at 15.17, up 2.02%, suggesting elevated fear given the broad-based selling in mega-cap tech and the ongoing macro uncertainty hanging over the tape. SPY closed just above the lower line of the current trend channel, with structural support nearby keeping the intermediate uptrend technically intact for now.
Market State Indicator (MSI) Forecast
Current Market State Overview:
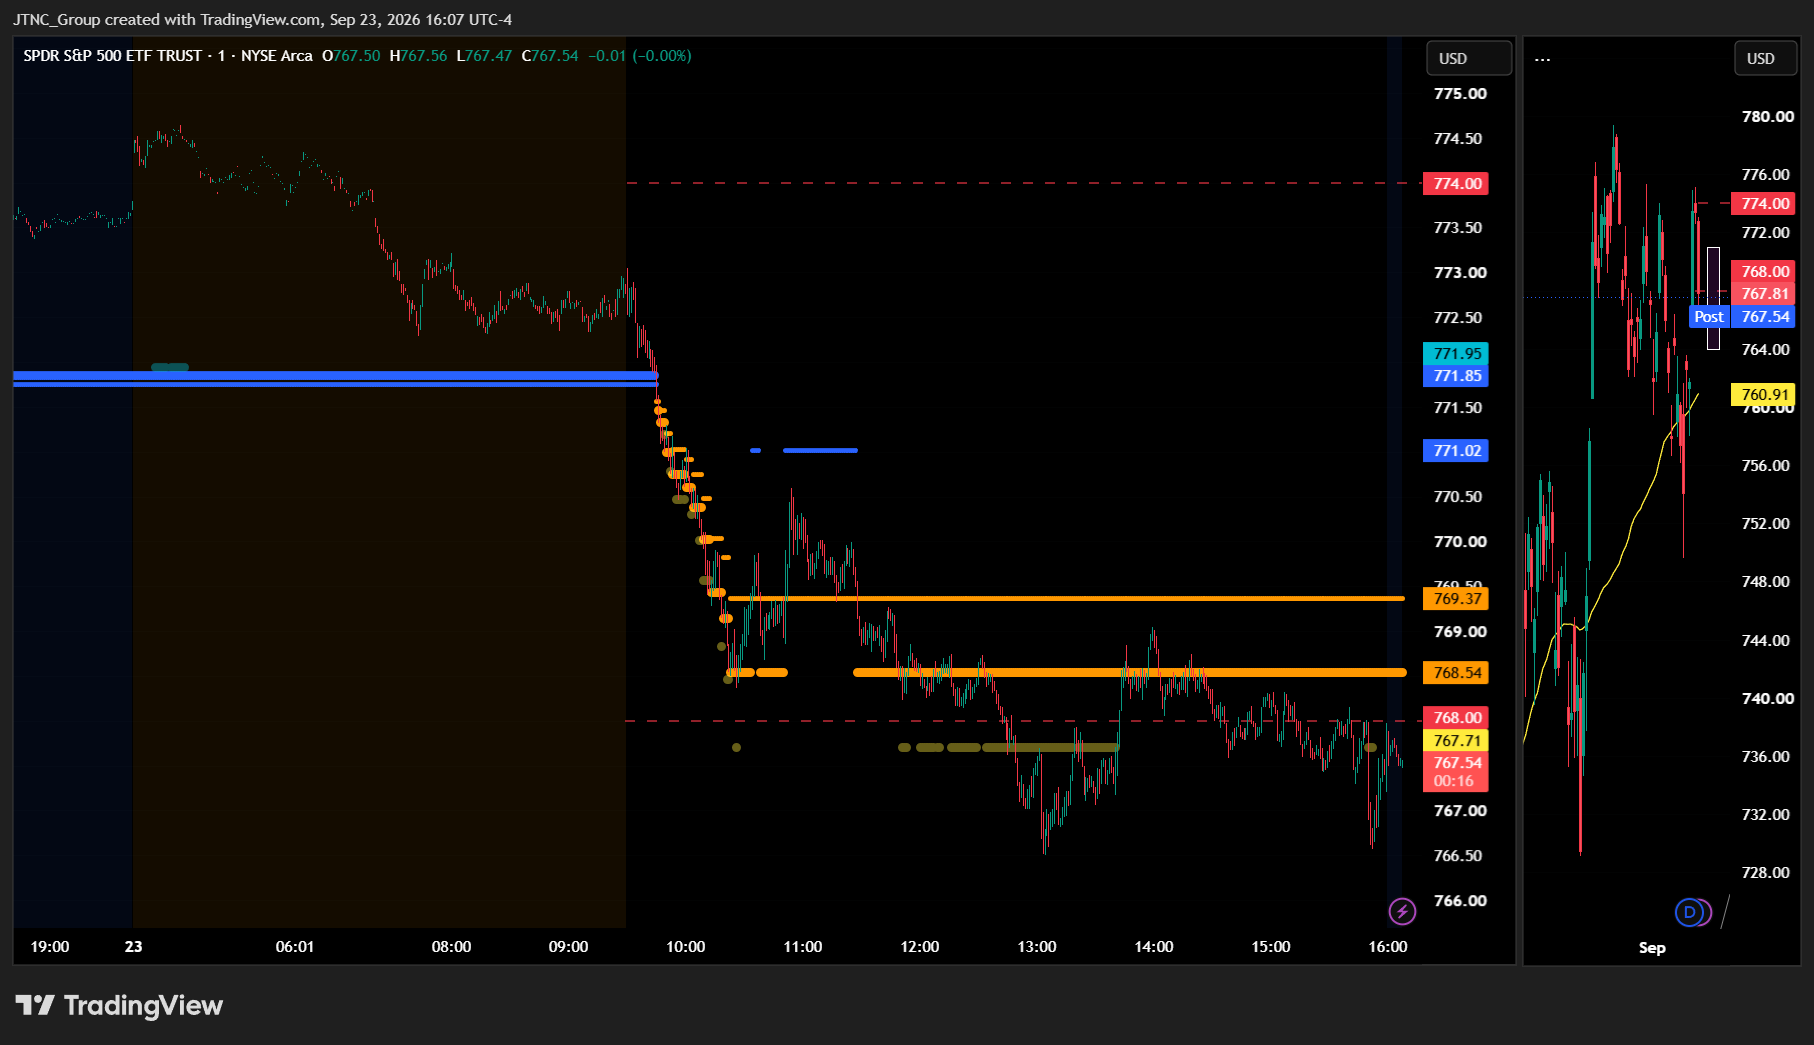
The MSI ended in a Bearish Trending Market State with SPY closing at $767.83. With SPY closing below MSI support, that $768.54 level now flips to resistance heading into Thursday. Extended targets were not printing at the close, which is a meaningful signal. Extended targets did print below during the AM session and continued through much of the PM session before fading, reflecting the aggressive selling pressure that dominated most of the day before subsiding. The MSI did not rescale overnight as the market drifted higher after the close, but by the open that move had completely disappeared and SPY found itself right at what had been MSI resistance. From there, the session turned decidedly bearish in the opening minutes as SPY began giving back a chunk of Monday's gains and kept falling. The MSI rescaled lower several times in rapid succession throughout the AM session, confirming the strength of the downtrend in real time. By the PM session the MSI stabilized and held steady in a Bearish Trending state with a narrow $0.83 spread, which is the key detail heading into Thursday. That narrow width, combined with the absence of extended targets at the close, implies a likely bottom forming in the current range. A retest of the day's lows is possible, but so is a rally to test MSI resistance. The market is likely to sell rallies as high as $772 with $760 serving as the line in the sand for major support. The MSI is forecasting Thursday to be likely sideways to possibly up as the narrow bearish state suggests consolidation rather than a continuation of strong trending. That said, the bears are likely to maintain downside pressure and any failure of MSI support could see SPY retest the session lows. MSI support is $768.54 with resistance at $769.37.
Key Levels and Market Movements:
Tuesday we stated, "Bulls want to see overnight price hold above $772.65 MSI support and continue pressing into new territory above the session high of $775.14," and added, "If the MSI maintains its Bullish Trending state with extended targets continuing to print above, there is very little structural resistance to slow the current ascent and traders should stay with the trend," while also noting, "Bears want to see $772.65 fail and the MSI rescale into a Ranging or Bearish state. If extended targets stop printing above and the MSI shifts lower, a cooling period toward $768.98 or even lower becomes possible." Wednesday delivered exactly the bearish scenario. SPY opened at $772.79, essentially right at what had been MSI resistance, and within the first few minutes of the session it became clear the overnight drift higher had no staying power. Price began falling almost immediately and barely looked back for the better part of the day. The MSI rescaled lower several times in rapid succession during the AM session as sellers pressed their advantage, and extended targets printed below for much of that early move, telling traders in no uncertain terms which side owned the session. The primary setup of the day was clear from the start — with SPY below the prior session's support at $772.65 and extended targets printing below, the trade was to sell any rally up to flipped resistance and target the premarket levels below since the MSI had no structural floor to define a downside target above the session's developing lows. SPY pressed all the way to a session low of $766.50 before finding some footing. The PM session brought a brief stabilization attempt, but even that recovery effort failed in the final hour as SPY retested the day's lows and closed at $767.83, down 0.72%, giving back roughly half of Monday's gains. Trading volume came in at 37.59 million shares, below average, and the VIX rose 2.02% to 15.17, reflecting a modest uptick in hedging demand as the tape softened. The MSI remained in a Bearish Trending state from open to close with extended targets fading before the PM session ended, leaving the close in a narrow, consolidating bearish range. At minimum it was a five-for-five session for traders following the framework, with multiple rescales each offering fresh shorting opportunities as the MSI redefined resistance levels lower throughout the day. It was an easy day to read and execute with substantial setups, all identified through proper context, patience, and flexibility while leveraging the MSI, premarket levels, and market structure rather than forcing trades. The MSI continues to prove its reliability as the cornerstone of our trading process.
Trading Strategy Based on MSI:
Thursday has light economic news so the market is likely to move more sideways than trend given the Bearish Trending state at the close. But with such a narrow range it is also likely the MSI rescales overnight and a short squeeze ensues which will push price back to test higher levels. The bears made a decisive statement on Wednesday, but the narrow $0.83 MSI spread is doing something important — it is signaling that the aggressive selling pressure has slowed and the market may be coiling for its next move rather than continuing to fall in a straight line. That cuts both ways and traders should respect that dynamic rather than assume the downtrend simply continues without interruption. Bears want to see $768.54 fail to hold as resistance on any overnight push and for sellers to press price back toward the session low of $766.50 and ultimately toward $760, which remains the key structural support level. If MSI resistance at $769.37 caps any attempted rally and the MSI maintains its Bearish Trending state with extended targets resuming below, then the path of least resistance remains to the downside and selling strength is the highest-probability approach. Bulls, on the other hand, want to see overnight price reclaim $768.54 and hold it as support rather than resistance. A sustained move back through $769.37 MSI resistance on elevated conviction would be a meaningful signal that the bears have exhausted their near-term edge and that a rally toward $772 is back on the table. If the MSI rescales higher overnight and extended targets begin printing above, traders should be willing to flip their bias and participate in the squeeze rather than stubbornly staying short into a shift. The most important thing to watch is whether $768.54 acts as a ceiling or gets reclaimed. As long as SPY remains below that level with the MSI in a Bearish Trending state, rallies should be treated with skepticism and sold into. Any dip that holds and produces a failed breakdown below the session lows with the MSI stabilizing would be a potential long setup, but confirmation is required before trading against the prevailing trend. With the narrow spread suggesting coiling action, Thursday is likely to start with indecision before resolving in one direction or the other, and the MSI will be the first and clearest signal of which side wins. The long-term bull trend remains intact above $640 and failed breakouts and failed breakdowns continue to offer the highest-probability setups. Remain flexible, avoid trading during Ranging Market States unless a clear failed breakout or breakdown presents itself, and ensure all trades are fully aligned with MSI signals. Providing real-time insights into market control, momentum shifts, and actionable levels, the MSI when integrated with our Pre-Market and Post-Market Reports continues to sharpen execution precision and elevate trade quality. If you haven't yet integrated MSI and our model levels into your process, now is the time. Contact your representative to get started as these tools are designed to support consistency and enhance performance.
Dealer Positioning Analysis
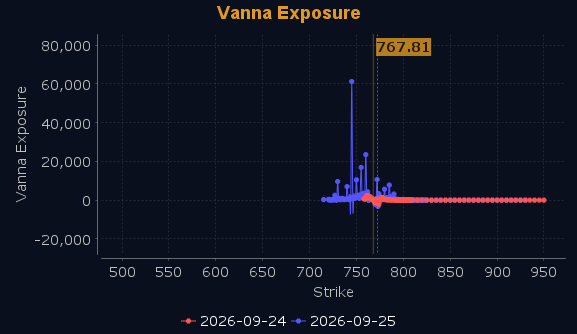
Dealers are selling SPY $776 to $805 and higher strike Calls while buying $768 to $775 Calls, indicating the Dealers' desire to participate in any rally that develops on Thursday. The ceiling for Thursday appears to be $776. To the downside, Dealers are buying $767 to $710 and lower strike Puts in a 3:1 ratio to the Calls they're selling, displaying moderate concern that prices could move lower. Dealers are no longer selling ATM Puts, so their desire to catch a rally is somewhat more wishful thinking than strong conviction. Below $770 is bearish and above $772 is bullish with everything in between acting as high-noise chop. Should SPY fail to reclaim and break above $770, expect the rally to be sold with a likely test of $765, with $760 in play. Should $760 fail, Dealers will press shorts and push SPY back to last week's lows. A break above the heavy Call wall at $772 could lead SPY back to a bullish environment with $775 as major resistance. Dealer positioning is unchanged at neutral/slightly bullish.
Looking Ahead to Next Friday:
Dealers are selling SPY $771 to $805 and higher strike Calls while buying $768 to $770 and $773 Calls, indicating their desire to participate in any rally and push above $772, which represents heavy resistance this week. The ceiling for the week appears to be $772. To the downside, Dealers are buying $767 to $715 and lower strike Puts in a 4:1 ratio to the Calls they're selling, reflecting meaningful concern that prices could move lower if key levels fail to hold. A failure to break above $770 will likely lead to a retest of the week's lows at $765, and a failure there will see SPY reach $760 where there is major support. Any failure at $760 will be met with heavy Dealer selling, which would bring SPY back to last week's lows at $750. A successful reclaim of $772, however, shifts the environment to bullish and prices will move higher until $775 where heavy resistance will contain price. For the week Dealer positioning is unchanged at bullish. We advise reviewing Dealer positioning daily for directional clues. These positions evolve quickly and tracking them is essential for staying ahead of shifting market sentiment.
Recommendation for Traders
With SPY closing at $767.83 and the 10-year yield pushing to 5.110, the risk environment is elevated — favor shorts below $770 and keep longs off the table until yields show signs of retreating. Tight stops are essential here.
Size down and stay disciplined — this is not the environment to be a hero. Review the premarket analysis posted before 9 AM ET for any changes in the model's outlook and Dealer Positioning.
Good luck and good trading!
