
Market Insights: Tuesday, September 22nd, 2026
Market Overview
Tuesday was a relatively quiet session on Wall Street, with the Nasdaq Composite notching its second straight record close — up 0.6% — while the S&P 500 edged slightly higher and the Dow dipped 0.1%. The muted action came as oil prices fell again and investors kept their eyes on Washington, where US and Chinese officials wrapped up preliminary talks ahead of Thursday's high-profile meeting between President Trump and Xi Jinping. Treasury Secretary Scott Bessent called those early conversations "very successful," lifting hopes for progress on AI cooperation and trade. Analysts, however, are tempering expectations — TD Cowen and others see the summit delivering small steps rather than breakthroughs, with the bilateral trade truce expiring in November and any tariff relief likely limited to a narrow set of less sensitive goods.
On the energy front, Trump stirred markets by voicing support for banning US diesel exports, saying "I've called for it within my people," while Bessent said he's actively studying whether a full or partial ban is feasible. Oil got a brief bounce after Trump offered little new detail on a US-Iran breakthrough at the UN General Assembly, though Brent and WTI still finished lower. The rare earths trade is also one to watch heading into the summit — William Blair's Neal Dingmann warned that ex-China rare earth stocks could swing sharply depending on how Trump and Xi characterize their negotiations, since China controls 91% of global rare-earth magnet refining. On the corporate side, AutoZone beat profit estimates but missed on revenue, Viking Therapeutics surged over 25% after its obesity drug showed 22% weight loss in trial patients, and PayPal popped more than 2% after announcing a partnership with Meta to let users shop via AI agents. Richmond Fed President Tom Barkin rounded out the day's headlines, reiterating that sticky inflation from tariffs and oil prices drove last week's rate hike and that further increases remain on the table.
SPY Performance
SPY opened at $774.03 and essentially went nowhere all session, which about sums up the mood in the market today. The high of $775.14 and the low of $772.59 gave traders a tight $2.55 range to work with, and price never made a convincing push in either direction. The close at $773.44 landed right in the middle of that range — not a sign of strength, not a sign of panic, just a market that showed up and did absolutely nothing. After yesterday's solid push higher, today felt like the bulls took the day off without handing the keys to the bears.
SPY finished down just 0.01%, which is about as flat as it gets without being perfectly unchanged. Volume came in at 30.35 million shares, well below average, meaning conviction was essentially absent on both sides of the tape. What makes today interesting, though, is the VIX — it dropped 3.77% to close at 14.31, a notable move considering price barely twitched. That disconnect between a calmer volatility reading and a directionless tape suggests the market may be quietly shedding some residual fear without needing a big up day to do it. Sometimes the most important thing a market can do is hold its ground, and today SPY did exactly that — just barely.
Major Indices Performance
The Russell 2000 took the top spot today with a solid 0.72% gain, which is actually an encouraging signal when you consider the broader backdrop. Small-caps are often the canary in the coal mine for risk appetite, and seeing them lead on a day where the overall market was essentially flat tells you there's still some underlying buying interest in more economically sensitive names. That kind of relative strength from the Russell deserves attention.
The Nasdaq followed with a 0.45% gain, a modest but respectable showing after the big surge it posted the prior session. Tech didn't have a clean day across the board, but the index held its ground well given the mixed performance from some of its heavier hitters. That's a sign of resilience rather than exhaustion, at least for now. The S&P 500 finished essentially unchanged on the day, confirming this was more of a rotation and digestion session than a directional one.
The Dow was the clear laggard, slipping 0.36% as some blue-chip names gave back ground. That divergence between the Dow's decline and the Russell's gain is an interesting tell — money wasn't flowing into the traditional defensive, large-cap stalwarts today. Instead, it was finding its way into smaller, more growth-oriented corners of the market. The VIX fell 3.77% to close at 14.31, continuing its drift lower and suggesting the market isn't particularly worried about near-term downside even as indices trade in different directions. Low volatility with mixed index performance typically points to a market in consolidation mode rather than one setting up for a big move in either direction.
Notable Stock Movements
Amazon took the spotlight in the wrong direction today, leading the Magnificent Seven lower with a -1.34% loss that set the tone for what was mostly a rough session for the group. It's a notable reversal from the unified green showing the complex put together in the prior session, and Amazon dragging the group is meaningful given the weight that name carries across both the Nasdaq and the broader mega-cap conversation. When the biggest drag is coming from a name that size, it creates friction across the tape that's hard to fully offset.
The broader Magnificent Seven picture was mostly red today, which stands in contrast to the cohesive, risk-on performance from the prior session. The exception came from Tesla, NVIDIA, and Apple, all of which managed to finish in the green and kept the damage from being worse. But three green names against a mostly red backdrop doesn't constitute the kind of unified momentum that moves markets — it reads more like isolated pockets of strength than a group firing on all cylinders.
This fractured showing from the Magnificent Seven fits the uncertain, directionless tone that defined the broader tape today. When the mega-cap core splinters like this, with some names pulling one way and others dragging in the opposite direction, it's difficult for any sustained trend to take hold. The conviction that had returned to this group so visibly in the prior session appears to have faded, at least for now, and with the complex struggling to find its footing, the broader market is left without the clear leadership it needs to push decisively in either direction.
Commodity and Cryptocurrency Updates
Crude oil took another major hit today, sliding 6.56% to close at $89.50. That's two brutal back-to-back sessions for black gold, though even with this kind of selling pressure, crude is still sitting comfortably above $70 — well above where longer-term expectations had pointed. The structural dynamics that drove prices into the nineties haven't fully unwound, and supply disruptions or geopolitical flare-ups can reverse momentum fast. A sustained presence above $70 keeps energy prices in the inflation conversation, and that's a headache the Fed doesn't need right now.
Gold flipped green today, edging up 0.48% to close at $4,405. After yesterday's modest pullback, this kind of bounce confirms the metal isn't ready to give up its elevated perch. The macro backdrop — persistent inflation uncertainty and global central bank demand — continues to underpin the trade. A fractional up day at these historically lofty levels is just gold doing what gold does: grinding higher with conviction.
Bitcoin had a quiet session after two explosive up days, slipping just 0.37% to close below $86,280. After back-to-back surges that had bulls feeling good, a near-flat day is about as close to a free pass as crypto ever gives you. The momentum built over the past two sessions hasn't been erased — if anything, a low-drama consolidation here is exactly what healthy price action looks like after a strong run.
Treasury Yield Information
The 10-year Treasury yield edged higher today, gaining 0.10% to close at 4.970. That's a small move, but directionally it's the wrong one. After yesterday's pullback gave bulls a brief exhale, today's tick back up serves as a reminder that yields aren't done making life difficult for equity investors. Closing at 4.970 keeps the 10-year just a whisker below the 5% line — and at this proximity, a single catalyst could push it through that threshold in a hurry.
The framework hasn't changed, and the message it's sending is uncomfortable. The 4.5% level that begins squeezing equity multiples is nearly 50 basis points in the rearview mirror. The 4.8% crossover that historically signals broader market selling is also behind us. And the 5% danger zone is sitting right at the doorstep. With yields hovering this close to 5%, the market is essentially one hot inflation print, one hawkish Fed comment, or one strong jobs number away from flipping back into the most dangerous zone in the framework.
What's notable is how little today's equity market reacted to the yield increase. The mixed session across major indices, with modest moves in both directions, suggests the market is in a kind of uneasy equilibrium — not panicking, but not comfortable enough to rally with conviction either. That's exactly what you'd expect from a market pinned just below 5% yields with no clear catalyst to push rates meaningfully lower.
The levels to watch remain unchanged. A sustained move back through 5% reignites the serious pressure signals. A push toward 5.2% would put a 20%-plus correction scenario back on the table. On the encouraging side, any meaningful retreat toward 4.8% would represent genuine relief. Right now, neither of those outcomes looks imminent — and that uncertainty is its own kind of pressure.
Previous Day’s Forecast Analysis
Yesterday's newsletter projected SPY to trade within a range of $760 on the downside and $774 as the max upside target, with Monday's close at $773.51 sitting near the top of that fourteen-point window and giving the session a bullish lean heading into Tuesday. The model flagged that upside was limited from the close price, raising the risk of a pullback to test support rather than a continuation surge. The defining level for the day was $770 — the major round number with the heaviest options concentration — which bulls needed to defend for the tape to remain constructive. A hold of $770 pointed toward $771 and ultimately $774 as the cap, while a breakdown put $766 in play first, then $765 as the critical floor and base of Friday's breakout. A clean loss of $765 was identified as the trigger that would open a fast path toward $762, with $760 as max downside.
On the strategy side, the VIX sitting at 14.80 kept risk-on positioning comfortable and 60-70% position sizing appropriate, with stops in the 0.75-1% range from entry. The preferred long setup was a controlled pullback into the $766-$768 zone that stabilized and reclaimed $769, targeting $773-$774 first and $778-$780 as a secondary target with broad participation. Stops on longs were placed below $764 to guard against a failed retest. On the short side, $773-$774 was the resistance zone to fade on a clean rejection, targeting $768-$769 initially and $764-$765 if sellers took control. Stops on shorts were set above $776, and chasing price above $775 at the open without volume confirmation was explicitly discouraged.
Market Performance vs. Forecast
Tuesday's session validated the forecast's structural read at the open and delivered a near-perfect range hold throughout the day. SPY opened at $774.03, right at the model's $774 max upside ceiling, and spent the entire session trading within a tight band that never violated the framework's key levels in either direction. The session's high of $775.14 represented a modest push just above the ceiling, and the close at $773.44 — essentially flat on the day, down just 0.01% — confirmed that price respected the projected range with precision. The forecast explicitly warned that "upside from here is limited" given Monday's close at $773.51 pressing near the top of the expected move, and Tuesday proved that read exactly right.
The directional analysis held up cleanly. The forecast identified $770 as the critical floor bulls needed to defend, and that level never came under pressure — price spent the session comfortably above it, confirming the constructive tone the model described. The caution against chasing price above $775 at the open without volume confirmation was well-placed, as the brief push to $775.14 failed to extend, consistent with the framework's warning that "gaps can fade sharply if buyers are not present in meaningful size." Below-average volume of 30.35 million shares reinforced exactly that dynamic — buyers weren't stepping in with conviction at new highs, and the tape drifted flat rather than accelerating. The forecast's ceiling held, the floor held, and the range framed by the model contained Tuesday's entire price action.
The VIX dropping 3.77% to 14.31 continued and accelerated the vol compression trend the forecast described, pushing further into the comfortable risk-on zone. That deepening compression validated the model's read on systematic and options-driven positioning, and it keeps the 60-70% sizing framework intact heading forward. The framework's ability to correctly identify both the ceiling and the structural support heading into Tuesday is the durable edge, and that precision carries directly into Wednesday's setup.
Premarket Analysis Summary
The premarket analysis posted at market open set SPY's projected range for the session between $769 as max downside and $782 as max upside, with spot entering at $774.08 in a call-dominated tape extending the prior day's push through $770 that had run straight to the top of the expected move. The expected move had tightened to five points, signaling contained ranges unless one side forced the issue. The defining level was $775 — identified as the gate right above spot, the heaviest concentration on the board, and the critical hold for bulls to extend the run. Clearing and holding $775 pointed toward $776 as the first target, $777 as the next decision point, $780 as the major round number where price should want to stall, and $782 as max upside. On the downside, $773 sat right beneath spot as the first watch level, $772 was the next decision point, $770 was identified as the most important floor below — yesterday's gate now serving as the line holding the entire run together — and $769 was max downside at the bottom of the expected move. The burden was placed squarely on sellers, with the analysis noting that holding $773 meant $775 would get tested early, while losing $772 would bring a quick trip to $770.
The market spent the session caught in the middle of the framework without conviction in either direction. SPY opened right at $774.03, made a brief push toward the defining $775 level but topped out at $775.14 — just barely tagging it without the clean hold needed to extend the run — then reversed and drifted lower, slicing through $773 and touching a session low of $772.59 before settling at a close of $773.44, essentially unchanged on the day. The tightened expected move had flagged that consolidation was normal after such an extended run, and that's exactly what the session delivered. The VIX dropping 3.77% to 14.31 reflected the calm, low-conviction chop rather than any real directional pressure from either side.
Validation of the Analysis
Today's session gave traders a textbook example of how the premarket framework earns its keep, even on a day where the tape didn't hand out easy money. SPY opened at $774.03, essentially right on top of the 774.08 spot price flagged before the bell, and immediately began testing the structure laid out in the analysis. The premarket put 775 front and center as the defining gate — the level bulls needed to clear and hold to keep the run going. Price pushed up to a high of $775.14, tagging that zone almost to the penny, but failed to hold it. That was the precise scenario the analysis warned about: "failing there is where the first real pullback starts." Sure enough, the rejection at 775 was the signal.
From there, the downside road map took over just as cleanly. The framework identified 773 as the first level to watch beneath spot, then 772 as the next decision point. SPY obliged, pulling back through 773 and pressing all the way to a low of $772.59 — right between the 772 and 773 levels called out before the open. Critically, 770 held as the floor the analysis designated as the "line in the sand," and the tape never seriously threatened it. The close at $773.44 landed squarely in the middle of the defined range, confirming sellers couldn't break the structure either. The VIX dropping 3.77% to 14.31 reflected an orderly, controlled session — exactly the kind of contained, range-bound action the premarket anticipated when it noted that "some consolidation would be normal" after an extended run. Traders who came in with the framework had every key turn mapped out before the first print.
Looking Ahead
With the economic calendar showing no high-impact releases confirmed for Wednesday, traders get another session to let price action do the talking without a scheduled macro event forcing a reaction. No Fed speakers flagged, no tier-one data prints on deck — just the market continuing to digest wherever Tuesday's session leaves things and deciding whether the recent tone deserves follow-through or a fade.
That kind of setup keeps the focus squarely on technical levels and internal market behavior. Whether buyers show up with conviction or sellers press any weakness will reveal more about underlying sentiment than any headline could right now. The approach stays the same — let the tape confirm a direction before committing, manage risk around key levels, and resist the urge to front-run a move the market hasn't validated yet.
Market Sentiment and Key Levels
The directional bias today is essentially a coin flip leaning slightly bearish — a -0.01% close on below-average volume with mixed index performance doesn't hand control convincingly to either side, but the weight of the evidence tilts toward caution. The VIX dropping 3.77% to 14.31 is the most constructive data point of the session, signaling that fear is quietly bleeding out of the market even as price goes nowhere fast. That's not nothing — low and falling volatility in a sideways tape can be a setup for a breakout if the right catalyst shows up. But the Dow's -0.36% decline alongside crude oil's sharp selloff and Bitcoin's slight slip suggests the tape is digesting, not accelerating. The Nasdaq's modest 0.45% gain and the Russell 2000's 0.72% pop do provide some underlying optimism, hinting that growth and small-cap traders aren't ready to throw in the towel just yet.
Key resistance sits at $775.14, the session high that SPY touched but couldn't sustain. A clean break and close above that level on expanding volume would open the door toward the $776 to $778 range, where prior overhead supply is likely to create friction and draw in sellers. On the downside, $772.59 — today's intraday low — is the immediate floor to watch. A decisive break below that level would suggest buyers are losing the will to defend this range and could invite a test of the $770 to $768 zone, where bulls would need to make a meaningful stand. The 10-year yield sitting at 4.970 remains just a whisker away from the psychologically important 5% threshold, and any move through that level would almost certainly be the dominant force driving risk sentiment lower. Gold's 0.48% gain to $4,405 reflects a quiet bid for safety that shouldn't be ignored. Bulls have the low-volatility environment working in their favor, but they need a credible catalyst and real volume to turn this sideways grind into something more convincing.
Expected Price Action
Wednesday's session brings actionable intelligence generated by our AI model, with SPY projected to trade within a range framed by $769 on the downside and $782 as the max upside target. That thirteen-point window keeps this in trending territory — traders should expect a directional move rather than a sideways grind, and walking in with a direction in mind before the open is essential. Tuesday's close at $773.44 sits in the middle of the projected range, which gives the bias a neutral lean with a slight bullish tilt, though price is caught right between meaningful support below and meaningful resistance above, making the first decisive move of the session the one that sets the tone for the day.
The defining level heading into Wednesday is $775 — the gate sitting just above current price and the heaviest concentration on the board. Bulls need to clear and hold $775 for this tape to stay constructive; if spot pushes through that level with conviction, $776 becomes the first target, $777 the next decision point, and $780 the major round number where price should stall and where bulls really need to plant a flag for the next leg higher. $782 stands as the model's max upside. On the downside, $773 is the first level to watch, with $772 as the next decision point beneath it. The critical floor is $770 — the level that held this entire run together and the line in the sand for bulls. A clean break below $770 puts the recent move in serious question and opens a fast path toward $769, the model's max downside. With VIX dropping to 14.31, the tape is relatively calm, but the burden here is on bulls to take out $775 early — hold it and Wednesday extends the trend; lose $772 and the trip to $770 happens fast.
Trading Strategy
The VIX dropping 3.77% to 14.31 is a meaningful compression in implied volatility, and at that level the options market is essentially telling you that traders see very little near-term risk on the horizon. That kind of reading supports a risk-on posture, but it also demands respect — when the VIX gets this low, even a modest negative catalyst can produce an outsized snap higher in vol that catches complacent longs off guard. A move back above 17 would be the first real warning sign to start trimming net long exposure and tightening stops. Until that threshold is threatened, 60-70% position sizing remains appropriate with stop-losses in the 0.75-1% range from entry — tight enough to protect capital without getting whipsawed by routine intraday noise on a quiet, low-conviction tape.
In a rising market scenario, the level to watch on the long side is a controlled pullback into the $769-$771 zone, where the tight intraday range from today's nearly flat close suggests buyers and sellers are in equilibrium. A dip into that area that stabilizes and reclaims $772 intraday is the preferred long entry, targeting $775.14 as the first profit zone — the session's high — and $778-$780 as a secondary target if momentum builds with broad participation behind it. Stops on longs belong below $767 to guard against a failed support retest that turns into a more meaningful breakdown. Do not chase price without confirming volume behind the move — in a subdued tape, extended openings can fade sharply when buyers lack conviction.
In a falling market scenario, $774-$775 becomes the resistance band to fade, and a clean rejection on the first morning push into that zone is the short trigger. That setup targets $770-$771 as the initial profit zone, with $767-$768 available if sellers establish control and buyers fail to hold the equilibrium range. Stops on shorts belong above $776 to protect against a squeeze through the session high. If the tape opens weak and breaks below $772 without a meaningful bounce attempt, that is an actionable short entry at reduced size. With the VIX at 14.31 and trending lower, the risk of a sharp short squeeze on any positive headline remains real — cover into support in layers and avoid overstaying short positions in a vol environment this compressed, because reversals can be swift and unforgiving when everyone is leaning the same direction.
Model’s Projected Range
SPY's projected maximum range for Wednesday is $769 to $778, with the Call side dominating in an expanding band that suggests trending price action with intermittent chop. Wednesday brings PMI Flash data which could move markets if it surprises. SPY closed at $773.44, down 0.24% on the day, after opening at $774.03 and trading between a high of $775.14 and a low of $772.59 on average volume. SPY is trading near the middle of the $769 to $778 range, with the post-FOMC rate cut rally digesting and consolidating after last week's strong advance. The long-term bull trend remains intact above $640 with SPY well above structural support. As long as price holds above key structural levels, this remains a broader dip-buying environment. If our first resistance at $774 breaks, price targets $775, while a break of first support at $772 would target $771. Should $769 fail to hold, there is little to keep price from falling toward $765. Absent a catalyst, resistance sits at $774, $775, $778 and $780 with support at $772, $771, $770 and $769. The VIX closed at 14.31, down 3.83%, reflecting continued calm as the market digests the recent rally. SPY closed above the upper trend channel with structural support well below current price levels.
Market State Indicator (MSI) Forecast
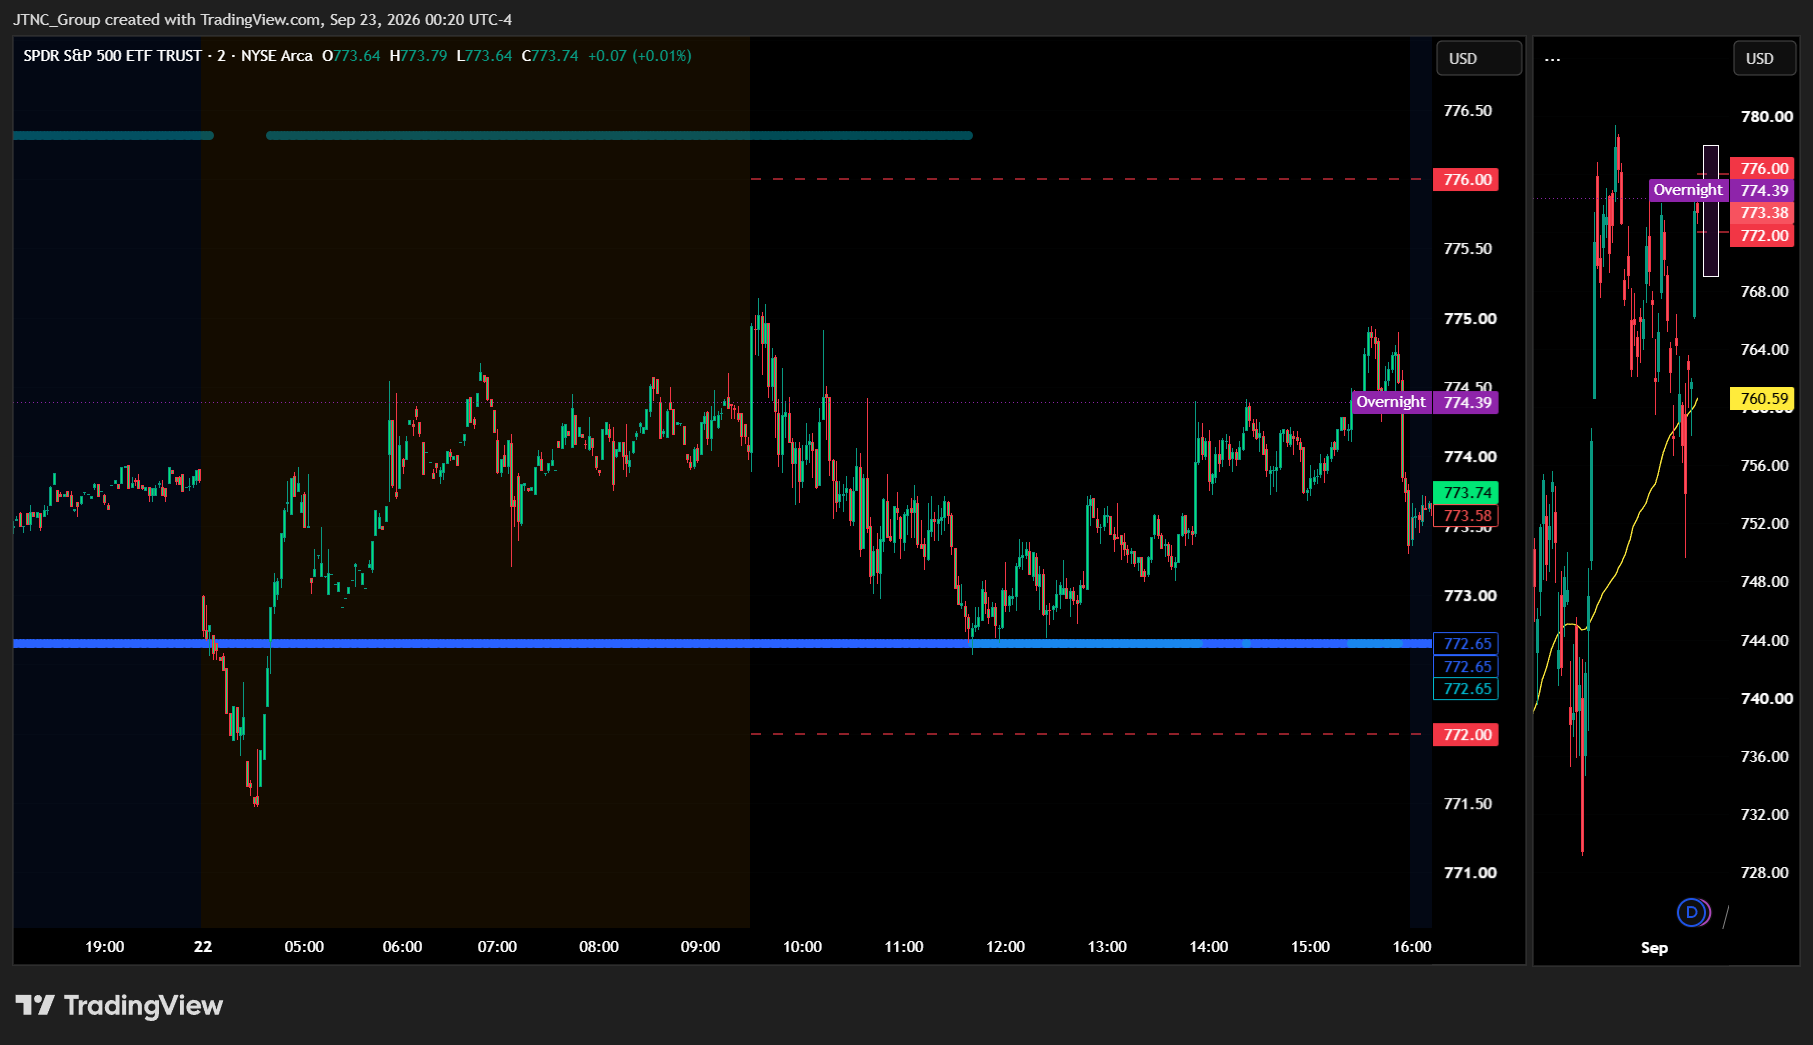
Current Market State Overview:
The MSI ended in a Ranging Market State with SPY closing at $773.44. Since SPY closed inside the MSI range, support remains at $772.65 and resistance remains at $774.39 heading into Wednesday. Extended targets were not printing at the close. Extended targets were active during premarket printing above as the MSI opened in a wide bullish state keeping price elevated near $775, and then below during the AM session as the MSI reversed sharply driving price down to a brief low just under $772 before the bulls stepped back in. The MSI opened overnight in a wide bullish state with extended targets above keeping price elevated through the premarket session near $775. At the open, however, the MSI reversed sharply with extended targets below driving price down to a brief low just under $772 before the bulls stepped back in. The MSI began rescaling higher with price steadily recovering back toward $774.50 through midday but failed to hold a bullish state and settled into a wide $1.74 Ranging state into the close with price consolidating between $772.65 and $774.39. Without extended targets at the close, the MSI is forecasting sideways consolidation on Wednesday with the ranging state suggesting price will likely remain range bound between $772.65 and $774.39 absent any new external catalyst. MSI support is $772.65 with resistance at $774.39.
Key Levels and Market Movements:
Friday we stated the MSI was forecasting a strong continuation higher and Tuesday delivered a session that initially confirmed then reversed that outlook. SPY opened at $774.03 and quickly pushed to a session high of $775.14 with the MSI in a bullish state and extended targets above — a continuation of Friday's momentum. But the move above $775 lacked follow-through and the first trade emerged as the MSI reversed sharply with extended targets below, driving price from $775 to $772.59. Once extended targets stopped printing below, the second setup materialized as SPY bounced off the lows and recovered back toward $774 as the MSI rescaled higher through midday. The close at $773.44 in a wide Ranging state confirmed that neither side had won the day. SPY fell 0.24% with the VIX dropping 3.83% to 14.31. At minimum it was a two-for-two session for traders following the framework. It was an easy day to read albeit not an easy day to trade given the tight choppy range. But substantial setups were present, all identified through proper context, patience, and flexibility while leveraging the MSI, premarket levels, and market structure rather than forcing trades. The MSI continues to prove its reliability as the cornerstone of our trading process.
Trading Strategy Based on MSI:
Wednesday brings PMI Flash data which could introduce some volatility. The wide $1.74 Ranging state at the close suggests sideways consolidation with price likely remaining range bound between $772.65 and $774.39 absent any new catalyst.
Bulls want to see overnight price hold above $772.65 MSI support and push toward $774.39 resistance. If the MSI rescales into a Bullish Trending state with extended targets above, the consolidation breaks higher and price could push toward $776 and beyond. Bears want to see $772.65 support fail and the MSI rescale into a Bearish Trending state. If extended targets print below, price could test $770 and lower levels. Given the Ranging state, failed breakouts and failed breakdowns at either MSI boundary are the highest-probability setups.
The long-term bull trend remains intact above $640 and failed breakouts and failed breakdowns continue to offer the highest-probability setups. Remain flexible, avoid trading during Ranging Market States unless a clear failed breakout or breakdown presents itself, and ensure all trades are fully aligned with MSI signals. Providing real-time insights into market control, momentum shifts, and actionable levels, the MSI when integrated with our Pre-Market and Post-Market Reports continues to sharpen execution precision and elevate trade quality. If you haven't yet integrated MSI and our model levels into your process, now is the time. Contact your representative to get started as these tools are designed to support consistency and enhance performance.
Dealer Positioning Analysis
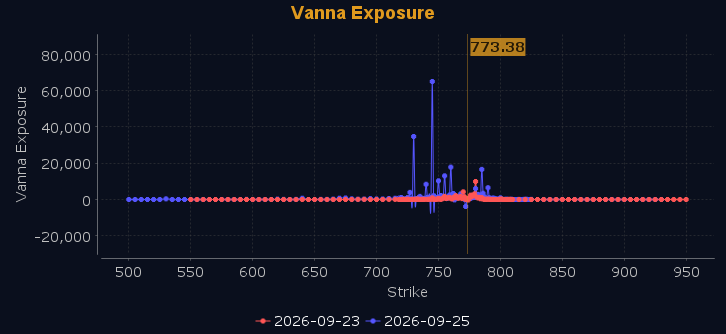
Dealers are selling SPY $775 to $810 and higher strike Calls, indicating the Dealers see a ceiling above for Wednesday. The ceiling for Wednesday appears to be $776. To the downside, Dealers are buying $772 to $710 and lower strike Puts in a 3:1 ratio to the Calls they're selling, displaying moderate concern that prices could move lower. Notably, Dealers are selling ATM Puts in size at $768 to $773, indicating their belief that prices will continue to remain supported above $772 on Wednesday. Dealers do not sell ATM Puts unless they believe there is a floor in the market at $765. They remain flat on upside Call buying, implying limited near-term breakout conviction and a preference for harvesting theta premium decay. Below $772 is bearish and above $774 is bullish with everything in between acting as high-noise chop. Should SPY fail to hold the $772 support line, expect a fast test of the $770 psychological zone, with the $768 to $771 region acting as a highly choppy environment full of traps. Dealer positioning is unchanged at neutral/slightly bullish.
Looking Ahead to Next Friday:
Dealers are selling SPY $775 to $815 and higher strike Calls for the week ahead. The ceiling for the week appears to be $785. To the downside, Dealers are buying $772 to $715 and lower strike Puts in a 4:1 ratio to the Calls they're selling, displaying heightened concern that prices could move lower. Dealers are aggressively selling puts down the option chain at $768 to $774 to capture high premium melt while keeping their broader downside macro hedges rolled back. Dealers do not sell ATM Puts unless they believe there is a floor in the market at $768. Two towering positive open interest walls have locked into place at the $730 and $745 strikes serving as massive backstop anchors further down, while the localized flat distribution near the current spot price indicates a very low probability of an impending systemic crash. We remain structurally bullish above $768, but a complete break beneath $768 flips the market back into a macro bearish regime. Clearing above $775 maps a route to a macro target of $785, leaving the wide intermediate space as an ideal two-way premium-churning zone. For the week Dealer positioning has changed to neutral/slightly bullish. We advise reviewing Dealer positioning daily for directional clues. These positions evolve quickly and tracking them is essential for staying ahead of shifting market sentiment.
Recommendation for Traders
With SPY closing at $773.44 and VIX cooling to 14.31, the tape is relatively calm but yields sitting at 4.970 keep the risk real. Favor longs above $773.44 with tight stops below $772.59, and stay defensive if yields crack above 5%.
Keep position sizes manageable — one hawkish data point can reverse this quickly. Review the premarket analysis posted before 9 AM ET for any changes in the model's outlook and Dealer Positioning.
Good luck and good trading!
