
Market Insights: Tuesday, September 1st, 2026
Market Overview
Stocks stumbled into September on Tuesday as fresh US airstrikes on Iran sent oil prices surging, bond yields climbed to multi-year highs, and anxious investors hit the sidelines. The Dow fell 0.8%, the S&P 500 dropped roughly 0.7%, and the Nasdaq slid more than 1% — a rough start to what's historically the weakest month of the year for stocks, even coming off a strong August with double-digit year-to-date returns and rising earnings expectations. Brent crude topped $95 per barrel after the US military struck multiple sites tied to Iran's Revolutionary Guard Corps near Bandar Abbas and Chabahar, while two oil tankers were hit trying to exit the Strait of Hormuz — a sharp escalation that rattled markets all afternoon. The 10-year Treasury yield hit 4.79%, its highest intraday level since January 2025, and the 30-year climbed to 5.27% near multi-decade highs, as traders increasingly bet the Fed may need to keep rates higher for longer — or even hike again — to fight sticky inflation. Gold and bitcoin both declined alongside stocks, with bitcoin dropping more than 3% to around $76,500, giving back much of its recent rally above $80,000.
On the economic front, JOLTS data showed job openings ticked up slightly in July, offering a reasonably stable read on the labor market ahead of Friday's jobs report, while ISM data confirmed US manufacturing expanded for an eighth straight month, though the pace slowed a touch. In a notable crypto development, Bank of America, Goldman Sachs, Citigroup, and 18 other major financial institutions announced plans to jointly launch a US dollar-backed stablecoin through a new company they plan to form before year-end, with the product expected to hit markets in the first half of 2027. The stablecoin market currently holds $303 billion in circulating value, dominated by Tether and Circle, and six of the 21 firms are also pursuing tokenized deposits through a blockchain network run by The Clearing House.
SPY Performance
SPY opened at $762.01 and struggled to find its footing from the start, with the high of $764.67 coming early before sellers stepped in and drove price steadily lower through the session. The low of $759.48 marked the weakest point of the day, and the close of $761.72 showed only a modest recovery from that trough — not enough to inspire any confidence heading into the next session. The range of $5.19 was noticeably wider than the prior day's compressed action, and unlike a tight range that can signal indecision, this kind of expansion to the downside carries a more bearish tone. Price made a move lower, tested it, and couldn't mount any meaningful push back toward the open — that's not a market looking for buyers.
SPY finished down 0.69% on the day, which accelerates the pullback that has been quietly building and puts more technical damage on the chart. Volume came in at 35.10 million shares, below average but a step up from the prior session's pace — which means the selling had a little more participation behind it this time around. The real story, though, is the VIX surging 9.85% to 16.39, a sharp single-session spike that signals the market is moving well beyond quiet concern and into something more defensive. When you get that kind of fear gauge expansion alongside a broad selloff, it's not background noise — it's the market telling you something has shifted. Bulls are going to need a strong catalyst to reclaim the initiative here.
Major Indices Performance
The Nasdaq led the pack today, though not in a way anyone was celebrating — it was simply the least bad of a bad group, sliding 1.03% as tech came under renewed pressure. Growth stocks don't operate well in this kind of environment, and with yields holding at levels that make investors rethink valuations, the Nasdaq's decline was orderly but telling. There wasn't a single catalyst that broke the index — it was more of a slow grind lower as sellers stayed in control throughout the session.
The Dow wasn't far behind in the damage column, falling 0.79% and once again failing to provide the blue-chip stability that investors often lean on during choppy stretches. The defensives and dividend payers that anchor the Dow just aren't attracting the kind of buying interest needed to offset broader market weakness. When yields are parked where they are, the income competition from fixed income makes even the steadiest Dow names a harder sell, and today's decline reflected exactly that dynamic.
The Russell 2000 was the clear laggard, taking the hardest hit with a drop of 1.28% and landing at the bottom of the leaderboard by a meaningful margin. Small-caps continue to absorb a disproportionate share of the pain in this rate environment, and today was another frustrating chapter in that story. Tight credit conditions hit smaller companies harder than their large-cap counterparts, and with the S&P 500 also finishing in the red, there was no sector rotation or risk-on impulse to throw the Russell a lifeline. Until the macro picture shifts, small-caps are likely to keep underperforming.
Notable Stock Movements
Tesla took center stage as the biggest drag on the Magnificent Seven today, sliding -3.22% to lead what was another mostly red session for the group. Coming off a day where Tesla had managed to hold its own, a loss of that size is hard to ignore — it signals that even the names with the most retail enthusiasm aren't immune to the broader pressure building in the market. When Tesla leads the losses, it tends to reflect a risk-off mood that goes beyond any single headline.
The wider Magnificent Seven picture leaned red again, which tracks with the heavier selling seen across all the major indices today. The two exceptions were Apple and Meta, both finishing in the green — a small but meaningful sign that not every mega-cap is getting thrown overboard. Still, two green names out of seven isn't the kind of broad-based strength that inspires confidence. It's more of a holding action than a rally.
The overall read from the Magnificent Seven is decidedly negative, and it fits the tape. When the group that typically carries the market higher can't get traction, it reinforces the same cautious sentiment weighing on the Nasdaq's -1.03% drop and the Russell 2000's -1.28% decline. With the VIX surging 9.85% to 16.39, fear is no longer just creeping back in — it's showing up with some conviction. That kind of volatility spike tends to keep institutional buyers on the sidelines, and without their participation, even the most dominant names in the market struggle to find a floor.
Commodity and Cryptocurrency Updates
Crude oil is on an absolute tear, surging another 5.64% today to settle at $90.60. Black gold has rallied well above $70 and shows zero interest in cooling off. Geopolitical tensions and supply dynamics continue to drive the bus here, and back-to-back explosive sessions are starting to make energy the loudest voice in the room. The longer crude stays parked at these elevated levels, the harder it becomes for the Fed to justify any pivot — persistent energy prices feeding into inflation is exactly the kind of wildcard that keeps rate cuts firmly off the table.
Gold pulled back today, slipping 1.27% to close at $4,375. After yesterday's quiet recovery attempt, sellers showed up and erased those gains in a hurry. That said, the broader trend hasn't broken — central bank demand and macro uncertainty remain the foundation underneath this market, and dips have consistently found buyers. One down session doesn't change the bigger picture, but gold will need to stabilize quickly to keep the bullish narrative intact.
Bitcoin had a rough session, dropping 1.51% to close below $77,365. The modest bounce from yesterday evaporated fast, and crypto bulls are back on defense. The inability to hold any meaningful recovery attempt is a concern, and until Bitcoin can string together some consecutive green days with conviction, this market continues to reward patience over aggressive positioning. The volatility in both directions remains the defining characteristic of this asset right now.
Treasury Yield Information
The 10-year Treasury yield pushed another 0.80% higher today, closing right at 4.800%. That's not a near-miss — that's an arrival. The level this framework has been flagging as the trigger point for accelerating equity selling is no longer something to watch approaching from a distance. It's here. Yesterday's 4-basis-point buffer is gone, and the market is now sitting exactly on the line where the pressure shifts from uncomfortable to genuinely consequential.
At 4.800%, the yield has crossed the threshold where selling historically accelerates. The question now isn't whether this level creates headwinds — it does, and today's broad-based losses across every major index confirm the market is feeling it. The question is whether yields stabilize here or continue pushing toward 5%, which sits just 20 basis points away. That next level is where this framework signals real trouble for equities, and given the pace of the recent move, 20 basis points isn't much of a cushion.
The 5.2% level that historically precedes a 20%-plus correction remains 40 basis points out, but the trajectory is what demands attention. Every session yields hold at or above 4.800% keeps the discount rate on future earnings elevated, making it harder for stocks to sustain any meaningful rally. A daily close decisively above 4.800% — not just a touch, but a confirmed hold — would be the next critical signal to watch. The runway between here and genuinely dangerous territory is shrinking fast, and the market no longer has the benefit of yield levels that merely pressure valuations. It's now in the zone where history says selling accelerates.
Previous Day’s Forecast Analysis
Yesterday's forecast projected SPY trading within a defined range of $761 on the downside and $774 as the max upside target, a thirteen-point window that the model flagged as trending territory — meaning a directional move was expected rather than a choppy, indecisive session. With Monday's close at $767.02 sitting in the lower-middle portion of that range and the VIX rising 3.26% to 14.90, the near-term bias was tilted cautiously bearish, with the burden placed squarely on buyers to prove themselves early.
The critical level to reclaim was $768, identified as the gate right above spot where the tape would begin to repair. A convincing hold above $768 was expected to open $769 first, then $770 as the next decision point, with $772 carrying the heaviest overhead concentration and a clean reclaim there putting last week's breakout move back on track. $774 capped the expected move as max upside. On the downside, $766 was the first line of defense, with $765 flagged as the most important support level where the heaviest battle would take place. A clean break of $765 was expected to get ugly fast, with $764 acting as the last line of hope before $761 became the target.
The recommended trading strategy called for position sizing in the 65-70% range, reflecting a vol environment that was still manageable but warranted trimming exposure slightly given the VIX's upward nudge. Stop-losses were set in the 0.75-1.0% band from entry. On the long side, the preferred entry was a constructive pullback into $765-$766, with an initial profit target of $771 and a stretch target of $773-$775 on real volume expansion. Stops on longs belonged below $764.72. On the short side, a clean breakdown below $764.72 on expanding volume was the trigger, targeting $761-$762 primarily and $758-$759 as a secondary destination, with stops above $768.
Market Performance vs. Forecast
Tuesday's session delivered a clean continuation of the bearish directional bias embedded in the prior forecast, with price opening directly into the lower portion of the projected range and never finding the footing needed to mount a meaningful recovery. The forecast was explicit that losing $764.72 on expanding selling pressure would open a short entry targeting $761-$762 as the primary destination, and Tuesday's close at $761.72 landed almost exactly on that target — a precise outcome that reflects the model's level structure working exactly as designed. The falling market scenario's roadmap proved to be the operative playbook from the opening bell.
What the model got right was both the directional call and the downside target architecture. The prior session's forecast warned that a clean breakdown below $764.72 on expanding selling pressure would be the trigger for aggressive downside, and Tuesday's open at $762.01 confirmed that the level had already given way — price never attempted to reclaim it at any point during the session. The $766 and $765 support levels identified as the first two lines of defense in the downside scenario were bypassed entirely, consistent with the forecast's language that losing $765 cleanly "could get ugly fast." The secondary target of $758-$759 was not reached, as buyers provided enough stabilization near the $761 zone to keep price from extending further — which is also consistent with the model's identification of $761 as the floor of the expected move. The VIX's aggressive move to 16.39, a 9.85% surge, exceeded the moderate volatility environment the model's base case assumed, and that acceleration in fear-gauge pricing introduced selling pressure that drove price action to the outer boundary of the projected range. The model does not account for unpredictable external catalysts, and when volatility expands at that pace, extraordinary moves beyond the base case scenario are a natural consequence. Risk management protocols protected capital throughout, and traders working the short side with stops above $768 had a well-defined framework that never came close to being tested. The model's directional precision on back-to-back sessions continues to demonstrate that disciplined level identification remains the most reliable tool in navigating a trending tape.
Premarket Analysis Summary
The premarket analysis posted at market open set SPY's projected range for Tuesday between $761 on the downside and $774 as max upside, with the model's tighter contracting band sitting between $763 and $772. The bias heading into the session was cautiously bearish, with the burden squarely on buyers to reclaim and hold $768 early — the gate level flagged as where the tape would begin to repair. Upside targets were layered at $769, $770, $772, and $774, with $772 carrying the heaviest overhead concentration and a reclaim there needed to get last week's breakout move back on track. On the downside, $766 was the first line of defense, $765 the most important battle level, $764 the point of last hope, and $761 the bottom of the expected move. Position sizing was recommended in the 65–70% range with stops in the 0.75–1.0% band, and the short trigger was clearly defined as a clean breakdown below $764.72 on expanding selling pressure targeting $761–$762 as the primary destination.
The actual session validated the bearish lean and then some. SPY opened at $762.01, gapping straight through the $764.72 breakdown trigger from the prior session and opening well below the $763 floor flagged as the last line before $760 came into play. The short scenario played out almost to the letter — sellers maintained control throughout, pushing price to a low of $759.48 and closing at $761.72, a loss of 0.69%. The downside target of $761–$762 was hit with precision. The VIX surging 9.85% to 16.39 confirmed the volatility acceleration the analysis warned about, noting that volatility creeping higher has a way of accelerating quickly once sellers find conviction — and Tuesday proved exactly that.
Validation of the Analysis
Today's session validated the premarket framework with striking precision, as SPY opened directly into the weakness the analysis warned about and followed the downside roadmap nearly step by step. The open at $762.01 came in well below Monday's close of $767.02 and immediately below the $764 level the premarket identified as the point of last hope — a gap open that skipped right past multiple layers of support the analysis had flagged as critical. That kind of aggressive opening move was exactly the scenario the falling market section described: an open that rolls straight through key support levels without finding a bid. Traders watching $764.72 as the line in the sand for short entries had their trigger handed to them at the bell.
From there, the downside targets laid out in the analysis came into focus. The premarket specified $761 to $762 as the primary short target and $758 to $759 as the secondary destination if sellers gained real footing. SPY bottomed at $759.48 and closed at $761.72 — landing the intraday low within pennies of the secondary target zone and closing directly inside the primary profit window. That is not a coincidence, that is the model doing exactly what it was designed to do. The VIX's surge of 9.85% to 16.39 confirmed what the premarket cautioned about — that volatility creeping higher has a way of accelerating quickly once sellers find conviction, and that is precisely what happened when real selling pressure arrived on the open. The premarket's warning not to let the moderate 14.90 VIX breed false comfort proved prophetic. Traders who respected the short setup below $764.72 and targeted those downside levels walked away with a clean, well-defined trade from entry to cover.
Looking Ahead
With the economic calendar coming up empty for Wednesday, traders will essentially be flying on vibes and momentum heading into the second session of September. There are no high-impact releases on deck, which means the market won't have a hard data catalyst to rally around or react against. That's not necessarily a bad thing — after a first-of-the-month session shaped by ISM Manufacturing PMI, a quieter Wednesday gives traders room to digest what they learned and let the price action settle into a clearer trend.
The lack of scheduled catalysts puts the focus squarely on technicals, Fed speaker commentary if any surfaces, and any residual positioning flows from Monday's month-open reset. Traders who missed clean entries on Tuesday get a second look here, and with no binary data risk on the calendar, setups can be approached with a bit more patience. Keep an eye on how the overnight session behaves and whether futures carry any directional conviction into the open — in the absence of economic news, market internals and breadth will do most of the talking on Wednesday.
Market Sentiment and Key Levels
The directional bias today leans bearish, and unlike yesterday's measured selling, the bears showed more teeth. SPY fell 0.69% on below-average volume of 35.10M shares, meaning the conviction behind the decline was real but not yet panicked — a concerning combination because it suggests institutional sellers are methodically distributing rather than dumping all at once. The VIX surging 9.85% to 16.39 is the loudest warning signal of the session. A near double-digit jump in volatility on a day with subdued volume tells you that smart money is actively buying protection, and that kind of hedging activity rarely shows up without a reason. Broad market weakness was uniform and decisive, with the Russell 2000 taking the worst of it at -1.28% and the Nasdaq following close behind at -1.03%, confirming that risk appetite is deteriorating across the board.
Key resistance is now established at $764.67, today's intraday high. A sustained reclaim of that level on convincing volume would suggest the bulls are pushing back and that today's decline was an overreaction rather than the start of something uglier. On the downside, $759.48 is the immediate support line to watch — that's where buyers stepped in today, and a clean break below it on rising volume would be a serious red flag, opening the door to a faster and deeper leg lower. Gold slipping 1.27% to $4,375 undermines the safe-haven narrative, and Bitcoin declining 1.51% to close below $77,365 confirms that risk-off sentiment is hitting nearly every asset class simultaneously. The 10-year yield creeping further to 4.800% remains a stubborn headwind for equity valuations, and with oil spiking 5.64% to $90.60 adding fresh inflationary pressure to the mix, the macro backdrop is getting harder for bulls to ignore. Until SPY can reclaim resistance with volume behind it, the path of least resistance remains lower.
Expected Price Action
Wednesday's session brings actionable intelligence generated by our AI model, with SPY projected to trade within a range defined by $763 on the downside and $772 as the max upside target. That nine-point window keeps this in consolidation territory, meaning participants should be prepared for choppy, back-and-forth price action rather than a clean directional trend. Tuesday's close at $761.72 actually sits below the bottom of that projected range, which is a telling detail — it puts the near-term bias firmly bearish and places the burden entirely on buyers to first reclaim $763 before any bullish thesis earns credibility.
The defining level to reclaim on Wednesday is $763, the floor of the projected range and the first gate bulls must take back just to get price into the expected zone. A convincing move back above $763 opens the door toward $766, which becomes the first real decision point where sellers are likely to reassert themselves. Beyond that, $768 represents the next meaningful overhead hurdle, and $770 and $772 cap the upper end of what the model projects as the maximum upside for the session. The options market is leaning toward the Call side in a contracting band, but with price already trading beneath the projected floor heading in, that Call dominance matters little until buyers can prove they belong in this range. On the downside, the fact that Tuesday's session closed beneath $763 means there's already limited cushion before things get uncomfortable. A failure to reclaim $763 early keeps the tape exposed to further selling pressure, and with the VIX surging 9.85% to close at 16.39, the options market is pricing in meaningfully more risk than it was just a session ago. That kind of volatility expansion in a below-average volume environment is a warning sign — thin tape and rising fear is a combination that can produce sharp, disorderly moves the moment real selling pressure arrives.
Trading Strategy
The VIX jumping 9.85% to 16.39 is a more aggressive signal than yesterday's modest nudge — this is the kind of vol expansion that tells you the options market is actively repricing risk, not just drifting higher out of complacency. At 16.39, we're not in panic territory, but we're firmly past the "ignore it" zone. The size of today's VIX move combined with below-average trading volume is a cautionary combination — it means fear is building without the broad participation needed to flush sellers out cleanly. That's a setup where sharp, quick moves in either direction are more likely than a smooth trend. Position sizing should be pulled back to the 55-65% range here, and stop-losses should be kept tight in the 0.75-1.0% band from entry. The vol environment has shifted enough to demand smaller bets and quicker reactions.
In a rising market scenario, bulls need to reclaim $764.67 — today's high — and hold above it convincingly to change the near-term tone. The preferred long entry is a constructive pullback and hold around the $762-$763 zone, which sits just above today's close and represents the first real area where buyers would need to show their hand. The initial profit target is $768, with a stretch target of $771-$773 if volume expands meaningfully behind the move. Stops on longs belong below $759.48 to protect against a failed recovery. Don't add aggressively until price clears $765 with real buying pressure behind it — a low-conviction grind higher in a rising VIX environment is a headfake until proven otherwise.
In a falling market scenario, $759.48 is the key level to watch — that's today's low, and a clean break below it with expanding selling pressure is your trigger to initiate shorts. The primary profit target is $756-$757, with a secondary target of $753-$754 if sellers gain real momentum. Stops on shorts belong above $763 to keep risk well-defined and protect against a snap reversal. If the market opens soft and rolls straight through $759.48 without any attempt at support, treat that as a high-conviction short entry with measured size. A VIX at 16.39 and still climbing can accelerate moves quickly — cover into those support levels systematically and don't overstay a short position just because the tape feels heavy. Discipline with exits matters just as much as discipline at entry.
Model’s Projected Range
SPY's projected maximum range for Wednesday is $755 to $768, with the Put side dominating in an expanding band that suggests trending price action with intermittent chop. Wednesday brings no economic news due out so the market will trade on technicals. SPY opened at $762.01, tagged a high of $764.67, faded to a low of $759.48, and settled at $761.72, closing down 0.69% on below-average volume in a session that showed early strength before sellers took control through the afternoon. SPY is trading near our model's first support at $760, and ongoing trade policy uncertainty continues to weigh on sentiment as tariff headlines keep institutional buyers cautious. If price breaks above our first resistance at $765, the next target is $767, and on the downside, a break below $760 opens a move toward $755, and if that level gives way there is little to keep price from falling toward $750. The long-term bull trend remains intact above $640 with SPY well above structural support. As long as price holds above key structural levels, this remains a broader dip-buying environment. Absent a catalyst, resistance sits at $765, $767, $768, $770, while support rests at $760, $755, $750. We favor shorting rallies near $765 given SPY closed just below that level and the Put side is in control of the range. Bitcoin closed down 1.51% below $77,365 and MAG stocks were mostly red led by Tesla down 3.22%, though Apple bucked the trend finishing up 2.61% — sustained weakness across both leadership groups would be required to signal a deeper pullback. The VIX closed at 16.39, up 9.85%, suggesting elevated fear given the broad equity weakness and lack of a clear catalyst to bring buyers back to the table. SPY closed just above the lower line of the trend channel with structural support near $760, keeping the near-term uptrend technically intact but on thin ice heading into Wednesday's session.
Market State Indicator (MSI) Forecast
Current Market State Overview:
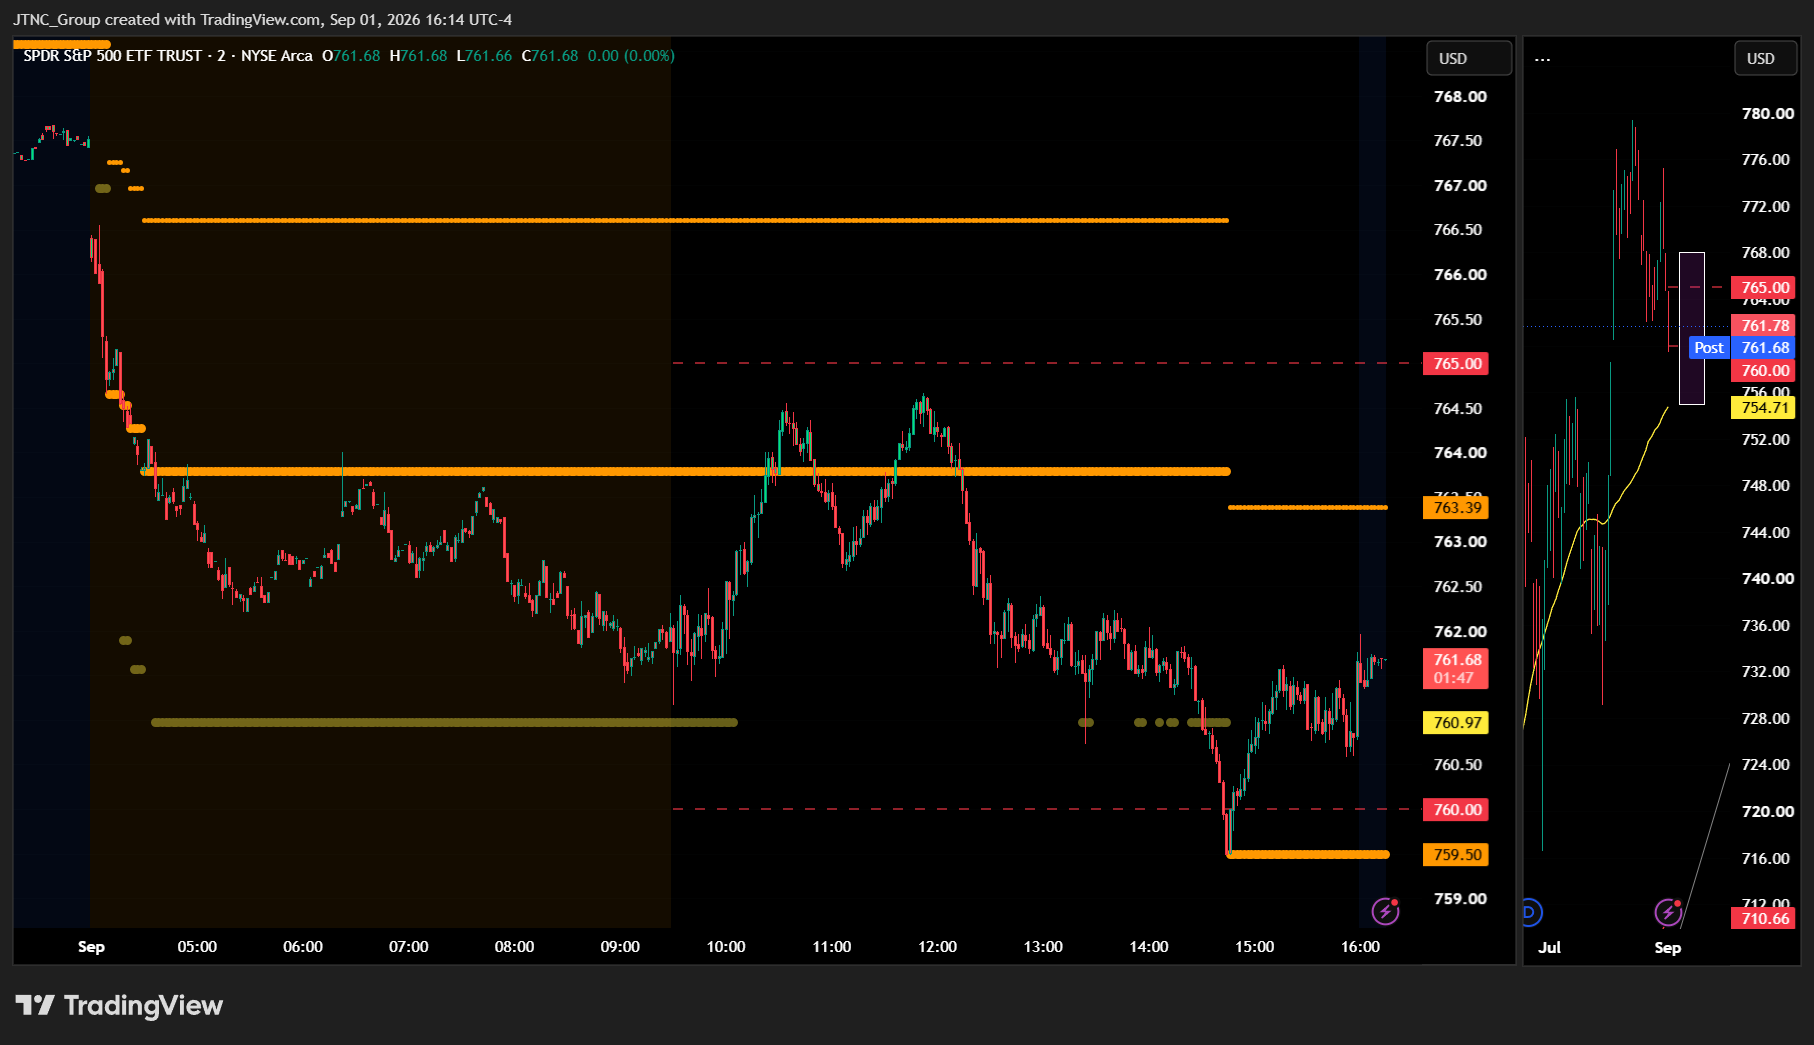
The MSI ended in a Bearish Trending Market State with SPY closing at $761.72. Since SPY closed inside the MSI range, support at $759.5 remains support and resistance at $763.39 remains resistance heading into Wednesday. Extended targets were not printing at the close, though they were active during premarket, the AM session, and the PM session — all printing below — signaling persistent downside pressure throughout most of the day. The MSI rescaled lower overnight several times with extended targets below as the Iran conflict intensified, pushing SPY well below prior levels before the regular session even began. By the open, SPY had already broken through the prior day's lows and was hovering just above major support near $760. Extended targets eventually stopped printing, which gave SPY a brief reprieve, but it did not last long as price spent virtually the entire day below MSI support turned resistance. While the MSI held its wide Bearish Trending state for most of the session, a quick rescale lower with extended targets printing below reached the lows of the day just ahead of the PM session close. Once extended targets stopped printing, SPY bounced off MSI support and closed within the MSI range. The wide $3.89 spread gives price room to move in either direction, though the Bearish Trending state keeps bears in control. The MSI is forecasting a slow grind lower for Wednesday, though without extended targets at the close the downside may be limited and is likely to find support at key levels below. MSI support is $759.5 with resistance at $763.39.
Key Levels and Market Movements:
Monday we stated, "Bears want to see $768.58 continue to act as resistance and press price toward $765 and below," and added, "If the MSI rescales lower with extended targets below, Monday's lows come back into play," while also noting, "Failed breakouts and failed breakdowns are the highest-probability setups." Tuesday delivered on that bearish setup in decisive fashion as the war with Iran escalated and the MSI rescaled lower several times overnight with extended targets printing below, forecasting additional weakness before the opening bell ever rang. By the time the regular session started, SPY opened at $762.01, already beneath prior support, and quickly pressed toward the session low of $759.48 as extended targets continued printing below during the AM session. There was one clear trade setup available — selling rallies to MSI resistance — though the difficulty on a day like this is that price broke support in premarket, leaving traders preferring to short MSI resistance rather than chase a breakdown. The MSI resistance level at $763.39 acted as a ceiling throughout the session, and any attempted rally was quickly faded back toward the lower end of the range. Into the PM session, a brief rescale lower with extended targets printed once more and pushed SPY to the day's lows near $759.48 before extended targets stopped printing and price bounced right off MSI support, eventually closing at $761.72. That recovery off support into the close was the MSI framework doing exactly what it is designed to do — identifying the level where buyers would step in. At minimum it was a one-for-one session for traders following the framework. It was an easy day to read albeit not an easy day to trade given the breakdown-heavy price action and the preference to short resistance rather than support. But the setup was present, identified through proper context, patience, and flexibility while leveraging the MSI, premarket levels, and market structure rather than forcing trades. The MSI continues to prove its reliability as the cornerstone of our trading process.
Trading Strategy Based on MSI:
Wednesday has light economic news so the market is likely to grind lower given the Bearish Trending state at the close, though the move may be modest given that extended targets were not printing at the close and the downside appears limited with support likely to hold at key levels below. The wide Bearish Trending MSI keeps bears in control, and selling rallies to MSI resistance at $763.39 remains the highest-probability approach. That said, a second test of MSI support at $759.5 has a reasonable chance of holding — it is the third test where confidence fades and the risk of a deeper move increases. With the VIX rising nearly 10% to 16.39 on Tuesday and geopolitical tensions remaining elevated, any external catalyst could accelerate the move in either direction, so traders must remain nimble and trade what they see.
Bulls want to see overnight price stabilize and push back through $763.39, reclaiming that level as support and shifting momentum toward the upper end of the range. If the MSI rescales higher and extended targets begin printing above, that would signal a meaningful relief rally is underway and the recent selling pressure is exhausting itself. Bears want to see $763.39 continue to cap any rallies and press price back toward $759.5 and ultimately through it. If the MSI rescales lower with extended targets printing below on Wednesday, the lows from Tuesday come back into play and deeper support levels will need to absorb the selling. Given the current setup, selling any rally to $763.39 resistance is the preferred approach, targeting $759.5 support. A failed breakdown at $759.5 — where price dips below but quickly reclaims it — is also worth watching as a potential long setup back toward resistance. Traders should avoid forcing setups and let the MSI confirm direction before committing to either side.
The long-term bull trend remains intact above $640 and failed breakouts and failed breakdowns continue to offer the highest-probability setups. Remain flexible, avoid trading during Ranging Market States unless a clear failed breakout or breakdown presents itself, and ensure all trades are fully aligned with MSI signals. Providing real-time insights into market control, momentum shifts, and actionable levels, the MSI when integrated with our Pre-Market and Post-Market Reports continues to sharpen execution precision and elevate trade quality. If you haven't yet integrated MSI and our model levels into your process, now is the time. Contact your representative to get started as these tools are designed to support consistency and enhance performance.
Dealer Positioning Analysis
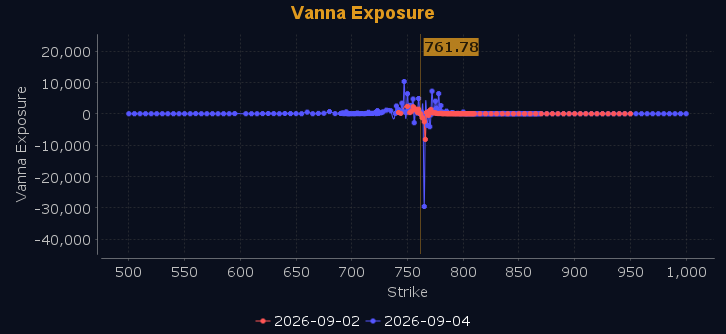
Dealers are selling SPY $769 to $785 and higher strike Calls while buying $762 to $768 Calls, indicating the Dealers' desire to participate in any rally on Wednesday. The ceiling for Wednesday appears to be $771. To the downside, Dealers are buying $761 to $710 and lower strike Puts in a 2:1 ratio to the Calls they're selling, displaying moderate concern that prices could move lower. Dealers are buying ATM Calls looking to participate in any rally Wednesday. They have not increased their hedges but at the same time they are not selling ATM Puts so they are not overly bullish for Wednesday. Below $766 is bearish and above $767 is bullish with everything in between being chop and trap filled. Should SPY fail to hold $763, $760 is in play while above $767 there is little to keep SPY from reaching $770. Dealer positioning is unchanged at bullish.
Looking Ahead to Next Friday:
Dealers are selling SPY $769 to $790 and higher strike Calls while buying $762 to $768 Calls, indicating the Dealers' desire to participate in any rally into Friday. The ceiling for the week appears to be $772. To the downside, Dealers are buying $761 to $655 and lower strike Puts in a 3:1 ratio to the Calls they're selling, displaying moderate concern that prices could move lower. Dealers are no longer selling ATM Puts but are buying ATM Calls indicating their desire to participate in any rally into Friday. We remain bullish above $769 but below $766 we are bearish with the zone in between being nothing but chop and full of traps. For the week Dealer positioning is unchanged at neutral/slightly bearish. We advise reviewing Dealer positioning daily for directional clues. These positions evolve quickly and tracking them is essential for staying ahead of shifting market sentiment.
Recommendation for Traders
With SPY closing at $761.72 and VIX surging 9.85% to 16.39, the bias is clearly defensive. Favor shorts on any bounce toward $764.67, with stops just above that level. Watch $759.48 as immediate support — a break below opens the door to more downside pressure.
Keep risk tight and position sizes in check with the 10-year yield sitting right at 4.800 — a dangerous threshold for equities. Always review the premarket analysis posted before 9 AM ET for any changes in the model's outlook and Dealer Positioning.
Good luck and good trading!
