
Market Insights: Friday, September 18th, 2026
Market Overview
Stocks limped into the weekend on Friday as markets digested the Fed's first rate hike in three years and growing unease around artificial intelligence's long-term potential. The Nasdaq edged up 0.4%, the S&P 500 gained 0.2%, and the Dow slipped 0.2%, finishing the week down more than 1.5%. The 10-year Treasury yield hovered near 5%, acting as a ceiling on equity moves, while Kansas City Fed President Jeff Schmid reinforced the hawkish tone by backing this week's hike and leaving the door open for more, saying "the Fed has work to do on inflation." JPMorgan's Jamie Dimon echoed that skepticism, telling Yahoo Finance "it's not clear to me we've slayed inflation." Oil prices easing below $100 offered some relief, though the ongoing energy shock from Strait of Hormuz disruptions continues to complicate the picture for global central banks.
Apple stole some of the weekend spotlight with the launch of the iPhone 18 Pro and Pro Max — the first under new CEO John Ternus — priced at $1,199 and $1,299 respectively, roughly $100 more than last year due to the AI-driven memory shortage. Demand is strong enough that new orders won't arrive for three weeks. The foldable iPhone Duo is still on track for an October 23 release at $1,999. Chip stocks, which took a beating earlier in the week after Anthropic and OpenAI called for an AI development slowdown, mostly recovered, with the PHLX Semiconductor index finishing only slightly lower on the week. Bitcoin surged 6% to hover above $81,000 as short sellers were forced to cover, lifting the broader crypto market. On the regulatory front, Fed Vice Chair Michelle Bowman released final rule changes to the annual big-bank stress tests, focused on transparency and stronger supervision, while Moody's flagged that life insurers now hold $2.1 trillion in private credit — a number expected to keep climbing into riskier corners like fund finance and AI data centers.
SPY Performance
SPY opened at $761.31 and spent the session grinding in a tight, uninspiring range that never really gave the bulls or bears much to celebrate. The high of $762 came early and faded, while the low of $757.97 represented the only real moment of drama — a brief dip that attracted just enough buying interest to prevent a more meaningful breakdown. The close at $761.54 landed right in the middle of nowhere, which pretty much sums up the tone of the day. After yesterday's strong bounce, this was the market catching its breath rather than building on momentum, and the price action reflected exactly that.
SPY finished down 0.14%, a loss so small it barely registers but still enough to remind you that follow-through from yesterday's relief rally wasn't in the cards. Volume came in at 55.35 million shares, near average, so this wasn't a low-conviction session driven by absent participants — there were plenty of people involved, they just weren't willing to push price in either direction with any real conviction. The VIX dropped 3.63% to close at 14.88, which is a constructive read beneath the surface. The fact that volatility continued to compress even on a flat tape suggests the market isn't bracing for anything imminent. One step forward, one step sideways — not a damaging session by any means, but the bulls need to find a catalyst soon or this consolidation risks becoming something more uncomfortable.
Major Indices Performance
The Nasdaq was the lone bright spot among the major indices today, eking out a 0.39% gain in an otherwise sluggish session. The modest green finish for the Nasdaq makes sense given that a handful of mega-cap tech names managed to hold up while the broader market drifted lower. It wasn't an inspiring rally by any stretch, but when the rest of the market is leaking, even a small gain counts as relative outperformance.
The Dow slipped 0.18%, a quiet pullback that reflects the cautious tone that dominated the session. Blue-chip names didn't have much of a catalyst to work with, and with the broader tape offering little conviction in either direction, the path of least resistance was modestly lower. The Russell 2000 had the roughest day of the group, dropping 0.48%, which is consistent with the pressure small-caps have been feeling in this rate environment. Small companies with floating-rate debt don't get much relief when yields stay stubbornly elevated, and today was no exception.
The S&P 500 also finished fractionally in the red, confirming this was a broad, low-energy drift rather than any targeted sector rotation. The VIX fell 3.63% to close at 14.88, which is an interesting data point — fear is still easing even as the market can't find its footing. That divergence is worth watching. A declining VIX alongside flat-to-negative price action can sometimes signal that complacency is building, which isn't always a good thing when yields are sitting at levels that historically create real headwinds for equities.
Notable Stock Movements
Meta took the unwanted spotlight today, leading the Magnificent Seven lower with a sharp decline of 2.43% that dragged sentiment across the group. That kind of drop from one of the heaviest hitters in the complex isn't easy to brush off — Meta carries enormous index weight, and when it falls that hard, it creates a headwind that the rest of the group has to fight through just to stay afloat. The loss points to some real selling pressure in the name, and it was enough to tip what could have been a mixed day into a mostly red outcome for the group overall.
The broader Magnificent Seven picture was largely negative, which stood in clear contrast to the cohesion and green sweep seen in the prior session. NVIDIA, Amazon, and Alphabet managed to hold their ground and finish in positive territory, offering a few bright spots in an otherwise difficult day for mega-cap tech. But those gains weren't enough to offset the damage from Meta and the other names that ended in the red. A split result like this muddies the narrative — when the group can't pull together, it signals that conviction across the complex is uneven at best.
The mostly red showing from the Magnificent Seven fits the cautious tone that dominated much of the session. The Nasdaq's ability to eke out a small gain despite the weakness in this group is notable, but it also suggests the index was getting help from outside the mega-cap core rather than being driven by it. That's a less encouraging setup. When the Magnificent Seven fractures like this, with big losses in key names and only selective green, it reflects a market that's sorting through uncertainty rather than leaning confidently into risk.
Commodity and Cryptocurrency Updates
Crude oil took a serious hit today, dropping 6.16% to close at $95.63. That's a sharp single-session selloff, but even after that kind of damage, black gold is still sitting well above any model expectation — and the structural forces that pushed it this high haven't fully resolved. Supply dynamics, geopolitical pressure, and demand resilience got crude to these levels, and one ugly day doesn't erase that backdrop. Energy prices at $95 still feed directly into the inflation picture, and that remains a real headache for the Fed regardless of today's pullback. A sustained move above $70 was already a policy complication — crude in the mid-nineties is a different problem entirely.
Gold added 0.40% today to close at $4,417, nudging higher while most of the market struggled to find direction. The metal continues to hold at historically elevated levels, and today's quiet but positive session fits the pattern of a market that's content consolidating before its next move. Central bank demand and macro uncertainty remain the core pillars underneath the trade, and with the inflation picture staying complex, gold's structural case isn't getting weaker.
Bitcoin had a standout session, surging 6.30% to close above $81,218. That's the kind of move that gets attention — meaningful price action with real follow-through behind it. After a stretch of tentative green sessions, today's jump suggests bulls are starting to build something more convincing. The burden of proof isn't fully lifted yet, but stacking a session like this makes the case that this is more than just stabilization.
Treasury Yield Information
The 10-year Treasury yield moved higher today, climbing 1.03% to close right on the 5% threshold. That's not a comfortable place to land. After a brief retreat below 5% in the prior session that gave bulls a flicker of hope, yields have snapped back to exactly where the framework draws one of its most important lines — and sitting on that line is not the same as being below it.
Let's put this in context. The 4.5% level that begins squeezing equity multiples and punishing growth stocks is 50 basis points in the rearview mirror. The 4.8% crossover that marks a genuine shift in selling pressure is already well behind us. And now, with the 10-year pinned at exactly 5%, the market is staring directly at the level the framework identifies as signaling real trouble for equities. This isn't a gray area — 5% is the line, and closing on it rather than below it keeps every major risk warning active.
What makes today's move particularly notable is how the market behaved around it. The mixed session across major indices, with the Dow and small caps finishing in the red while the Nasdaq managed a modest gain, is consistent with what the framework would expect at this yield level — selective, uneven, and unconvincing. When yields are pinned at 5%, it's very difficult for the broader market to generate the kind of momentum needed to sustain a real rally, because the cost of capital is elevated and risk appetite stays compressed.
The next level to watch above the current reading is 5.2%, where the framework's most severe warning kicks in — a potential correction of 20% or more. With yields sitting exactly at 5% and showing a willingness to test higher ground, that threshold is no longer a distant hypothetical. A decisive close back below 4.8% would be the signal bulls need to rebuild confidence. Until that happens, every bounce in equities should be treated with skepticism.
Previous Day’s Forecast Analysis
Friday's forecast called for SPY to trade within a $750 to $770 range, with Thursday's close at $762.70 sitting in the upper half of that window and shifting the near-term bias bullish heading into the session. The newsletter framed this as trending territory — a directional move with conviction rather than sideways chop — and emphasized the importance of having a clear bias before the open. The VIX dropping 12.59% to 15.48 was cited as a genuine green light for bulls, pulling volatility into a range that gives systematic accounts room to add exposure while removing a persistent headwind on risk appetite.
The key level going into Friday was $763, identified as the next decision point above spot. Holding that level was expected to open a run toward $766, the level bulls needed to clear to confirm the September slide was fully behind them, with $770 as the max upside target and a major round number with significant options interest. On the downside, $761 was the first line of defense, with $759 the next critical zone — losing that cleanly was expected to put $757 in play, and a break below $757 was flagged as a potential acceleration point with $753 as the last meaningful floor before $750 opened as max downside.
The recommended trading strategy leaned bullish at 60-70% sizing with stop-losses kept in the 0.75-1% range from entry. The preferred long entry was a controlled pullback into the $759-$761 zone, targeting $765-$766 initially and $769-$770 as a secondary target if participation expanded. Stops on longs were placed below $757. The newsletter warned against chasing price above $763 at the open without volume confirmation. On the short side, a rejection at $763-$764 on the first morning bounce was the trigger, targeting $757-$758 with $753-$754 available if sellers pressed. The VIX environment at 15.48 made the newsletter cautious about overstaying short positions, noting the risk of a sharp squeeze on any positive catalyst.
Market Performance vs. Forecast
Friday's session produced a tight, indecisive grind that actually confirmed several of the framework's key structural reads — the model flagged $757 as a critical floor, and that level held precisely, with the low of $757.97 never breaching the zone where the forecast warned sellers could accelerate. The open at $761.31 landed almost exactly on the $761 support level the forecast identified as the first line of defense, and price spent the entire session respecting the boundaries the model outlined. The close at $761.54 held above $759, which the prior forecast explicitly identified as the next critical zone below $761 — that level was never seriously threatened, confirming the structural support framework remained intact throughout the session.
The directional bias heading into Friday leaned bullish given Thursday's close at $762.70 in the upper half of the projected range, and while the tape did not deliver the follow-through toward $766 that the rising scenario outlined, the session avoided any meaningful downside resolution as well. Price never cleanly lost $759, the bears never mounted a credible push through the $753-$750 zone, and the short setups the falling market scenario described required a rejection at $763-$764 that simply did not materialize with enough conviction to trigger entries. External catalysts introduced indecision that kept the tape compressing rather than trending, and the model does not account for low-conviction macro environments where price simply refuses to commit to a directional move. The VIX extending its decline to 14.88 was fully consistent with the vol compression thesis the forecast described — that continued drift lower validated the framework's read that fear was receding. Any traders who respected the sizing guidance in the 60-70% range and maintained stops below $757 saw risk management protocols protect capital through a session that offered limited clean setups. The framework's ability to define the exact floor that held and the exact overhead that capped the move remains the durable edge here, and that structural clarity carries directly into the next session.
Premarket Analysis Summary
The premarket analysis posted at market open set SPY's projected range for the session between $755 as max downside and $770 as max upside, with spot entering at $761.56 in a put-dominated tape that had finally lifted off the $760 level after four consecutive sessions pinned to it. The expected move had tightened to seven points, signaling a more contained session unless one side forced the issue. The defining level was $762 — identified as the gate right above spot and the line that would separate a genuine break from another stall. Above $762, $763 was the first step, $765 was where the heaviest battle above sat and where price should want to stall, $767 was the level bulls truly needed to hold to end the week on the front foot, and $770 stood as max upside at a major round number with significant interest. On the downside, $761 sat right beneath spot as the first watch level, $760 was identified as the most important level on the board — the line in the sand all week — and losing it cleanly after finally lifting off would represent a genuine failure. Below there, $758 was the point of last hope, and $755 was max downside where major support came in. The analysis warned that with $760 and $762 bracketing spot so tightly, the first clean break would decide how the week ended.
The market never delivered that clean break to either side. SPY opened at $761.31, right in the middle of that tight bracket, and spent the session testing both boundaries without conviction. Price reached a high of exactly $762 — tagging the defining gate level but failing to clear it — before selling dragged it to a low of $757.97, slicing through $760 and $758 before finding support. The close at $761.54 recovered nearly all the lost ground, finishing essentially flat with a loss of 0.14%, leaving the week ending in a draw rather than the decisive resolution the analysis had outlined as the likely outcome. The VIX dropping 3.63% to 14.88 suggested the intraday weakness never truly spooked participants, even as the tape briefly validated the downside structure the premarket had flagged below $760.
Validation of the Analysis
Today's session was a near-perfect case study in how a tight, well-defined framework handles a coiled tape, and traders who came in with the premarket levels loaded had every advantage. The analysis zeroed in on 762 as the gate — the level that separated a genuine break from another stall — and SPY answered that question with unusual precision. The high of $762.00 tagged that exact level to the dollar and rejected there, confirming 762 as the ceiling the premarket described and signaling that bulls couldn't muster the conviction to push through. That single interaction defined the entire session.
On the downside, the framework laid out 761 as the first level to watch beneath spot, then flagged 760 as the most important level on the board — the line in the sand held all week. SPY respected that sequence almost to the letter, with the low of $757.97 slicing through 760 and reaching toward 758, which the analysis called the point of last hope. Price found its footing right in that zone, never threatening the 755 max downside, and recovered to close at $761.54 — essentially back at the open and nearly flat on the day. The premarket's caution about Friday sessions cutting both ways after a week coiled this tightly proved entirely correct — the tape chopped exactly within the expected move, testing both the 762 ceiling and the sub-760 danger zone before settling in the middle. The VIX dropping 3.63% to 14.88 reflected the lack of real panic even as price dipped beneath 760, consistent with the contained, range-bound character the analysis projected. Traders watching the 762 rejection had a clean short trigger, while those who noted 758 as last hope had an equally clean long setup — two well-defined trades built entirely from the premarket structure.
Looking Ahead
With the economic calendar showing no high-impact releases confirmed for Monday, traders head into the new week without a major data catalyst to set the tone. No GDP print, no Fed speakers on the schedule, no PMI flash estimates — just the market digesting whatever positioning decisions were made heading into the weekend and figuring out where it wants to go from there.
That kind of clean-slate Monday puts the focus squarely on price action and how the market responds to the levels established during Friday's session. Opening behavior will be worth watching closely, since early Monday trade often reflects overnight sentiment shifts and any weekend news flow that had time to percolate before the open. Without a scheduled catalyst to lean on, the disciplined move is to let the market show its hand first, respect the levels that matter, and avoid forcing conviction where the tape hasn't earned it yet.
Market Sentiment and Key Levels
The directional bias today sits in no-man's land — neither bulls nor bears can claim a convincing victory after SPY shed just 0.14% in a session that felt more like a standoff than a selloff. The VIX dropping 3.63% to 14.88 is the most constructive data point of the day, suggesting the options market isn't pricing in near-term fear even as price action stayed choppy. That volatility compression keeps the intermediate-term backdrop from flipping outright bearish, but the split tape — Nasdaq finishing green while the Dow and Russell lagged — tells you this market lacks the broad participation that would give bulls real confidence. With volume near average and the index barely holding above its open, there's no strong hand in control right now.
Key resistance sits at $762, the session high that SPY tagged and immediately stalled at. A clean break above that level on expanding volume would open the door toward the $763.57 to $765 area, where prior session sellers are likely waiting. On the downside, $757.97 — today's intraday low — is the immediate support line. A decisive break below that print would shift the tone meaningfully bearish and could expose the $756 to $754 range as the next area where buyers need to show up. The 10-year yield closing right at the psychologically critical 5% level is the macro cloud hanging over everything — not because it moved dramatically today, but because that threshold historically invites institutional repositioning away from equities. Bitcoin surging 6.30% and gold ticking higher suggest some rotation into alternative stores of value, which is worth watching as a sentiment signal. Bulls need a catalyst and volume to confirm any upside attempt — without it, this chop continues.
Expected Price Action
Monday's session brings actionable intelligence generated by our AI model, with SPY projected to trade within a range framed by $755 on the downside and $770 as the max upside target. That fifteen-point window puts this squarely in trending territory — traders should expect a directional move with real conviction behind it, not a sideways grind, so walking in with a clear bias before the open is essential. Friday's close at $761.54 sits in the lower-to-middle portion of the projected range, which gives the bias a cautious lean — neither strongly bullish nor decisively bearish, but with more work to do on the upside before bulls can claim control.
The defining level heading into Monday is $762, the gate sitting just above Friday's close. That level is the difference between this tape lifting with purpose and another stall in familiar territory. A clean break above $762 opens $763 as the first real step, then $765 as the heaviest battleground above — price should want to stall there and bulls will need to absorb serious resistance. Clear $765 convincingly and $767 becomes the next critical test, the level that puts buyers firmly on the front foot. Beyond there, $770 stands as max upside and a major round number with significant interest. On the downside, $761 is the first line of defense sitting just beneath spot. Lose that and $760 becomes the most important level on the board — it served as the line in the sand all last week, and a clean break now after finally lifting off would be a genuine failure. Under $760, $758 is the next floor, and losing that puts $755 in play as max downside. With $760 and $762 bracketing spot this tightly, the first clean break in either direction will likely dictate the tone for the entire session.
Trading Strategy
The VIX dropping 3.63% to 14.88 is a modest but meaningful confirmation that volatility continues to compress, keeping systematic and options-driven accounts in a posture that favors adding risk rather than hedging it. At 14.88, the VIX is sitting at a level that signals calm rather than complacency, and that distinction matters — calm markets can trend, while complacent markets tend to snap back violently when any unexpected catalyst hits. The session's near-flat finish on average volume does not dramatically alter the vol picture, but it does suggest the market is consolidating rather than breaking out, which means traders should size accordingly. A drift back above 17 in the VIX would be the first warning sign to tighten stops and trim net long exposure. For now, 60-70% position sizing remains appropriate with stop-losses in the 0.75-1% range from entry — tight enough to protect capital, wide enough to avoid getting shaken out by normal intraday noise in a low-volatility tape.
In a rising market scenario, the key level to watch on the long side is a controlled pullback into the $759-$761 zone, where today's intraday floor demonstrated some demand. A dip into that range that stabilizes and reclaims $762 is the preferred long entry, targeting $765-$766 as the first profit zone and $769-$770 as a secondary target if broader market participation accelerates. Stops on longs belong below $757 to avoid getting caught in a breakdown that turns the recent close into a failed base. Do not chase price above $763 at the open without seeing volume confirm the move — low-vol environments can produce deceptive gaps that fade quickly if buyers are not present in size.
In a falling market scenario, $763-$764 becomes the resistance zone to fade, and a clean rejection on the first morning bounce is the short trigger. That setup targets $757-$758 as the initial profit zone, with $753-$754 available if sellers maintain control and buyers fail to defend the first meaningful support level. Stops on shorts belong above $765 to protect against a squeeze through the session high. If the tape opens weak and breaks below $761 without any bounce attempt, that is an actionable short entry at reduced size. With the VIX at 14.88 and still trending lower, the risk of a sharp short squeeze on any positive catalyst remains elevated — cover into support in layers and avoid overstaying short positions in a vol environment that can reverse quickly and without much warning.
Model’s Projected Range
SPY's projected maximum range for Monday is $756 to $769, with the Put side dominating in an expanding band that suggests trending price action with intermittent chop. Monday brings no significant economic data so the market will trade on technicals and post-FOMC sentiment. Today is OPEX and the recovery off the lows into the close is a constructive sign with the Fed having cut rates this week. SPY closed at $761.54, up 1.02% on the day, after opening at $761.31 and trading between a high of $762 and a low of $757.97 on heavy OPEX volume. The long-term bull trend remains intact above $640 with SPY well above structural support. As long as price holds above key structural levels, this remains a broader dip-buying environment. If our first resistance at $762 breaks, price targets $763, while a break of first support at $760 would target $758. Should $756 fail to hold, there is little to keep price from falling toward $753. Absent a catalyst, resistance sits at $762, $763, $765 and $767 with support at $760, $758, $756 and $753. The VIX closed at 14.88, down 14.97%, a massive reduction in fear consistent with the post-FOMC rate cut relief rally. SPY closed near the upper trend channel with structural support well below current price levels.
Market State Indicator (MSI) Forecast
Current Market State Overview:
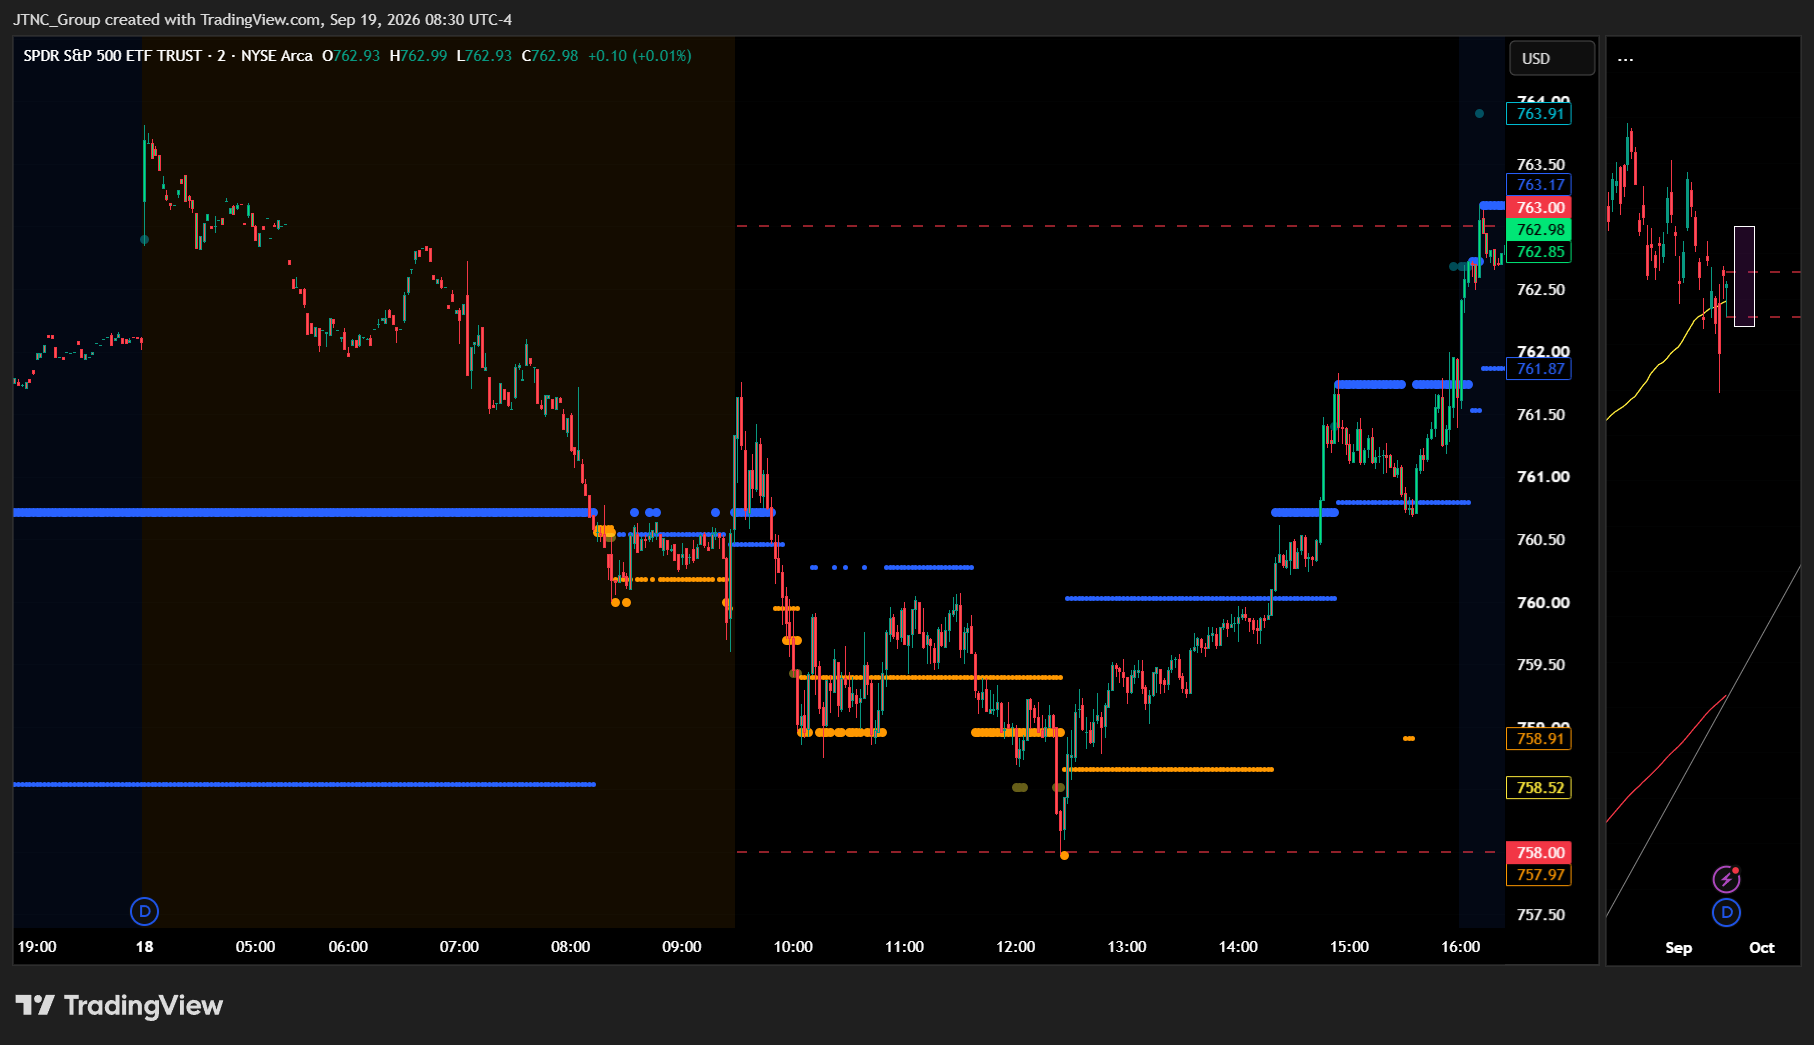
The MSI ended in a Bullish Trending Market State with SPY closing at $761.54. With SPY above MSI resistance, that $763.17 level now becomes support heading into Monday. Extended targets were printing at the close, implying the current recovery will continue on Monday. Extended targets were active during premarket printing below as the MSI rescaled lower driving price from $764 down to $758 by the open, and then above during the PM session as the rapid rescalings higher lifted price back to $763. The MSI opened overnight in a wide bullish state but began rescaling lower through the premarket session with extended targets below driving price from $764 down to $758 by the open. As soon as extended targets stopped printing SPY reversed sharply and the MSI began a series of rapid rescalings higher lifting price from $758 all the way back to $763 by late afternoon, settling into a narrow $1.30 Bullish Trending state into the close. Today is OPEX so the recovery off the lows into the close is a constructive sign and with the Fed having cut rates this week, the bulls appear to be back in control. With extended targets printing at the close, the MSI is forecasting a strong continuation higher on Monday with the bulls maintaining control. MSI support is $761.87 with resistance at $763.17.
Key Levels and Market Movements:
Wednesday we stated the MSI was forecasting a test of both sides of the range and Friday delivered a volatile OPEX session that tested the downside before the bulls reasserted control emphatically. The premarket selloff from $764 to $758 with extended targets below offered the first trade of the day — a short setup riding the MSI's bearish momentum. Once extended targets stopped printing below, the reversal signal was clear and the second trade emerged as the MSI began rapid rescalings higher. SPY rallied from $757.97 to $763, a five-point move that the MSI signaled in real time. The third setup came in the afternoon as the MSI confirmed the bullish state with extended targets above, allowing traders to ride the momentum into the close. SPY closed at $761.54, up 1.02% on the day. The VIX collapsed 14.97% to 14.88, the largest single-day drop in weeks, reflecting the dramatic shift in sentiment from the FOMC rate cut. At minimum it was a three-for-three session for traders following the framework. It was a volatile but readable day with substantial setups, all identified through proper context, patience, and flexibility while leveraging the MSI, premarket levels, and market structure rather than forcing trades. The MSI continues to prove its reliability as the cornerstone of our trading process.
Trading Strategy Based on MSI:
Monday brings no significant economic data so the market will trade on technicals and post-FOMC sentiment. With extended targets printing above at the close and the MSI in a narrow Bullish Trending state, the forecast calls for a strong continuation higher on Monday with the bulls maintaining control. The narrow $1.30 spread suggests the MSI is likely to rescale on Monday, and given the bullish momentum and extended targets above, any rescale is more likely to be higher than lower.
Bulls want to see overnight price hold above $761.87 MSI support and press toward new highs above $763.17. If the MSI rescales higher with extended targets continuing to print above, the post-FOMC rally has room to run and traders should stay with the trend. Bears want to see $761.87 support fail and the MSI rescale into a Ranging or Bearish state. If extended targets stop printing above and the MSI rescales lower, the OPEX bounce may prove temporary and a pullback toward $758 becomes probable. Any dip that holds above $761.87 and sees the MSI maintain its Bullish Trending state is a buying opportunity.
The long-term bull trend remains intact above $640 and failed breakouts and failed breakdowns continue to offer the highest-probability setups. Remain flexible, avoid trading during Ranging Market States unless a clear failed breakout or breakdown presents itself, and ensure all trades are fully aligned with MSI signals. Providing real-time insights into market control, momentum shifts, and actionable levels, the MSI when integrated with our Pre-Market and Post-Market Reports continues to sharpen execution precision and elevate trade quality. If you haven't yet integrated MSI and our model levels into your process, now is the time. Contact your representative to get started as these tools are designed to support consistency and enhance performance.
Dealer Positioning Analysis
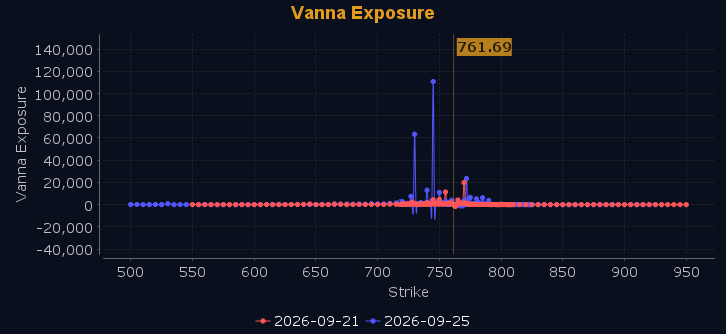
Dealers are selling SPY $763 to $778 and higher strike Calls while buying $761 to $762 Calls, indicating the Dealers' desire to participate in any continuation rally on Monday. The ceiling for Monday appears to be $765. To the downside, Dealers are buying $759 to $698 and lower strike Puts in a 4:1 ratio to the Calls they're selling, displaying heightened concern that prices could move lower. Dealers are buying very small quantities of ATM Calls looking to participate in any relief rally Monday. Below $759 is bearish and above $762 is bullish with everything in between being choppy and trap filled. Should SPY fail to hold $759, $753 is in play. Above $762 there is a heavy wall of resistance at $763 to $765 that will keep prices from moving much higher without an external catalyst. Dealer positioning has changed to neutral/slightly bullish.
Looking Ahead to Next Friday:
Dealers are selling SPY $763 to $790 and higher strike Calls for the week ahead while buying $761 to $762 Calls. The ceiling for the week appears to be $780. To the downside, Dealers are buying $760 to $648 and lower strike Puts in a 5:1 ratio to the Calls they're selling, displaying significant concern that prices could move lower. Dealers are buying ATM Calls hoping price breaks above current resistance and resumes the bull trend. But with such a large position this Call wall will be very hard to overcome and as such we expect prices to stall at that level. Their positioning is neutral/slightly bearish although Dealers have not added further to their hedges. Below $755 is bearish and above $762 is bullish with the range in between being choppy and trap filled. There is major support at $753 with major resistance at $763 to $765. For the week Dealer positioning has changed to neutral/slightly bearish. We advise reviewing Dealer positioning daily for directional clues. These positions evolve quickly and tracking them is essential for staying ahead of shifting market sentiment.
Recommendation for Traders
With SPY closing at $761.54 and the 10-year yield hitting exactly 5.000, this is the line in the sand — above 5% spells real trouble for equities, so stay disciplined. Favor cautious longs above $761.54 with tight stops below $757.97, and flip to shorts on any clean breakdown beneath that level. VIX dropping 3.63% to 14.88 is constructive, but near-average volume on a nearly flat day isn't a green light to load up.
Keep position sizes manageable and don't overstay trades in either direction — 5% yields demand respect. Review the premarket analysis posted before 9 AM ET for any changes in the model's outlook and Dealer Positioning.
Good luck and good trading!
