Market Insights: Thursday, September 11th, 2025
Market Overview
US stocks climbed to new record highs Thursday as inflation and labor market data reinforced expectations for imminent rate cuts by the Federal Reserve. The Dow surged 1.36% and closed above 46,000 for the first time ever, leading the market higher. The S&P 500 gained 0.83% and also closed at a fresh all-time high, while the Nasdaq advanced 0.72%, posting its fourth consecutive record close and finishing above 22,000 for the first time. The rally came despite August’s CPI print showing a slight acceleration in consumer prices and continued signs of sticky inflation.
The CPI data revealed that prices rose 0.4% in August, slightly ahead of July’s 0.2% increase and above expectations for a 0.3% gain. On an annual basis, inflation climbed to 2.9% from July’s 2.7%. While these figures suggest President Trump’s tariffs may be filtering into consumer costs, markets appeared unfazed. Traders instead focused on weak jobless claims data, which showed a jump to 263,000—marking the highest level in nearly four years and reinforcing concerns over a deteriorating labor market. The combined inflation and labor picture has markets fully pricing in at least a 25 basis point rate cut at next week’s FOMC meeting, with expectations for up to three cuts by year-end.
Despite the hotter CPI, traders appear confident that the Fed will prioritize economic softening over inflation persistence. Stocks rallied throughout the day with minimal pullbacks, showing bullish conviction. Kroger and Adobe were in focus on the earnings front, while inflation and macro signals remained front and center for traders managing risk into next week’s key Fed decision.
SPY Performance
SPY rose 0.83% to close at $657.60, extending its bullish streak after opening at $654.32. The ETF reached a high of $658.33 and a low of $653.59 on average volume of 64.71 million shares. The CPI release prompted a brief test of $653 early, but the market quickly found its footing and rallied steadily into the afternoon, closing just shy of session highs. Dip buying remained persistent, confirming the continuation of the broader uptrend.
Major Indices Performance
The Russell 2000 led with a strong 1.79% gain, signaling risk appetite and leadership from small caps. The Dow jumped 1.36%, closing above 46,000 for the first time and marking a significant milestone. The S&P 500 followed with an 0.83% gain, and the Nasdaq climbed 0.72%, closing above 22,000 for the first time ever. The market responded positively to the CPI print and weaker jobless claims, choosing to focus on Fed policy expectations rather than sticky inflation. The rally was broad-based, with cyclical sectors in particular catching a strong bid.
Notable Stock Movements
It was a mixed day for the Magnificent Seven, with Meta, Nvidia, Amazon, and Netflix all closing in the red. Netflix led the downside, falling 3.54% as traders rotated away from recent high-flyers. Apple, Google, and Microsoft posted modest gains, helping to buoy broader tech sentiment. Nvidia's pullback marked a pause in its recent bounce, while Amazon and Meta slid slightly as traders reallocated ahead of next week's FOMC meeting. The divergence continues to highlight selective positioning in mega caps as the market digests macro data.
Commodity and Cryptocurrency Updates
Crude oil dropped 2.14% to $62.31 as supply concerns faded and macroeconomic uncertainty pressured energy prices. Despite short-term volatility, our model still targets a move toward $60 in the coming months. Gold declined 0.15% to $3,676, a muted reaction given the inflation print. Bitcoin gained 0.71%, closing above $114,400 as crypto continues to rise alongside risk assets, even in the face of inflation data that might normally dampen speculative sentiment.
Treasury Yield Information
The 10-year Treasury yield slipped 0.15% to 4.022%, reflecting market confidence that the Federal Reserve will follow through with rate cuts despite August’s hotter-than-expected CPI. With yields well below the 4.5% threshold that typically pressures equities, the bond market continues to provide a tailwind for stocks. If yields stay below 4.2%, risk assets are likely to remain supported into next week’s Fed meeting.
Previous Day’s Forecast Analysis
Wednesday’s forecast projected SPY would trade in a wide range between $647.25 and $658.75, with a bullish bias above $650 and key upside targets at $653, $655, and $658. The model highlighted the CPI report as a key volatility driver and warned that a move above $655 could result in a run toward $660. The strategy favored long trades above $650, while short trades were only recommended below $647. The analysis also cautioned about rapid swings following CPI and recommended tight risk control into the event.
Market Performance vs. Forecast
Thursday’s session tracked the forecast with impressive precision. SPY opened at $654.32, tested a low of $653.59 following the CPI release, then surged to a high of $658.33 before closing strong at $657.60. The trading range remained within the projected $647.25 to $658.75 band, with the $655 and $658 resistance levels both tagged. The bias toward long trades above $650 worked beautifully as every dip was quickly bought. The forecast once again provided a clear and tradable roadmap, correctly anticipating the bullish breakout and offering actionable targets for traders on both sides of the market.
Premarket Analysis Summary
In Thursday’s premarket analysis posted at 7:46 AM, SPY was trading at $653.70 with a bullish bias level identified at $652. The model expected early volatility due to the CPI release, but maintained that any action above the $652 bias would favor longs, with targets at $654 and $657.50. A potential dip near $651 was highlighted as a bounce zone, while a loss of $651 would shift the strategy to favor shorts toward $648.55 and possibly $645. The model anticipated a directional move after CPI, with a preference to buy dips above $652 and take profits near upper resistance levels.
Validation of the Analysis
Thursday’s price action validated the premarket roadmap with high precision. SPY dipped briefly to $653.59 at the open, then climbed steadily, hitting the upside target of $657.50 before closing just below it. The projected bounce zone near $651 wasn’t tested deeply, showing market strength right out of the gate. Long trades were clearly the higher-probability setups, and the model’s early targets gave traders clear take-profit zones. Once again, the analysis demonstrated its reliability, helping traders capitalize on a volatile CPI-driven session.
Looking Ahead
Friday brings the University of Michigan Consumer Sentiment and Inflation Expectations reports, which could offer further insight into consumer behavior and inflation outlook. While not as impactful as CPI or PPI, these releases could still move markets, especially if sentiment data surprises in either direction. With no major economic news on Monday and the FOMC looming on Wednesday, traders may use Friday to consolidate positions, reduce exposure, or position ahead of next week’s volatility.
Market Sentiment and Key Levels
SPY closed at $657.60, clearly within bullish territory and just below the $660 breakout level. Sentiment remains strong as inflation fears are tempered by labor market weakness and dovish Fed expectations. Key resistance sits at $660, $661, and $665, while support levels to watch include $655, $652, $648, and $645. As long as SPY holds above $652, bulls remain in full control. A break above $660 would confirm a major breakout, while a drop below $648 could signal a short-term pullback. The market remains trend-biased to the upside with dips continuing to be aggressively bought.
Expected Price Action
Our AI model projects SPY to trade between $652 and $660 on Friday. This is actionable intelligence generated by our AI model. The narrowing range suggests choppy, two-way trading with bursts of trend as the market digests CPI and prepares for next week’s FOMC decision. The bias remains bullish with a clear focus on whether SPY can break and hold above $660. If so, a push toward $665 becomes likely. Conversely, if SPY stalls or reverses below $655, expect a pullback to $652, and potentially $648 if selling intensifies. Traders should monitor these levels closely and remain prepared for intraday reversals.
Trading Strategy
Long trades are favored above $655, targeting $660 and $661. A confirmed breakout above $661 could see SPY rally to $665 before encountering stronger resistance. Traders should trail stops closely as the market approaches all-time highs. Short trades are only viable if SPY breaks below $652, with downside targets at $648 and $645. With VIX falling 4.17% to 14.71, volatility is subdued, but that can quickly change as we near the FOMC. Manage risk tightly, especially during macro data releases. Maintain smaller position sizes and avoid overexposure. Tighten stops near highs and use wider stops only in confirmed breakouts.
Model’s Projected Range
SPY’s projected range for Friday sits between $651.75 and $661.75, with the Call side dominating in a narrowing band that suggests choppy price action with intermittent periods of trending behavior. With only the UoM reports due, we expect Friday to be a consolidation day. CPI came in hotter than expected, but not hot enough to derail the idea that the Federal Reserve will begin cutting rates. As such, the market once again made new highs and closed just off those highs, which remains supportive of the bull trend. A test of $652 immediately after CPI held, and from there the market climbed steadily for the rest of the day on average volume. With SPY well above the critical $645 threshold and every dip being bought, the market is likely to at least test the confirmation breakout level of $660 before reacting. The bulls remain in complete control of the broader narrative, and we expect more new highs before FOMC. Once price reaches $660, we view the odds of a sell-the-news event at 50/50. Heading into FOMC, a drift higher with periods of consolidation should be expected. Overnight, the bulls will defend $655, and a failure there opens the door to $652, while a break below that would bring $645 back into play. Until SPY falls to $640 or lower, the bears remain sidelined. Our base case remains a 10 to 15 percent pullback at some point, yet we continue to view any weakness as a buying opportunity until FOMC and recommend buying every dip above $645. For Friday, resistance is at $660, $661, and $665, with support at $655, $652, $648, and $645. Since reclaiming $585, SPY has held a steady uptrend fueled by dip buyers. Today Mag stocks were mixed once again, perhaps showing early cracks in the megacaps. Until weakness emerges in these leaders, or ETH closes below $4300, prices are likely to grind higher. We continue to favor quick profit taking and caution with overnight holds. The VIX fell 4.17 percent to 14.71, and while September often sees VIX reach 20, contango in VXX futures suggests volatility may drift lower into FOMC, which is what developed today. If you have not added protection to your long book, now is the time. VIX below 23 supports the bullish case, but a breakout above it could finally spark the long-anticipated pullback. SPY closed firmly within a redrawn bull trend channel from the April lows, as the model currently sees the odds of a continuation of the bull trend as higher than a pending selloff.
Market State Indicator (MSI) Forecast

Current Market State Overview:
The MSI ended the day in a very narrow Bullish Trending Market State, with SPY closing well above MSI resistance turned support. Extended targets printed virtually the entire day and in the premarket. The MSI has not rescaled since yesterday which implies a weak bull trend. But the strength of the herd as evidenced by extended targets was undeniable. We expect the MSI to rescale on Friday or as more volume comes into the market. For Friday should extended targets stop printing, watch for the MSI to rescale lower. But if extended targets continue printing, its highly likely the MSI rescales higher and the trend continues unabated. MSI support is at $651.82, and lower at $651.52.
Key Levels and Market Movements:
On Wednesday we wrote, “Thursday brings CPI, which is very likely to move the market,” and noted, “We expect more sideways action than bullish drift overnight, with the bulls defending $650 to keep the bull trend intact,” while also stating, “Our bias remains to buy on dips.” With that context, and with the MSI opening in a narrow Bullish Trending Market State with SPY well above the MSI but extended targets printing into the open, we looked for a chance to go long. That opportunity came on a weak failed breakdown to MSI support at $652.12. We entered long at $653 as price recovered and set T1 at the premarket level of $654, which met our minimum $1 threshold for a first target. That target came quickly, so we set T2 at the next premarket level of $657.50, much higher than our entry. While we were not certain price would reach it, we had no other levels to lean on, so we held the trade and watched as SPY ripped virtually straight up. By noon our second target was hit, and with extended targets still printing we moved our stop to breakeven and trailed. SPY moved slightly higher from our second target, and with less than ten minutes left in the session, we closed our trailer at $658 for a massive, one-and-done trade with the trend, once again the result of a clear plan, disciplined execution, and strong alignment between MSI signals, our broader market model, and key technical levels. The MSI continues to be a cornerstone of our consistent trading process.
Trading Strategy Based on MSI:
Friday brings UoM sentiment and inflation data, which is unlikely to move the market materially. After the massive move from Tuesday, September 2nd, the market needs time for price discovery. The bulls will want to defend $652 on a test of today’s lows and will attempt to push price to $660, where the bull breakout will be confirmed. The bears have little to do given the strength of the trend, but if $652 fails, price may slide as low as $645 before recovering. With no news on Monday, it is likely the market hovers in the current $650 to $660 range until FOMC, after which it will pick a direction and move decisively. Until then, we expect dips to be bought as the bulls remain in control of the narrative. The bears will only come to life on a drop below $640, but not before. As such, it is likely we continue to see new all-time highs before FOMC on the 17th. Our bias remains to buy on dips while also considering short setups on failed breakouts near the all-time highs or on a break below $645. As always, failed moves remain among the highest-probability setups. Stay nimble, avoid trades during Ranging Market States, and ensure full alignment with MSI. Providing real-time insights into market control, momentum shifts, and actionable levels, the MSI when integrated with our Pre-Market and Post-Market Reports continues to sharpen execution precision and elevate trade quality. If you haven’t yet integrated MSI and our model levels into your process, now is the time. Contact your representative to get started as these tools are designed to support consistency and enhance performance.
Dealer Positioning Analysis
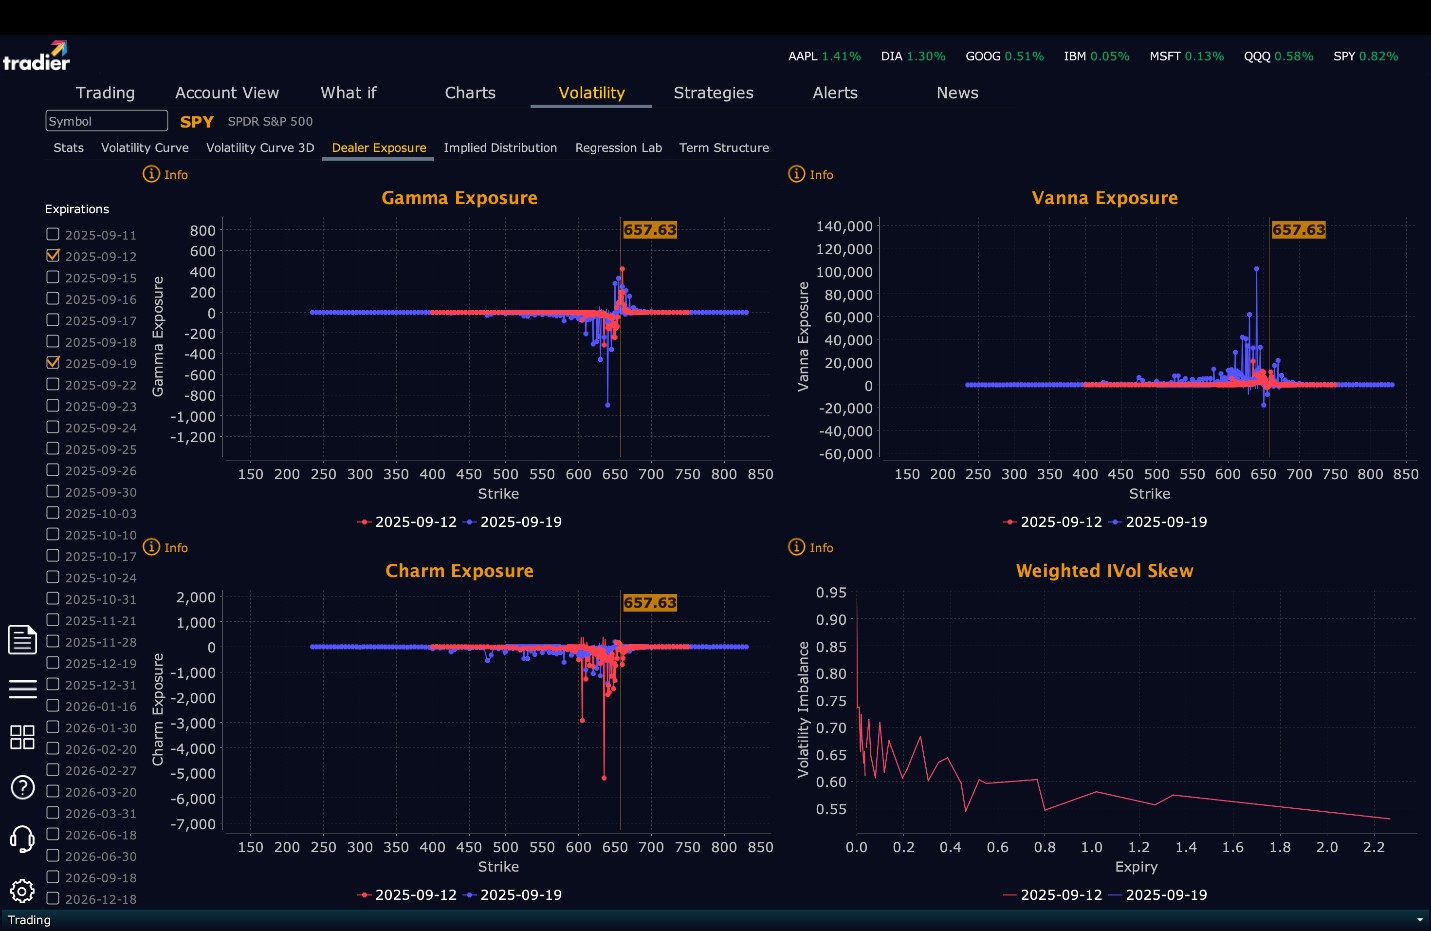
Summary of Current Dealer Positioning:
Dealers are selling SPY $658 to $670 and higher strike Calls while also selling $652 to $657 Puts implying the Dealers belief that prices can only rise on Friday to new all-time highs. Dealers only sell ATM Puts when they believe prices will rise. The ceiling for tomorrow appears to be $660. To the downside, Dealers are buying $651 to $595 and lower strike Puts in a 3:1 ratio to the Calls they’re selling displaying little concern that prices could move lower tomorrow. Dealer positioning is unchanged from slightly bearish/neutral to slightly bearish/neutral.
Looking Ahead to Next Friday:
Dealers are selling SPY $658 to $685 and higher strike Calls while also selling $650 and $655 Puts implying the Dealers belief that prices will likely rally next week or at a minimum, not fall below $650. The ceiling for next week appears to be $665. To the downside, Dealers are buying $657 to $540 and lower strike Puts in a 5:1 ratio to the Calls/Puts they’re selling, reflecting an increasingly bearish outlook for the week. This is likely more hedging than a bearish prediction. For the week Dealer positioning is unchanged from bearish to bearish but slightly more so. We advise reviewing Dealer positioning daily for directional clues. These positions evolve quickly and tracking them is essential for staying ahead of shifting market sentiment.
Recommendation for Traders
SPY closed at $657.60, continuing its bullish streak and sitting just below major resistance at $660. Long trades are still preferred above $652, targeting $660 and $661 with a potential extension to $665. Shorts should be considered only on confirmed breaks below $652, targeting $648 and $645 or on failed breakouts near or above the all-time high. With the VIX at 14.71, markets are calm, but with next week’s FOMC approaching, volatility can return quickly. Use tighter stops near resistance, reduce size ahead of major macro events, and be ready to shift bias quickly if price action changes. Remember to review the premarket analysis posted before 9 AM ET to account for any changes in our model’s outlook and in Dealer Positioning.
Good luck and good trading!
