
Market Insights: Thursday, September 10th, 2026
Market Overview
US stocks dropped for a fourth straight session Thursday as surging oil prices and climbing Treasury yields kept the pressure on, with the Dow, S&P 500, and Nasdaq each falling around 0.6%. Wholesale inflation added to the unease, with the Producer Price Index rising 5.4% year-over-year and 4.6% on a core basis — largely in line with expectations, but still enough to keep rate hike fears alive heading into Friday's consumer inflation report. Fed rate hike odds continued to build, with bond yields hitting their highest levels since 2023 as the market braces for next week's Fed meeting. Mortgage rates also crossed 7% for the first time in over a year, caught in the crossfire of rising oil, hot inflation data, and Trump's proposed $5,000 payment to every adult American if Republicans hold Congress in November.
Oil was the headline driver again, with Brent surging past $107 and WTI topping $101 for the first time since mid-May — both benchmarks up more than 10% over the past five sessions. Saudi Arabia disclosed to OPEC that its production had fallen to just 6.238 million barrels per day, the lowest since 1990, while escalating US-Iran conflict and Houthi attacks on Saudi energy facilities kept supply fears front and center. Gas prices climbed to a national average of $4.27, with diesel hitting $5.97. On the corporate side, Apple bounced back 3% as analysts at Oppenheimer called the iPhone Duo a potential market leader in foldables, and Alphabet edged up 0.6%, making the two the only Magnificent Seven names in the green. After the bell, Oracle reports earnings, giving the market a look at real AI spending demand.
SPY Performance
SPY opened at $758.03 and struggled to find any meaningful footing from the start, with the session high of $760.09 reached early before sellers reasserted control and pushed the tape back down toward the lower end of the range. The low of $756.64 marked the worst of the damage, and while the close of $757.89 came in slightly off that bottom, it still settled firmly in the lower half of the day's range — a continuation of the same discouraging pattern that has defined this market for days now. This is not a tape that is trying to find a bottom. It's a tape that keeps testing lower and failing to generate any real buying conviction when it does.
SPY finished down 0.59%, making today's loss the steepest in this current losing streak and doing nothing to suggest the selling pressure is anywhere close to exhausting itself. Volume came in at 40.00 million shares, near average, which actually makes the decline more concerning — this wasn't a low-conviction drift lower, it was a session where normal participation showed up and still couldn't lift prices. The VIX surged 8.93% to close at 17.93, an aggressive move that signals fear is accelerating rapidly as the market continues to break down. Five straight sessions of closes near the lower end of the daily range, combined with a VIX that is now pushing toward levels that historically mark genuine market stress, puts bulls in a very difficult position. They need a credible stand soon, because every day without one gives the bears more confidence and more momentum.
Major Indices Performance
The Russell 2000 took the hardest hit on the day, falling 0.96% and once again signaling that institutional money continues to rotate away from smaller, more rate-sensitive companies. Small-caps tend to carry more variable-rate debt and have thinner margins to absorb higher borrowing costs, so persistent pressure in this corner of the market is a telling sign that the yield environment is doing real damage beneath the surface.
The Dow and Nasdaq essentially tied for second place in terms of damage, with the Dow sliding 0.60% and the Nasdaq dropping 0.65%. The Dow's decline was broad-based across blue chips, with no sector stepping up to absorb the selling. The Nasdaq's losses were driven largely by weakness in high-multiple growth names, which remain especially vulnerable when the bond market is pushing back. The S&P 500 also finished in negative territory, keeping the overall tone firmly in the bear camp for another session.
The VIX surged 8.93% to close at 17.93, which is a significant escalation from an already elevated reading. That's the kind of volatility expansion that tells you options traders are actively pricing in more turbulence ahead, not less. When the VIX is climbing this aggressively across consecutive sessions, it creates a self-reinforcing dynamic — institutional buyers stay on the sidelines, hedgers get more aggressive, and any attempted rally faces immediate overhead resistance from traders using strength to reduce exposure rather than add to it.
Notable Stock Movements
NVIDIA took the title of biggest loser inside the Magnificent Seven today, dropping -2.37% to lead the group lower. That's a significant move for the chip giant, and given how much index weight NVIDIA carries after its meteoric rise, a selloff of that magnitude doesn't just hurt one stock — it ripples through sentiment and puts a ceiling on any attempted recovery across the broader complex.
The overall Magnificent Seven picture was mostly red again, continuing a pattern of collective weakness that's become hard to ignore. Apple, Alphabet, and Microsoft managed to finish in the green, which is a slightly better showing than recent sessions where just one name held up while the rest sold off. But three green closes against a backdrop of broad market losses doesn't signal conviction — it signals survivors, not leadership. When the group's biggest momentum name is getting hit the hardest, the green closes elsewhere feel more like relative strength than genuine buying interest.
The read from mega-cap tech today still skews bearish, and it fits neatly with what the rest of the market was reflecting. The Nasdaq dropped -0.65%, consistent with a session where growth names faced the heaviest headwinds. Until the Magnificent Seven can get the majority of its members pushing higher in a coordinated way — especially names like NVIDIA that carry the most momentum weight — it's hard to make a case that this group is ready to resume its role as a market engine. Right now, it's still contributing to drag more than it's providing lift.
Commodity and Cryptocurrency Updates
Crude oil is on an absolute tear, surging another 6.82% today and closing at $102.60. Black gold has now rallied well above any reasonable expectation, and the combination of tight supply and geopolitical pressure continues to hand the bulls everything they need. At these levels, the inflationary story gets harder and harder to dismiss — energy prices this elevated feed directly into the data policymakers are scrutinizing most closely, and a sustained presence above $70 makes any serious conversation about easing feel increasingly disconnected from reality.
Gold took a step back today, slipping 1.16% to close at $4,365. After yesterday's strong rebound, a pullback like this isn't alarming on its own — the metal has been in a well-supported uptrend, and one down day doesn't change that narrative. Central bank demand and macro uncertainty remain the structural pillars here, and traders who've been riding this move higher will be watching closely to see whether buyers step back in quickly or whether the momentum needs a longer reset before the next leg up.
Bitcoin extended its recent weakness, falling another 1.42% and closing below $77,147. The near-flat session from yesterday turned out to be a head fake rather than a floor, and today's decline puts the pressure back squarely on the bulls. The show-me phase is very much still in effect — until Bitcoin can put together a convincing string of higher closes with real volume behind them, this market continues to reward patience over aggression.
Treasury Yield Information
The 10-year Treasury yield continued its march higher today, climbing another 2.21% to close at 4.940%. That puts yields just 6 basis points away from the 5% threshold — a level that, within our framework, signals genuinely severe pressure on equity valuations. This is no longer a distant warning light flashing on the dashboard. It's right in front of the windshield.
The framework tells the story clearly. Above 4.5% creates a real discount rate headwind — that's been the operating environment for some time now. Crossing 4.800% shifted things from uncomfortable to dangerous, and today's 4.940% close means yields have pushed 14 basis points deeper into that deterioration zone since yesterday's 4.840% print. Every tick higher tightens the screws on growth stock multiples and makes the cost of capital conversation more urgent across every sector. Equity rallies attempted in this environment are fighting an increasingly steep uphill battle.
The 5% level is now just 6 basis points away, and that gap can vanish in a single session. One stronger-than-expected inflation reading, one hawkish Fed headline, one surprise in the jobs data — any of those catalysts could push yields through that ceiling before the open even settles. Beyond 5%, the framework calls for significant risk to equities broadly, and the 5.2% level — where a 20% or greater correction becomes the base-case expectation — is no longer a theoretical extreme worth brushing aside. The math is getting uncomfortable fast. What to watch is straightforward: yields need to close back below 4.800% to give equity bulls any real footing. Until that happens, the bond market is running this show, and the burden of proof remains entirely on the upside.
Previous Day’s Forecast Analysis
Yesterday's forecast had SPY projected to trade within a $757 to $770 range, a thirteen-point window that the model classified as trending territory — meaning the expectation was for a directional move rather than range-bound chop. With Wednesday's close at $762.40 sitting in the lower half of that projected range, the near-term bias heading into Thursday was firmly bearish, as buyers had not shown the kind of conviction needed to suggest stabilization was imminent.
The most critical level flagged for Thursday's session was $760, identified as the key structural floor holding the pullback together. A clean break there was expected to open a quick slide toward $757, the max downside target. To the upside, $763 was the first level bulls needed to defend early in the session — losing it cleanly was framed as a serious warning sign. From there, $765 was the first meaningful recovery level, followed by $767 as the next decision point, with $768 identified as the true gate for any tape repair. The model was explicit that sellers controlled the session until $768 was reclaimed, and $770 represented the heaviest overhead concentration and the cap on the expected move.
The recommended trading approach called for position sizing in the 50-60% range with stop-losses in the 0.75-1.0% band from entry, reflecting the environment of accelerating volatility. On the long side, the preferred entry was a firm stabilization around $762-$763 with volume confirmation, targeting $768-$769 initially and $772-$773 on follow-through, with stops below $760.50. On the short side, a decisive break through $760.50-$761 on expanding volume was the trigger, targeting $757-$758 with $754-$755 as a secondary target if momentum built, with stops above $764.
Market Performance vs. Forecast
Thursday's session delivered another bearish outcome that continued to validate the model's directional framework, even as price action pushed into the lower end of the projected range with more force than the base case anticipated. The forecast had established a clear bearish tilt heading into the session, identified $760 as the critical floor holding the pullback together, and mapped out a falling market scenario with a short trigger at $760.50-$761 and a primary profit target of $757-$758. SPY opened at $758.03, immediately signaling that sellers had already done significant damage in the premarket, and the tape spent the entire session pinned in a tight range between $756.64 and $760.09 — never once offering bulls a meaningful opportunity to reclaim the levels the forecast identified as necessary for any tone shift.
What the model got right was the directional conviction and the downside target zone. The falling market scenario explicitly called out $757-$758 as the primary profit target if sellers built real momentum through $760.50, and Thursday's close at $757.89 landed squarely inside that window. The session high of $760.09 barely grazed the lower boundary of the short trigger zone before rolling back over, which means the breakdown structure the model outlined played out with notable precision at the target level. Stops on short positions were flagged above $764, and price never came close to threatening that level — risk management protocols protected capital throughout the session without ever being tested.
The open at $758.03 did gap below the short trigger zone, which meant the clean entry setup described in the forecast was partially absorbed by the premarket move. The model does not account for overnight developments or premarket catalysts that can front-run intraday setups, and those kinds of external forces can compress the available entry window without invalidating the directional thesis. The VIX surging 8.93% to 17.93 — a significantly more aggressive vol expansion than the prior session's already-elevated 4.71% jump — confirms that institutional hedging activity accelerated sharply and introduced intraday volatility beyond the model's base case. Even so, the directional bias, the structural breakdown levels, and the profit target zone all confirmed again, which is exactly the kind of consistent framework performance that keeps traders on the right side of the tape. The model continues to adapt and deliver well-defined levels to operate from heading into Friday's session.
Premarket Analysis Summary
The premarket analysis posted at market open set SPY's projected range for the session between $755 as max downside and $770 as max upside, with spot entering at $761.90 in a put-dominated tape for the third straight lower session. The defining gate level was identified at $764, the minimum threshold buyers needed to reclaim before the tape could begin to repair, with $766 flagged as the heaviest concentration overhead and the true bull target. The expected move spanned six points, and the analysis was clear that $760 was the most important level of the day — the line in the sand for the third consecutive session — with a clean break there described as the scenario that could get ugly fast. The premarket framed the session as a binary decision: hold $760 and reclaim $763, or lose it and expect a fast trip to $758.
The session answered that question almost immediately, as SPY opened well below the critical battleground at $758.03, skipping past both $760 and $761 entirely and landing directly in the downside danger zone the premarket had warned about. The high of $760.09 barely grazed the $760 line in the sand before sellers reasserted control, confirming that level had already broken in spirit before the open bell. Price drifted to a low of $756.64, slicing through the $758 point of last hope that the premarket called the floor holding the whole move together, and closing at $757.89, a loss of 0.59%. The entire upside stack from $763 through $770 went completely untouched, and the VIX surged 8.93% to 17.93, underscoring the accelerating defensive tone the premarket had flagged as the likely outcome of a $760 breakdown.
Validation of the Analysis
Today's session delivered a swift, clean validation of the premarket framework, and any trader armed with those levels had a decisive edge from the opening bell. SPY gapped down hard at the open, printing $758.03 — which told the whole story immediately. The premarket was explicit: losing 760 cleanly could get ugly fast, and that level had already been surrendered before the first trade of the day. The analysis flagged 760 as the most important level of the session for the third day running, the line in the sand holding the entire pullback together, and price opened well below it, confirming sellers had taken full control overnight exactly as the bearish framing anticipated.
The downside sequence then played out with textbook precision. The premarket identified 758 as the point of last hope and the floor holding this whole move together, and SPY's high of $760.09 barely reclaimed that zone before rolling back over — buyers could not even hold a bounce into the 760 battle level that had been the day's defining line. From there, price sliced through 758 and tagged a session low of $756.64, marching directly toward the 755 max downside target the premarket had designated as the bottom of the expected move. That low landed right in the pocket between 755 and 758, validating both levels as the live boundaries of the range. SPY closed at $757.89, settled neatly inside the 755-to-758 zone the analysis outlined as the final support structure. The VIX surging 8.93% to 17.93 confirmed the escalating put-dominated tone the premarket established coming in. From the 760 line-in-the-sand breakdown to the 758 floor breach to the 755 max downside target, today's framework mapped the entire session with sharp, actionable accuracy.
Looking Ahead
With the economic calendar showing no high-impact releases scheduled for Friday, traders head into the session without a major macro catalyst to navigate. No jobs data, no inflation print, no Fed commentary on the docket — just a clean slate where price action gets to tell the whole story. That kind of setup puts extra weight on how the market chooses to close out the week, and whether any momentum built earlier in the week has legs or fades into the weekend.
On a quiet tape like this, sector rotation and breadth trends become the sharpest tools for reading real conviction. Any unscheduled headline — whether it comes from a Fed official or a geopolitical development — will hit harder than usual given the absence of scheduled anchors, so staying flexible and letting price lead the decision-making is the right approach. Fridays without catalysts can drift or accelerate without warning, which means discipline and clean risk management matter just as much, if not more, than on a busy macro day.
Market Sentiment and Key Levels
The directional bias today leans bearish, with bears firmly in control after SPY shed 0.59% on near-average volume of 40.00M shares. The VIX surging 8.93% to 17.93 is the most aggressive fear print we've seen in this recent stretch — that's not noise, that's the market sending a clear signal that participants are actively buying protection. When the VIX moves nearly 9% in a single session, it tells you traders aren't just cautious, they're repositioning. The broad index damage confirms the bearish tone, with the Russell 2000 taking the worst of it at -0.96%, followed by the Dow at -0.60% and the Nasdaq at -0.65%. Small-cap underperformance continues to flash a warning — those names tend to lead on the way down when risk appetite deteriorates, and today's Russell print suggests the selling isn't done.
Key resistance sits at $760.09, the session high, which SPY tested early and couldn't hold. A reclaim of that level on strong, expanding volume would be the first sign bulls can mount a credible defense. Above that, clearing $760.09 convincingly could open the door toward a retest of recent highs, but that scenario feels distant given current momentum. On the downside, $756.64 — today's session low — is the line to watch. A decisive close beneath that level hands bears a technical green light and likely invites accelerated selling into the next meaningful support zone. Gold pulling back 1.16% to $4,365 and Bitcoin slipping below $77,147 don't offer the safe-haven signal bulls would want, while crude oil's sharp move adds an inflationary overhang that complicates the Fed's calculus. With the 10-year yield closing at 4.940, equity valuations remain under real pressure. Bears hold the edge here, and the tape is behaving with increasing purpose.
Expected Price Action
Friday's session brings actionable intelligence generated by our AI model, with SPY projected to trade within a range defined by $755 on the downside and $770 as the max upside target. That fifteen-point window puts this firmly in trending territory, meaning traders should be positioned for a directional move rather than sideways consolidation. Thursday's close at $757.89 sits in the lower half of the projected range, which keeps the near-term bias squarely bearish heading into Friday's open — buyers have not stepped up with any meaningful conviction, and the tape continues to reflect a put-dominated environment that has leaned on sellers all week.
The defining level to watch on Friday is $758, which the premarket analysis flags as the point of last hope and the floor holding this entire pullback together. A clean break below $758 leaves very little cushion before $755 — the bottom of the expected move and max downside. Above current spot, the first thing buyers need to show is a reclaim of $760, which has served as the line in the sand for multiple sessions now. Losing it cleanly and early is a serious warning sign that could accelerate selling fast. Above $760, the first meaningful step toward tape repair is $763, and beyond that $766 is the heaviest overhead concentration — that's the level bulls truly need to reclaim to flip the tone. Until $766 is back in hand, sellers retain control. The $768 level caps the upper end of the expected move, with $770 representing max upside and the most significant overhead resistance on the board. With VIX surging 8.93% to close at 17.93 and the tape sitting dangerously close to critical support, the burden remains entirely on buyers. Watch for volume conviction — a high-volume reclaim of $763 and above opens the door to recovery, while any low-volume rollover that surrenders $758 early is a clear signal to step aside and let the sellers work.
Trading Strategy
The VIX surging 8.93% to 17.93 is a sharp escalation that demands respect. At 17.93 we're approaching territory where hedging activity becomes more reflexive and institutional risk management kicks into a higher gear. A jump of nearly 9% in a single session tells you fear is expanding at a pace that goes beyond routine profit-taking — this is the market pricing in genuine uncertainty, and the fact that it arrived on near-average volume makes it more concerning, not less. When vol spikes hard without a massive capitulation-style tape to justify it, it typically means smart money is building protection ahead of a move rather than reacting to one already in progress. Keep position sizing in the 40-50% range and tighten stop-losses to the 0.75% band from entry. This is not an environment for conviction sizing — disciplined entries, smaller positions, and pre-defined exits are the only rational approach until VIX starts to mean-revert and the tape finds a cleaner rhythm.
In a rising market scenario, the bulls need to reclaim and hold the $762-$763 zone with conviction to suggest the session's moderate decline was a contained shakeout rather than the beginning of a more sustained rollover. The preferred long entry is a clean stabilization around $758-$759, right near where price closed, with buyers defending the level on credible volume that reflects real demand rather than a low-conviction drift. If that zone holds cleanly through the first hour, the initial profit target is $763-$764, with a stretch target of $767-$768 on confirmed follow-through and broadening participation across indices. Stops on longs belong below $755.50 to protect against a deeper flush through the day's low. Do not chase any gap-up open above $763 on light tape — let price prove the level before committing to size.
In a falling market scenario, $756-$757 is the structural zone to watch closely. A decisive break below that area on expanding selling pressure is your short trigger, and it opens the door to $752-$753 as the primary profit target, with $749-$750 in play if sellers build real momentum and volume accelerates on the break. Stops on shorts belong above $760 to guard against a sharp reversal back through the prior close area. If the market opens weak and immediately slices through $756 without a credible buyer response, that's a high-conviction short entry at measured size. With VIX at 17.93 and moving aggressively higher, the probability of a vol-driven downside flush is meaningfully elevated — respect your targets, cover into support levels methodically, and don't let a winning short overstay its welcome.
Model’s Projected Range
SPY's projected maximum range for Friday is $749 to $768, with the Put side dominating in an expanding band that suggests trending price action with intermittent chop. Friday brings CPI data which will be a significant catalyst given today's weak PPI print and could drive another leg lower if inflation comes in hot, or spark a relief rally if it cools. SPY closed at $757.89, down 1.07% on the day, after opening at $758.03 and trading between a high of $760.09 and a low of $756.64 on average volume as the market digested the weak PPI data and continued selling pressure. SPY is trading near our model's first support at $755, with the 50 DMA providing a critical technical floor that held today. The long-term bull trend remains intact above $640 with SPY well above structural support. As long as price holds above key structural levels, this remains a broader dip-buying environment. If our first resistance at $758 breaks, price targets $760, while a break of first support at $755 would target $750. Should $749 fail to hold, there is little to keep price from falling toward $745. Absent a catalyst, resistance sits at $758, $760, $764 and $768 with support at $755, $750, $749 and $745. The VIX closed at 17.93, up 7.48%, reflecting a significant increase in fear as the selling pressure intensified. SPY closed near the 50 DMA with structural support well below current price levels.
Market State Indicator (MSI) Forecast
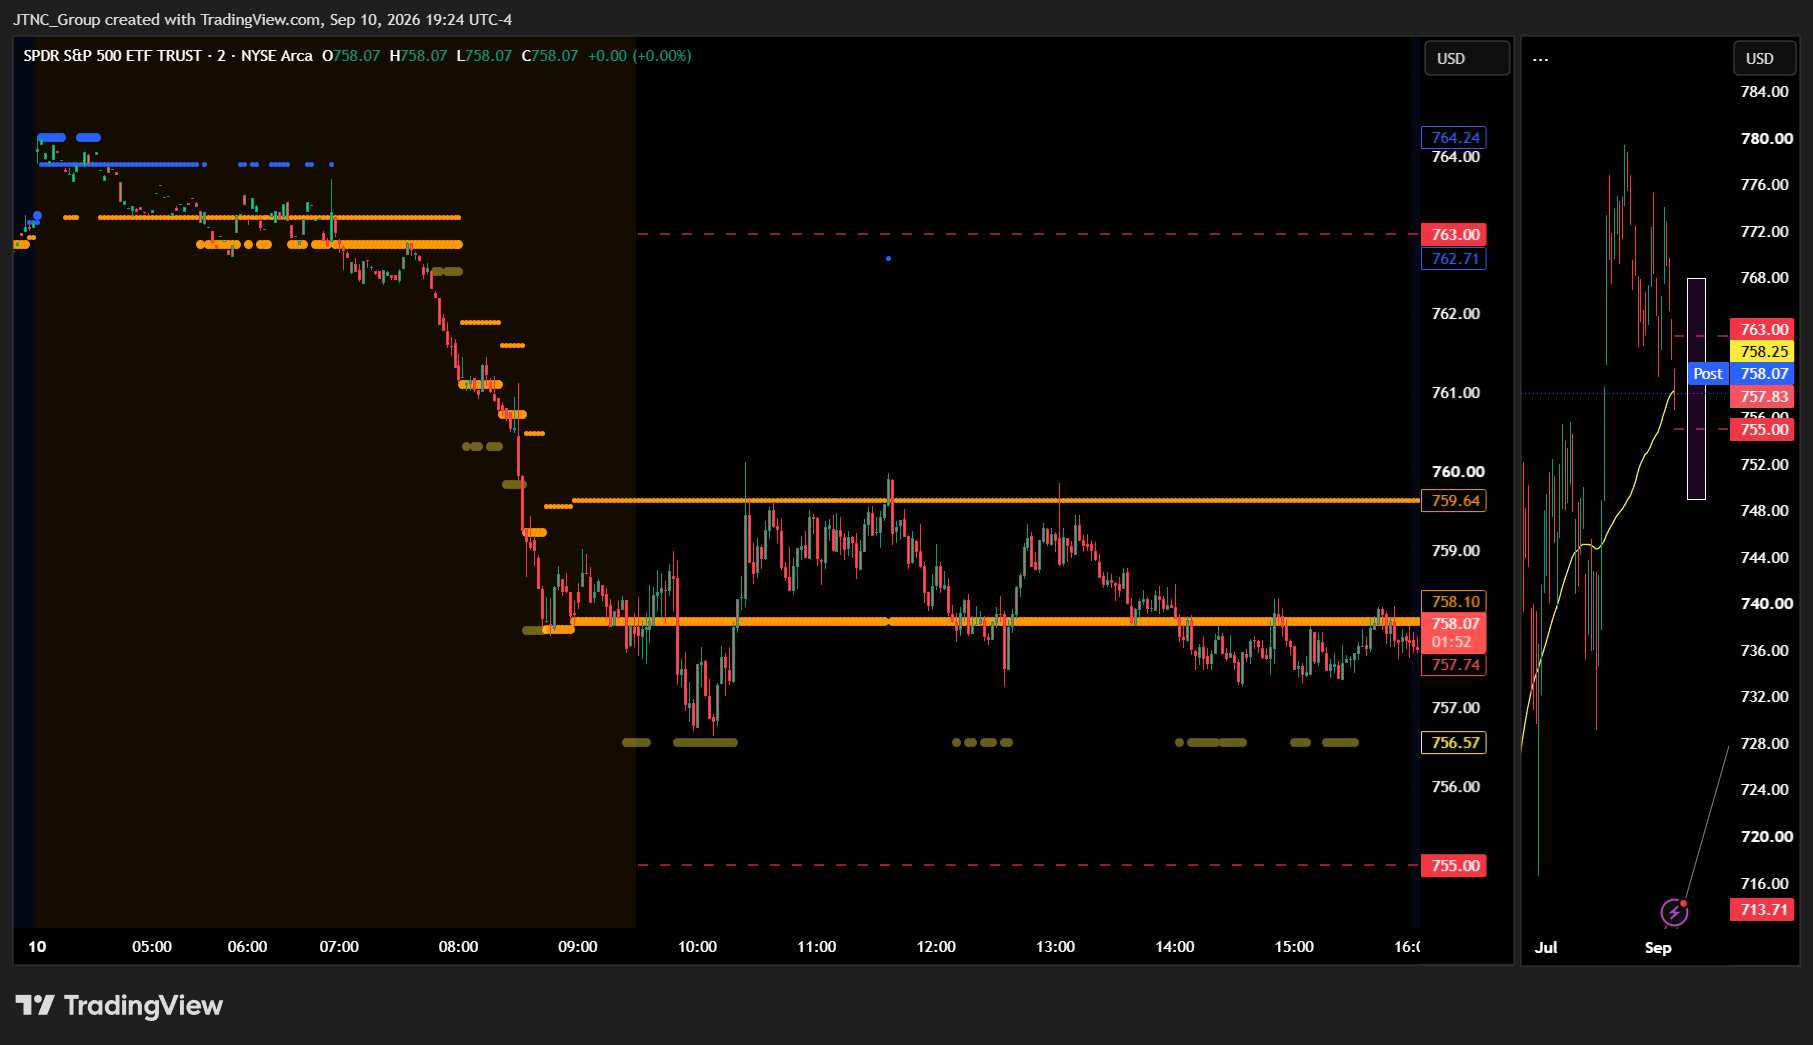
Current Market State Overview:
The MSI ended in a Bearish Trending Market State with SPY closing at $757.89. Since SPY closed below MSI support at $758.10, that former support now becomes resistance heading into Friday. Extended targets were not printing at the close. Extended targets were active during premarket printing below as the MSI rescaled lower several times in rapid succession, foretelling what the day would produce. The MSI rescaled lower overnight several times in rapid succession with extended targets below. By the open SPY was testing the 50 DMA which did hold. There were two rallies off these levels but both failed right at MSI resistance which saw SPY fall and close right at MSI support turned resistance. Without extended targets at the close and the narrow $1.54 Bearish Trending spread, the MSI is forecasting likely two-way trading on Friday with SPY testing the day's highs and lows. CPI is tomorrow and given today's weak PPI, this could be another catalyst to move SPY further down range, breaking the day's lows. MSI support is $758.10 with resistance at $759.64.
Key Levels and Market Movements:
Wednesday we stated the MSI was forecasting consolidation and Thursday delivered a directional session driven by weak PPI data that shifted sentiment decisively to the downside. The MSI had already rescaled lower several times in rapid succession overnight with extended targets below, giving traders early warning that selling pressure was building. SPY opened at $758.03 and the 50 DMA provided the first support test of the day. Two separate rallies attempted to reclaim higher ground but both stalled right at MSI resistance at $759.64 — textbook sell setups for traders following the framework. Each failure at resistance led to another test of support, with SPY ultimately closing at $757.89 right at MSI support turned resistance after tagging a low of $756.64. The VIX surged 7.48% to 17.93, a significant expansion in fear that confirmed the bearish undertone. At minimum it was a three-for-three session for traders following the framework. It was an easy day to read with substantial setups, all identified through proper context, patience, and flexibility while leveraging the MSI, premarket levels, and market structure rather than forcing trades. The MSI continues to prove its reliability as the cornerstone of our trading process.
Trading Strategy Based on MSI:
Friday brings CPI data which can introduce significant volatility, so traders should be ready to trade what they see rather than predict. Given today's weak PPI, a hot CPI could be another catalyst to break the day's lows, while a cool CPI could spark a relief rally. The narrow $1.54 Bearish Trending spread is forecasting likely two-way trading with SPY testing the day's highs and lows.
Bulls want to see CPI come in cool and SPY reclaim $758.10 with the MSI rescaling into a Bullish Trending state. If extended targets print above, the 50 DMA bounce gains credibility and price could push toward $760 and higher. Bears want to see $758.10 continue to act as resistance and a hot CPI break the day's lows at $756.64. If the MSI rescales lower with extended targets below, the selloff has room to run toward $755 and below. Failed rallies at MSI resistance and failed breakdowns at support are the highest-probability setups.
The long-term bull trend remains intact above $640 and failed breakouts and failed breakdowns continue to offer the highest-probability setups. Remain flexible, avoid trading during Ranging Market States unless a clear failed breakout or breakdown presents itself, and ensure all trades are fully aligned with MSI signals. Providing real-time insights into market control, momentum shifts, and actionable levels, the MSI when integrated with our Pre-Market and Post-Market Reports continues to sharpen execution precision and elevate trade quality. If you haven't yet integrated MSI and our model levels into your process, now is the time. Contact your representative to get started as these tools are designed to support consistency and enhance performance.
Dealer Positioning Analysis
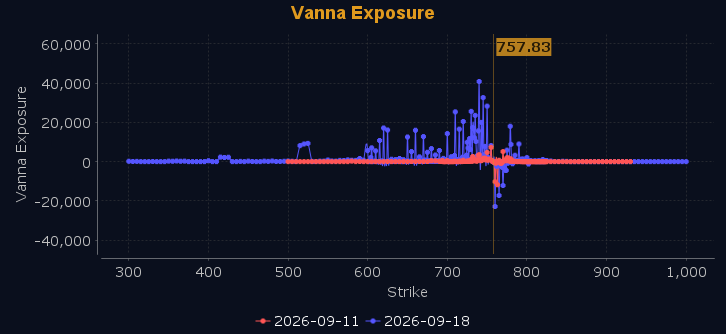
Dealers are selling SPY $764 to $785 and higher strike Calls while buying $758 to $763 Calls, indicating the Dealers' desire to participate in any rally on Friday. The ceiling for Friday appears to be $770. To the downside, Dealers are buying $757 to $680 and lower strike Puts in a 2:1 ratio to the Calls they're selling, displaying moderate concern that prices could move lower. Dealers are buying ATM Calls indicating their desire to participate in any rally Friday. They have not increased their hedges which implies some confidence that price may find a bottom in the current range. The $760 to $770 range may be where the market gets stuck for some time. Dealers are not selling ATM Puts so their conviction on any relief rally is not very strong. Below $758 is bearish and above $760 is bullish with everything in between being chop and trap filled. Should SPY fail to hold $755, $750 is in play. A move above $760 may find little resistance until $763 where price is likely to stall or reverse. Dealer positioning is unchanged at bullish.
Looking Ahead to Next Friday:
Dealers are selling SPY $774 to $810 and higher strike Calls for the week ahead while buying $758 to $773 Calls, indicating the Dealers' desire to participate in any rally next week. The ceiling for the week appears to be $779. To the downside, Dealers are buying $757 to $620 and lower strike Puts in a 4:1 ratio to the Calls they're selling, displaying heightened concern that prices could move lower. Dealers are buying ATM Calls indicating their desire to participate in any rally next week but they increased their hedges which implies they see material risk that SPY could trade lower next week. We remain bullish above $775 but below $763 we are bearish with the wide range in between being nothing but noise and chop which will trap most traders. For the week Dealer positioning has changed to bearish. We advise reviewing Dealer positioning daily for directional clues. These positions evolve quickly and tracking them is essential for staying ahead of shifting market sentiment.
Recommendation for Traders
With SPY closing at $757.89 and the 10-year yield pressing toward 5%, the bias is firmly bearish. Favor shorts on any failed bounce toward $760, with stops above $760.09. A break below $756.64 opens the door to further downside.
Keep size small and risk tight — VIX surging 8.93% to 17.93 signals real fear entering the market, and yields this close to 5% are a serious headwind. Always review the premarket analysis posted before 9 AM ET for any changes in the model's outlook and Dealer Positioning.
Good luck and good trading!
