
Market Insights: Thursday, August 6th, 2026
Market Overview
US stocks slipped again on Thursday as rising Treasury yields, a fresh round of earnings, and ongoing Strait of Hormuz developments kept investors cautious. The Dow fell 0.9%, snapping its record-breaking win streak, while the S&P 500 dropped 0.2% and the Nasdaq edged down 0.1%. AI capital spending and valuation concerns continued to weigh on some tech names, with Sandisk and Western Digital taking punishing earnings reactions as investors remained laser-focused on AI monetization.
Oil climbed to $83 per barrel after Iran announced it had reached an agreement with Oman for a temporary shipping route through the Strait of Hormuz, though Iranian officials noted the deal would only be finalized "if certain third parties do not obstruct this process." That geopolitical uncertainty helped push Treasury yields higher, with the 30-year climbing to 5.21% and the 10-year rising to 4.67%. On the labor front, a Challenger, Gray & Christmas report showed July layoffs fell to their lowest level in two years, while first-time jobless claims ticked up slightly to 199,000 — both setting the stage for Friday's closely watched July employment report.
SPY Performance
SPY opened at $770.21 and made a relatively quiet run at the highs early, tagging $771.82 before the session lost momentum and price began drifting lower. The low of $767.46 was printed as sellers nudged the tape down through the afternoon, though the close at $768.60 came in off that low, suggesting a mild bid emerged late in the day to soften the decline. It's a familiar pattern — an early attempt to build on recent strength, followed by gradual fade, without any real urgency in either direction. Not alarming, but not inspiring either.
SPY finished down 0.15%, which makes back-to-back sessions of modest red candles following the big recovery push. Volume came in at 33.04 million shares, below average, meaning the selling pressure was light and unconvincing — more of a market catching its breath than anything resembling distribution. The VIX dropped 2.91% to close at 15.35, continuing its quiet retreat and reinforcing the idea that market participants aren't particularly worried about the shallow pullback. Just like yesterday, when SPY dips slightly and volatility is still leaking lower at the same time, the market is telegraphing calm rather than concern. Two consecutive minor down days on shrinking volume with a fading VIX is a setup that typically resolves higher — the path of least resistance remains up until the data says otherwise.
Major Indices Performance
The Nasdaq was the relative outperformer among the major indices today, though "outperformer" is generous given it still finished down 0.06% — essentially flat on the session. The modest softness in growth and tech names was enough to nudge the index into the red, but the damage was contained compared to what we saw in prior sessions when selling pressure was more broad-based.
The Russell 2000 came in next, dropping 0.64%, which continues the pattern of small-cap fragility that's been creeping into the market. Small-caps need a cooperative interest rate environment and genuine risk appetite to sustain momentum, and right now neither of those conditions is particularly favorable. When small-caps are shedding more than half a percent on a relatively quiet day, it tells you the market's risk-on engine is running low on fuel.
The Dow was the clear laggard today, falling 0.85% and dragging blue-chip sentiment lower in a way that stands in sharp contrast to the safety role it played in the prior session. Dow weakness of this magnitude typically reflects something more than just profit-taking — it suggests institutional money is getting cautious across the board, not just in the growthier corners of the market. The S&P 500 held up comparatively well with just a fractional 0.15% decline, highlighting how the damage today was unevenly distributed. Overall, this felt like a session where sellers had modest but consistent control, and the bulls didn't have enough conviction to push back.
Notable Stock Movements
Alphabet led the Magnificent Seven lower for the second straight session, this time shedding -1.29% to once again stand out as the group's biggest drag. Back-to-back losses from the same name is a pattern worth watching — it suggests the selling pressure in Alphabet isn't just a one-day event, and when the largest advertising and AI platform in the world can't find its footing, it weighs on sentiment across the entire growth complex. The decline was more measured than yesterday's sharp drop, but consecutive red closes from a name this influential keep the mood cautious.
The rest of the Magnificent Seven were mostly in the red alongside Alphabet, making it another broadly bearish session for the cohort. Microsoft, Apple, and Meta were the exceptions, each managing to close in positive territory and providing at least some offset to the downside pressure elsewhere. The fact that the same three names are doing the heavy lifting two days in a row is notable — it tells you where the relative strength is sitting within the group and which names investors are willing to defend at current levels.
Zoom out and the overall tone from the Magnificent Seven today reflects the muted, slightly risk-off character of the broader tape. The group didn't collapse, but it didn't inspire confidence either. With Alphabet now posting losses in consecutive sessions and the majority of the cohort finishing red, the growth leadership that powered so much of this year's rally is showing some strain. The bulls need to see more than three names holding up to feel comfortable — right now the weight is clearly tilted to the bears within this group.
Commodity and Cryptocurrency Updates
Crude oil surged 3.26% today to settle at $77.67, pushing even further above the $70 level and reinforcing the idea that this rally has real staying power. At these prices, crude has now moved well beyond what any near-term model target would have suggested, and the drivers behind it — geopolitical tensions, supply constraints, and persistent demand — aren't showing signs of fading. A sustained run above $70 keeps energy's contribution to inflation front and center, and that's a headache the Fed simply doesn't need right now. The longer crude holds this elevated range, the more complicated the path to rate cuts becomes.
Gold added another 1.38% today, closing at $4,304 and holding firm near the record territory it blasted into during yesterday's massive session. After a 5.18% single-day surge, seeing the metal consolidate at these levels rather than give back gains is actually a bullish sign — it suggests buyers are defending the move rather than locking in profits. The structural demand story hasn't changed, and gold sitting above $4,300 with this kind of follow-through keeps the momentum firmly intact.
Bitcoin gave back a small amount today, slipping 0.21% to close just above $64,464. It's a minor dip after a string of positive sessions, and nothing about the price structure looks broken from here. The $64,000 zone continues to act as a meaningful support area, and as long as Bitcoin holds above it, the broader setup remains constructive. A little cooling off after a steady run is normal — the question is whether buyers step back in to push toward the next leg higher.
Treasury Yield Information
The 10-year Treasury yield snapped its three-day winning streak today, climbing 1.15% to close at 4.670%. That reversal is exactly the scenario flagged as the key risk — a retreat that looked promising but failed to build momentum, sending yields back in the wrong direction. The three-session pullback now looks more like consolidation than a genuine trend change, and that's a cautionary signal for anyone who was growing optimistic about bond market relief.
At 4.670%, yields are sitting 17 basis points above the 4.5% threshold where equity pressure kicks in, and the cushion to the 4.8% selloff trigger has narrowed back to just 13 basis points. That's a meaningful shift from where things stood yesterday, when the gap to 4.8% was at its widest in recent memory. Today's move erased most of that breathing room in a single session. The broad market weakness — with the Dow, Russell 2000, and Nasdaq all finishing in the red — is consistent with what you'd expect when yields are pushing higher inside an already-elevated range.
The 5% and 5.2% danger zones are not in play today, but the path back toward them just got a little shorter. The real question now is whether this bounce in yields has follow-through. A push back toward 4.750% would confirm that the recent dip was nothing more than a head fake, and that would keep meaningful pressure on equities heading into the next trading sessions. For bulls to regain control of the narrative, yields need to reverse quickly and make a convincing move back below 4.6% — anything short of that keeps the bond market in the driver's seat for the wrong reasons.
Previous Day’s Forecast Analysis
Yesterday's forecast projected SPY trading within a sixteen-point range spanning $767 on the downside to $783 as the max upside target, with Wednesday's close at $769.77 placing the tape right in the middle of that window. The model flagged $770 as the most critical level heading into the session, with bulls needing to reclaim it early to keep the bullish structure intact. A hold above $770 was expected to put $772, $773, and eventually $775 back in play, with $780 identified as the major round-number pivot and $782 to $783 marking the ceiling of the projected range. On the downside, a clean break of $770 was seen as a tone-changer that would target $767, the floor of the expected move. The VIX dropping 6.06% to 15.50 tilted the bias modestly bullish, though the forecast noted that bulls had to do the work of reclaiming that key level first.
The trading strategy leaned on that same $770 pivot as the line in the sand between offense and defense. On the long side, the preferred entry was a clean push through $772 to $773 that targeted $775 to $776, with a more conservative setup being a pullback toward $766 to $767 that bounced with conviction. On the short side, a failure to hold $769.52 opened the door to a short targeting $766 to $767, with stops above $772, and further weakness below $766 was expected to target $762 to $763 before setting up a flush toward $758 to $759. Position sizing was recommended in the 85-95% range given the calm VIX environment, with stop-losses kept tight in the 1.0-1.25% range. The strategy emphasized patience, clean setups, and confirmation of participation before committing full size, warning that the low VIX environment made sharp intraday reversals a real risk for traders who overstayed short positions.
Market Performance vs. Forecast
Thursday's session opened at $770.21, landing just above the $769-770 decision zone the forecast flagged as the first critical test of buyer conviction — a direct confirmation of the level architecture the model built heading into the day. The projected range defined $767 as the floor and $783 as the ceiling, and price respected that structure throughout the session, with the intraday low of $767.46 tagging the exact floor level before buyers stepped in to defend it. That's the model doing its job — identifying where the tape finds its footing before the session even begins.
The close at $768.60 represented a modest decline of 0.15%, settling near the lower end of the projected range after price briefly tested $767 support. The forecast specifically warned that a failure to hold $769-770 would accelerate selling pressure toward $767, and that's precisely how the session unfolded — sellers pushed through the $769-770 zone, the model's downside target absorbed the flush, and price stabilized. Traders working the falling market scenario who targeted $766-767 had the framework working in their favor at exactly the right moment. External catalysts introduced selling pressure that kept bulls from reclaiming $772-773 and pressing toward the upper range, and the model does not account for unpredictable newsflow-driven intraday dynamics that suppress buying participation. Risk management protocols protected capital for anyone holding long exposure above that zone. The VIX declining 2.91% to 15.35 confirmed the low-fear environment the framework anticipated, and below-average volume during a mild pullback signals an orderly session rather than a disorderly breakdown. The framework identified the right levels, the right risk parameters, and the right volatility read — and that reliability across varying tape conditions is exactly what makes it worth following every session.
Premarket Analysis Summary
The premarket analysis posted at market open identified SPY spot at $770.55 in a put-dominated environment, marking what the analysis described as the first real shift in tone after a relentless run higher. The expected move was framed with $778 as the maximum upside cap and $764 as the maximum downside floor. The defining gate above was set at $772 — the level buyers needed to reclaim with conviction to keep the uptrend intact, opening the path toward $775 as the next test, then $776 and $777 as the expected move top, and $778 as the ceiling of the range. The bias leaned toward the sellers for the first time in weeks given the put-dominated structure, with the analysis noting that until $772 was taken back, sellers held the edge. On the downside, $770 was identified as the immediate floor just below spot, with $769 as the level where selling could pick up speed, $768 as the most important battleground below carrying the heaviest battle, $765 as the next shelf if $768 gave way cleanly, and $764 as the max downside floor.
The actual session played out squarely within the downside scenario. SPY opened near spot at $770.21, made a modest push toward $772 with a session high of $771.82 — stopping just short of the gate — and then reversed lower, slicing through $770 and $769 before undercutting the critical $768 level with a session low of $767.46. SPY closed at $768.60, a loss of 0.15% on below-average volume. The premarket analysis had warned explicitly that a clean break of $768 would confirm the reversal and invite a deeper unwind, and the session low confirmed exactly that. The $764 max downside floor went untouched, and the VIX dropping 2.91% to 15.35 suggested the selling remained orderly rather than fear-driven, helping contain the damage above the bottom of the expected range.
Validation of the Analysis
Thursday's session validated the premarket framework with impressive precision, playing out almost entirely on the downside roadmap that was laid out before the open bell. SPY opened at $770.21, right at the spot price identified in the analysis, and the premarket couldn't have been clearer about what that meant — 772 was the gate above, and until buyers reclaimed it with conviction, sellers had the edge. Buyers never came close. The session high of $771.82 fell short of the 772 level by less than twenty cents, which was essentially the market confirming in real time that the gate was closed. That rejection at 772 was the first clean signal of the day and exactly what the premarket warned traders to watch for — no reclaim, no upside follow-through.
From there, the downside levels took over and the analysis guided the move step by step. The premarket identified 770 as the immediate floor and warned that losing it cleanly would open the door lower — SPY broke it and never looked back. The analysis then flagged 769 as where selling could pick up speed and 768 as the most important level below, the spot where the heaviest battle would sit. The session low of $767.46 punched through 768, which the premarket said would confirm the reversal and invite a deeper unwind — and that's exactly what happened. The close at $768.60 settled just above 768, right inside the zone the analysis identified as the contested battleground. The VIX dropping 2.91% to 15.35 was an interesting divergence given the selling pressure, but the price action itself told the whole story. From open rejection at 772 to the breakdown through 769 and 768, the premarket's downside framework mapped every meaningful level of Thursday's session before a single share traded.
Looking Ahead
Friday's calendar is loaded with the most market-moving data of the week. Average Hourly Earnings, Non-Farm Payrolls, and the Unemployment Rate all drop at the same time Friday morning, and that kind of triple-release can swing the tape hard in either direction before most traders finish their coffee. A stronger-than-expected payrolls number could reignite rate concerns and pressure equities, while a soft print might fuel a relief rally across the board.
The key is knowing your levels before that data hits. These releases have a way of triggering fast, emotional moves that reverse just as quickly, so discipline matters more than direction here. Whether you're looking to add exposure or trim risk, the jobs report Friday morning is the moment that sets the tone heading into next week.
Market Sentiment and Key Levels
The directional bias today leans mildly bearish, though the damage was contained enough that bulls haven't fully surrendered the tape. SPY opened at $770.21, briefly touched a high of $771.82, and then faded through the session to close at $768.60 — a -0.15% decline that looks modest on paper but reflects a familiar pattern of sellers capping early strength and grinding prices lower into the close. Volume came in at 33.04 million shares, below average, which tells you this wasn't a conviction move in either direction. The most constructive data point in today's session was the VIX dropping 2.91% to 15.35 — fear continues to recede even as equities slip, suggesting the market isn't in panic mode and that the pullback is more about digestion than distribution. That's a nuanced read, but it matters when you're trying to separate a healthy consolidation from something more ominous.
Key resistance sits at $771.82, today's intraday high. A move back above that level on improving volume would signal that bulls are retaking control and could open the door toward the $775 to $778 zone where overhead supply is likely to build. A sustained push through that range with real conviction would shift the short-term bias back to clearly bullish. On the downside, $767.46 is the immediate support floor — SPY's intraday low from today's session. A clean break below that level on rising volume raises the risk of a test toward the $763 to $765 area, which would start to concern even the more patient bulls. The Dow's heavier decline and small-cap weakness add to the cautious tone, and with the 10-year yield still elevated, rate sensitivity remains a live threat to any sustained rally attempt. The bulls are still in the game, but they need to answer the bell tomorrow.
Expected Price Action
Friday's session brings actionable intelligence generated by our AI model, with SPY projected to trade within a range defined by $764 on the downside and $778 as the max upside target. That fourteen-point window clears the trending threshold, meaning Friday is set up for directional movement rather than sideways consolidation. With Thursday's close at $768.60 sitting above the model's max downside target of $764 but below the $778 ceiling, price is positioned in the lower half of the projected range — a setup that puts the burden of proof squarely on the bulls heading into Friday's session.
The $768 level is the most critical battlefield heading into Friday. The premarket model flagged it as the heaviest decision point below, and Thursday's close right on top of it at $768.60 means the bulls are holding on by a thin margin. A clean move back above $770 would be the first sign that buyers are reasserting control, opening the door toward $772 and then $775 where the next meaningful test arrives. Above $775, the path extends to $776, $777, and ultimately $778 as the max upside target and ceiling of the expected move. On the downside, if $768 fails to hold in early trading, the model offers little cushion — $765 is the next shelf and $764 is the floor where the expected move bottoms out. Losing $768 cleanly would confirm the reversal that sellers have been pushing for and invite a faster unwind as profit-taking accelerates. The VIX dropping 2.91% to 15.35 reflects a modest reduction in fear, but with price anchored in the lower half of the range, the bias leans bearish until bulls reclaim $770 with conviction. Watch $768 as the line in the sand — how Friday trades around that level will set the tone for the entire session.
Trading Strategy
The VIX dropping 2.91% to 15.35 is a modestly supportive signal heading into the next session. Options traders continuing to shed protection suggests the broader market isn't pricing in imminent danger, and at 15.35, fear is running quite low — not at complacency extremes, but calm enough that traders can maintain normal-to-slightly-elevated position sizing in the 85-95% range. The quiet, below-average volume session combined with only a fractional decline on SPY keeps the tape from flashing any urgent warning signs, but the lack of committed buyers on the session means you shouldn't assume support is bulletproof. Keep stop-losses in the 1.0-1.25% range from entry and stay patient — low-volatility, low-volume environments can flip quickly on any macro headline, particularly with oil running hot and yields elevated.
In a falling market scenario, the first area to monitor is $768-769, where SPY closed and where early weakness would immediately test buyer resolve. A failure to hold $768.60 on a retest opens a short entry targeting $765-766, with stops placed above $772 to guard against a quick reversal. If sellers push through $765 with any conviction, the next meaningful floor sits at $762-763, which would represent a more aggressive breakdown and set up a short targeting $759-760. Don't chase shorts deep into oversold territory at these levels — with the VIX this low, snap reversals are common, and piling into a short without a confirming catalyst on meaningful volume is a low-probability strategy that tends to punish late entries hard.
In a rising market scenario, bulls need to reclaim and hold $771-772 early in the session to signal that the mild softness was nothing more than digestion. A clean breakout through that zone with solid participation targets $775-776, with $771.82 serving as the pivot that must flip from resistance to support on any retest. The more conservative long entry is a pullback toward $767-768 that holds cleanly and bounces with real buying pressure, targeting $771 as the first profit zone and $773-774 on follow-through momentum. Stops on longs belong below $763 to protect against a deeper leg down into prior support. With the VIX at 15.35, there's no reason to trade defensively — but confirm participation and breadth at your entry level before committing full size, because thin-volume strength can evaporate just as quickly as it appears.
Model’s Projected Range
SPY's projected maximum range for Friday is $761 to $775, with the Put side dominating in an expanding band that suggests trending price action with intermittent chop. Friday brings Average Hourly Earnings m/m, Non-Farm Employment Change, and the Unemployment Rate — a full NFP package that is likely to produce significant volatility particularly in the first hour of trading. SPY closed at $768.60, down 0.15%, after trading in a relatively tight range with a session high of $771.82 and a low of $767.46 off an open of $770.21, with volume coming in below average on a quiet tape. SPY remains in the $765 to $770 range that has defined recent trading, with the market continuing to digest macro crosscurrents including ongoing trade policy uncertainty keeping participants cautious heading into the jobs print. If SPY can clear first resistance at $770, the next target on our model moves up to $774, while a break of first support at $765 opens the door toward $762 — and if that deeper support gives way, there is little to keep price from falling toward $760. The long-term bull trend remains intact above $640 with SPY well above structural support. As long as price holds above key structural levels, this remains a broader dip-buying environment. Absent a catalyst, resistance sits at $770, $774, $775, $776, while support rests at $765, $762, $761, $760. With SPY closing near the lower half of Friday's projected range, we favor buying dips at $765 where our model shows the first meaningful floor. Bitcoin slipped just 0.21% to close above $64,464 while the MAG stocks were mostly red on the session led lower by Alphabet down 1.29%, though Microsoft bucked the trend with a solid 2.54% gain — mixed action across leadership groups that isn't alarming but bears watching into a high-impact data morning. The VIX closed at 15.35, down 2.91%, suggesting a modest reduction in fear heading into the jobs report, though that calm could reverse quickly on a hot or cold NFP print. SPY closed near the lower line of its near-term trend channel, with structural support holding in the $765 area and price needing to reclaim $770 to reassert near-term upside momentum.
Market State Indicator (MSI) Forecast
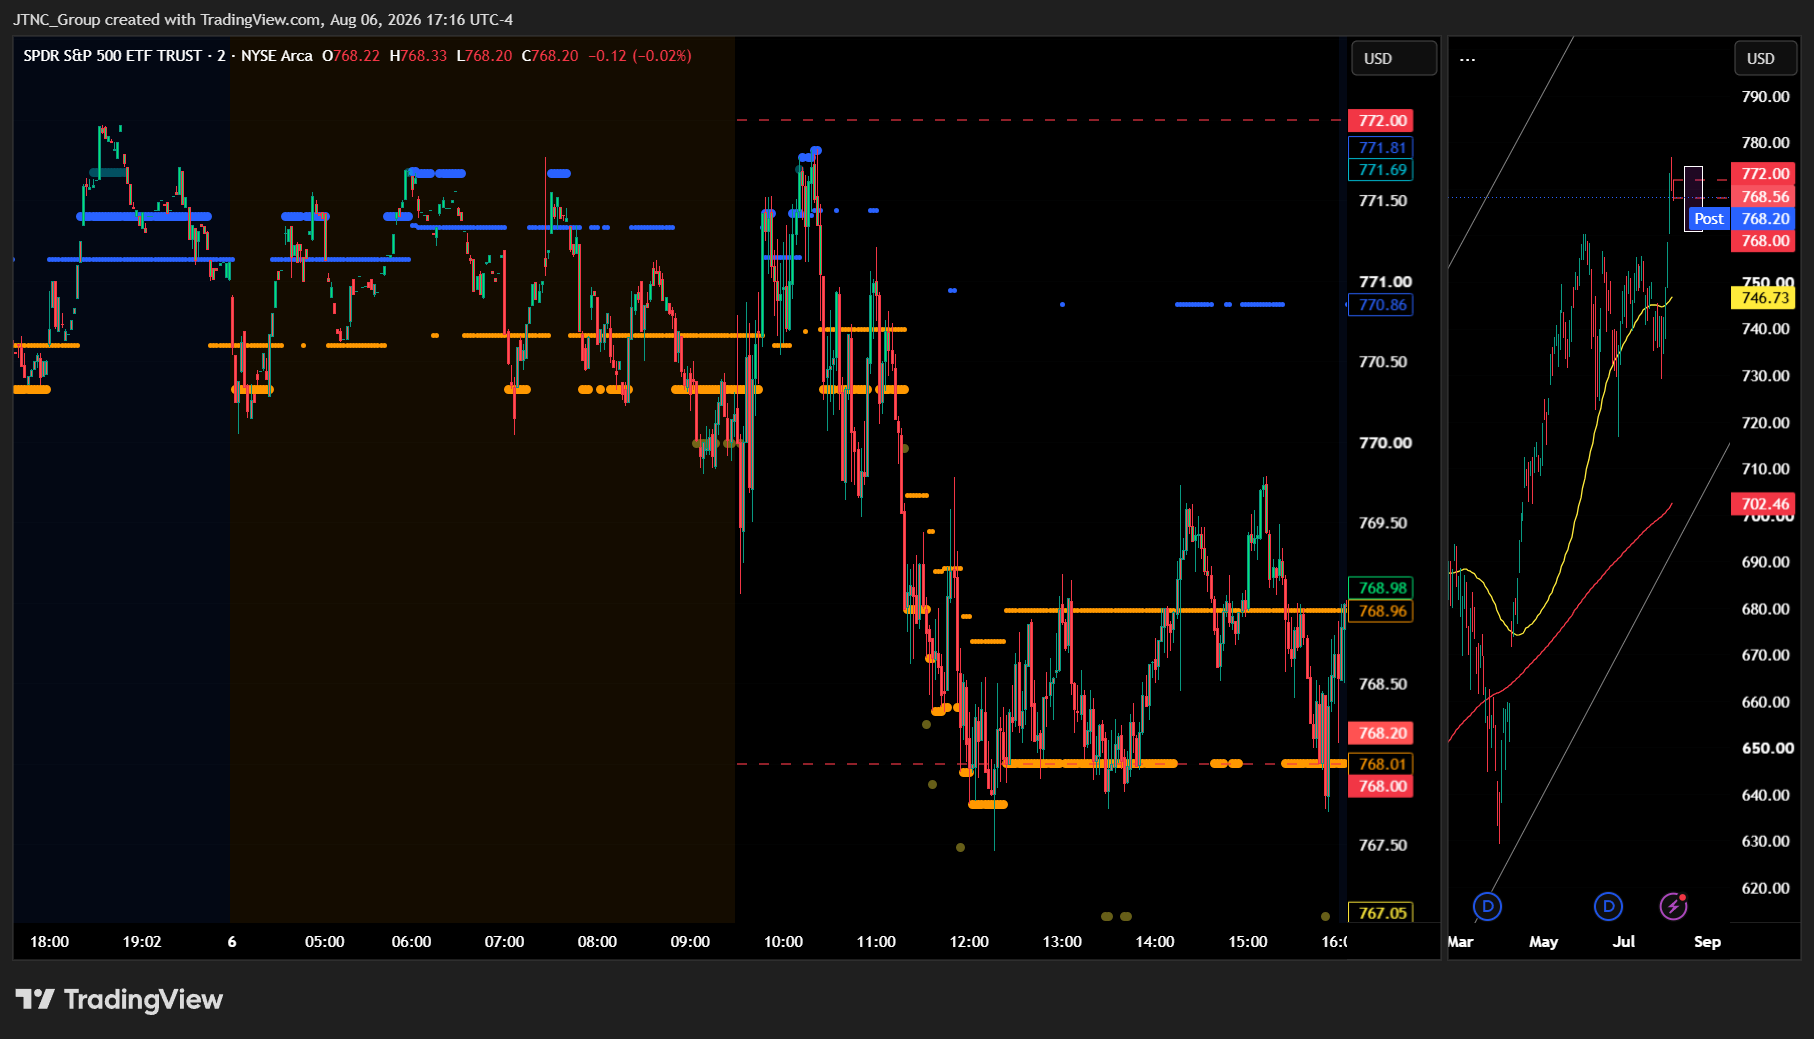
Current Market State Overview:
The MSI ended in a Bearish Trending Market State with SPY closing at $768.60. Since SPY closed inside the MSI range, support remains support and resistance remains resistance heading into Friday. Extended targets were not printing at the close. Extended targets did print below during both the AM and PM sessions but were short-lived in both cases, never sustaining enough momentum to drive a meaningful directional move. No extended targets were visible in premarket. The MSI rescaled higher overnight into a very narrow Bullish Trending state which held through premarket, then began flip-flopping between all three states as the open approached. By the open the MSI had settled into a very narrow Bearish Trending state, and from there it rescaled several times lower through the session as SPY ground its way down through the afternoon. The MSI range was notably narrow all day, with the $0.95 spread telling the real story — this was a consolidation session with some profit taking rather than any kind of sustained directional conviction. SPY opened at $770.21, popped to a session high of $771.82 in the early going with no extended targets to support the move, then steadily bled lower through midday before finding a base and grinding sideways through the PM session in a tight range. The very narrow Bearish Trending close without extended targets below suggests the market will likely continue its grind overnight, testing both the highs and lows of the session as it awaits the jobs report Friday morning. The MSI is forecasting likely sideways to possibly up, as the narrow bearish spread signals consolidation rather than strong trending, though bears are likely to maintain pressure. Any failure of MSI support is likely to see SPY retest the day's lows. MSI support is $768.01 with resistance at $768.96.
Key Levels and Market Movements:
Wednesday we stated, "Bulls want to see overnight price reclaim $770.33 and the MSI rescale into a Bullish Trending state with extended targets above," and added, "Bears want to see $770.33 continue to act as resistance and the MSI rescale lower with extended targets below. If that occurs, Wednesday's selloff from the highs gains legitimacy and price could test $768 and lower levels," while also noting, "Given the very narrow spread, the first MSI rescale of Thursday will be the key tell — follow it." That forecast aged well. The bears held $770.33 as resistance for most of the session and SPY did indeed press toward $768 and lower, touching a session low of $767.46 before finding footing. The MSI rescaling lower several times through the day confirmed bears had the upper hand. The session opened with the MSI in a very narrow Bearish Trending state after a chaotic premarket that saw all three states appear in quick succession. SPY attempted a bounce off $770 in the early AM session and reached its high of $771.82, but without extended targets printing above the move lacked conviction and reversed cleanly. That reversal offered the first clean setup of the day as price pulled back from MSI resistance toward support with the MSI confirming the shift. As the MSI rescaled lower through late morning, each new resistance level offered fresh shorting opportunities as SPY bled lower, providing additional setups for traders watching the levels. Price found a base around midday and the PM session was a grind through a tight range, with SPY stuck near $768 as bears and bulls battled for control. Extended targets did print below briefly during both sessions but were short-lived, offering limited follow-through. SPY fell 0.15% on the day on volume of 33.04 million shares, below average. The VIX dropped 2.91% to 15.35. At minimum it was a four-for-four session for traders following the framework. It was an easy day to read albeit not an easy day to trade given the tight choppy range. But substantial setups were present, all identified through proper context, patience, and flexibility while leveraging the MSI, premarket levels, and market structure rather than forcing trades. The MSI continues to prove its reliability as the cornerstone of our trading process.
Trading Strategy Based on MSI:
Friday has heavy economic data with Average Hourly Earnings, Non-Farm Employment Change, and the Unemployment Rate, which can introduce significant volatility, so traders should be ready to trade what they see rather than predict. The jobs report will land in premarket and the MSI will update accordingly, so we highly recommend waiting for the report to drop and then following whatever state the MSI transitions into before committing to any direction. Chasing the initial spike in either direction without MSI confirmation is a low-probability approach on NFP mornings. Thursday's session closed in a Bearish Trending state with a very narrow $0.95 spread, meaning price is coiling and the jobs report could be the catalyst that breaks it decisively in one direction or the other. Friday may continue the downward pressure but is equally likely to see a relief rally depending on how the data lands. Use softer expectations here and trade what the MSI shows you rather than coming in with a predetermined bias.
Bulls want to see overnight price hold $768.01 and the MSI rescale higher into a Bullish Trending state heading into the report. If that happens and extended targets print above after the data, the consolidation of the last two sessions sets up a resumption of the broader rally toward $772 and beyond. Bears want to see $768.01 fail and the MSI rescale lower with extended targets printing below after the report. If that occurs, SPY could retest the session low of $767.46 and press toward lower levels. The first MSI state following the jobs report will be the key tell for Friday — follow it and do not force a trade before it updates. With MSI resistance at $768.96 and support at $768.01, the levels are tight and the range is narrow, meaning a strong report or a weak one will likely blow price well outside this band quickly. Patience before the print and conviction after the MSI confirms is the optimal approach.
The long-term bull trend remains intact above $640 and failed breakouts and failed breakdowns continue to offer the highest-probability setups. Remain flexible, avoid trading during Ranging Market States unless a clear failed breakout or breakdown presents itself, and ensure all trades are fully aligned with MSI signals. Providing real-time insights into market control, momentum shifts, and actionable levels, the MSI when integrated with our Pre-Market and Post-Market Reports continues to sharpen execution precision and elevate trade quality. If you haven't yet integrated MSI and our model levels into your process, now is the time. Contact your representative to get started as these tools are designed to support consistency and enhance performance.
Dealer Positioning Analysis
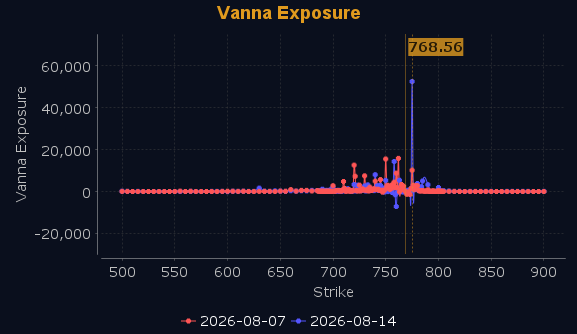
Dealers are selling SPY $774 to $810 and higher strike Calls while buying $769 to $773 Calls, indicating the Dealers' desire to participate in any rally on Friday. The ceiling for Friday appears to be $775. To the downside, Dealers are buying $768 to $710 and lower strike Puts in a 3:1 ratio to the Calls they're selling, displaying moderate concern that prices could move lower. Notably, Dealers are no longer selling ATM Puts, which is a meaningful shift — Dealers only sell ATM Puts when they are fairly certain the market will move higher, so their absence signals reduced conviction in an upside move heading into Friday's jobs report. Dealers have also slightly increased their hedges, though they are not outright bearish. For Friday, below $762 is bearish and above $774 is bullish, with nothing but chop in between. There is heavy resistance at $775 but little above that level, opening the door to $779 if bulls can break through. Below $762 there is support at $760 but little below to stop a decline if that level fails. Dealer positioning is unchanged at neutral/slightly bullish.
Looking Ahead to Next Friday:
Dealers are selling SPY $769 to $820 and higher strike Calls for the week ahead. The ceiling for next week appears to be $775. To the downside, Dealers are buying $768 to $700 and lower strike Puts in a 4:1 ratio to the Calls they're selling, displaying heightened concern that prices could move lower. Dealers are heavily hedged but have not increased their protection meaningfully heading into next week. With earnings season winding down, the next directional move will likely be driven by an economic data point or an external catalyst such as a resolution to the war in the Middle East. We recommend traders remain bullish above $766 but below $765 remain bearish, with chop in between. There is major support at $760 with major resistance at $775 which will slow any ascent above these levels. For the week Dealer positioning is unchanged at bearish. We advise reviewing Dealer positioning daily for directional clues. These positions evolve quickly and tracking them is essential for staying ahead of shifting market sentiment.
Recommendation for Traders
With SPY closing at $768.60 and the VIX easing to 15.35, conditions remain manageable but cautious. Favor longs on dips toward $767–$768 with stops below $767.46, and look to trim near $771–$772 if price stalls.
Keep sizing light given below-average volume and mixed breadth. Review the premarket analysis posted before 9 AM ET for any changes in the model's outlook and Dealer Positioning.
Good luck and good trading!
