Market Insights: Wednesday, August 6th, 2025
Market Overview
Stocks pushed higher Wednesday as Big Tech surged and traders braced for the next wave of tariffs, capping a session dominated by corporate earnings and headline risk. The S&P 500 climbed over 0.7%, the Nasdaq soared 1.2%, and the Dow added 0.2%, reversing Tuesday’s pullback. Apple led the charge, rallying nearly 6% after news broke that CEO Tim Cook would join President Trump at the White House to announce a new $100 billion investment in domestic manufacturing. The move is seen as a strategic maneuver to reduce the impact of looming tariffs on iPhones manufactured in India. According to White House officials, Apple is set to avoid most of the 50% duties set to hit Indian imports later this month, following the administration’s additional 25% tariff in response to India’s Russian oil purchases.
Elsewhere, the earnings parade continued. Disney topped expectations thanks to strong results in its parks and streaming businesses but saw shares fall on weakness in its linear TV unit. The company also unveiled plans to acquire NFL media assets, deepening its push into sports. On the downside, AMD dropped following a mixed quarter, while Super Micro and Snap both fell sharply after missing estimates. McDonald's gained ground as it reversed its recent U.S. sales slump, and Uber popped after announcing a revenue beat and an eye-catching $20 billion stock buyback. After the close, traders turned their attention to upcoming reports from Airbnb, DoorDash, and Lyft. Meanwhile, international trade partners scrambled to negotiate last-minute agreements before Thursday’s tariff deadline, with the Swiss president flying to Washington in hopes of avoiding a 39% duty on Swiss goods. While geopolitical noise remains a threat, Wednesday’s session firmly returned the spotlight to tech, with broad strength among major names powering the rebound.
SPY Performance
SPY rose 0.75% to close at $632.66 after opening at $629.03 and reaching a session high of $633.43. The ETF held support near $628.13 and gradually climbed throughout the morning before stalling just below resistance. Volume came in at 60.30 million shares, right in line with recent averages. The move back above $632 solidifies a cautiously bullish setup, and with SPY closing near the day’s highs, bulls regained short-term control heading into Thursday’s session.
Major Indices Performance
The Nasdaq led the charge with a 1.21% rally, powered by a rebound in tech mega caps. The S&P 500 followed with a gain of 0.75%, while the Dow posted a modest 0.19% advance. Small caps lagged as the Russell 2000 slipped 0.24%, snapping its recent streak of outperformance. Sector action was tilted toward growth, with consumer discretionary and technology sectors outperforming, while defensive names like healthcare and utilities underperformed. The market’s bounce was fueled by strong corporate earnings and relief that Apple may sidestep key tariff penalties, which temporarily eased trade concerns.
Notable Stock Movements
Apple stole the spotlight with a surge of nearly 6% following its domestic investment announcement and tariff exemption news. Amazon, Tesla, and Broadcom each rallied more than 3%, extending their leadership role in the market’s climb. Nvidia, Meta, Google, and Alphabet also finished higher, rounding out a broad green day for the Magnificent Seven. The lone exception was Microsoft, which dipped 0.53% amid sector rotation. This strong performance across the group reinforced their grip on market direction, with continued earnings growth providing critical support.
Commodity and Cryptocurrency Updates
Crude oil continued its slide, falling 1.58% to $64.13 as concerns over global demand and geopolitical oil disruptions weighed on sentiment. Our model still views the rally as seasonal and unsustainable, maintaining its long-standing call for a move toward $60. Gold inched up 0.09% to $3,430, with safe-haven demand staying subdued as equities bounced. Bitcoin gained 1.25%, closing above $115,228 as crypto found footing alongside broader risk-on moves in equities.
Treasury Yield Information
The 10-year Treasury yield ticked up 0.81% to 4.230%, still hovering below the critical 4.5% danger level for equities. Although yields remain elevated, they are not yet at levels likely to derail the rally. A move above 4.8% would raise red flags, with 5.2% marking the tipping point for a potential 20% equity market correction. For now, bond markets appear stable, and equity bulls are taking comfort in yields remaining below the stress threshold.
Previous Day’s Forecast Analysis
Tuesday’s outlook projected SPY to trade between $625 and $634 with a cautiously bullish tilt. The model highlighted $625 as key support and flagged $632–$634 as the resistance zone that needed to be reclaimed for bullish continuation. Long trades were favored above $625, while short entries were suggested on failed rallies near $633 or a breakdown below $625. The strategy warned of tight action and urged traders to be selective near resistance levels while leaning on technical structure in the absence of macro catalysts.
Market Performance vs. Forecast
Wednesday’s price action played out as expected. SPY opened at $629.03, tagged a low of $628.13 early on, and rallied steadily into the $633 zone before closing at $632.66, right within the upper range of the model’s projection. Resistance near $633 proved sticky, but not enough to trigger a reversal. Long entries above $625 and $629 both worked well as SPY moved through modeled targets. The model’s directional bias, key levels, and projected range again provided an effective framework for navigating the session.
Premarket Analysis Summary
In Wednesday’s premarket analysis posted at 7:28 AM, SPY was trading at $629.60 with a bearish tilt below the bias level at $631. The report emphasized that rallies beneath $631 were likely to be sold, favoring short entries on rejections near that level. Downside targets were outlined at $627, $626, and $625, while upside levels included $633 and $635 if SPY reclaimed $631. The outlook expected sideways action with the potential for a late-day push if bulls could clear the bias level and sustain momentum.
Validation of the Analysis
The premarket blueprint proved spot-on. SPY broke above the $631 bias level by midmorning and made a steady move toward $633 before stalling, validating the upper resistance target. While early weakness tested support near $628, it held firm, giving bulls room to reclaim control. Traders who used the 631 level as a pivot were rewarded on the breakout, and the clean respect for $633 highlighted the model’s precision. The session unfolded within the defined structure and offered multiple setup opportunities on both sides.
Looking Ahead
Thursday brings Unemployment Claims data, the only major economic release of the week. While not typically a market-moving report on its own, surprises in the data could influence short-term sentiment and volatility, particularly with rate expectations still fluid. Otherwise, markets will be driven by corporate headlines and technical levels as earnings season continues to unfold.
Market Sentiment and Key Levels
SPY closed at $632.66, pushing above Tuesday’s high and reclaiming short-term control for the bulls. Sentiment remains cautiously bullish with price now back inside a key trading zone between $625 and $635. Resistance levels to watch include $635, $638, and $640, while support sits at $630, $627, $625, and $620. As long as SPY holds above $625, the bull case remains intact. A break below $620, however, could spark momentum for bears aiming for $615 or lower.
Expected Price Action
Our AI model projects SPY to trade between $628 and $637.75 on Thursday, an actionable range that suggests steady consolidation with periodic trending behavior. This is actionable intelligence generated by our AI model. Bulls remain in control with SPY above $632, and a push through $635 could open the door to $638 or even $640. However, if SPY loses $630 early in the session, expect a test of $627 or $625. The broader trend remains up, but without a new catalyst, markets may churn within the $625–$635 band.
Trading Strategy
Long trades remain favorable above $630, with initial upside targets at $635 and $638. A confirmed breakout above $638 could trigger a test of $640, but overhead resistance should be expected in this region. Short trades are best considered on failed rallies near $635 or above, or if SPY breaks below $630, targeting $627 and $625. Volatility ticked lower as the VIX dropped 6.05% to 16.77, suggesting calmer conditions, but traders should still manage risk tightly and avoid overexposure in a rangebound market.
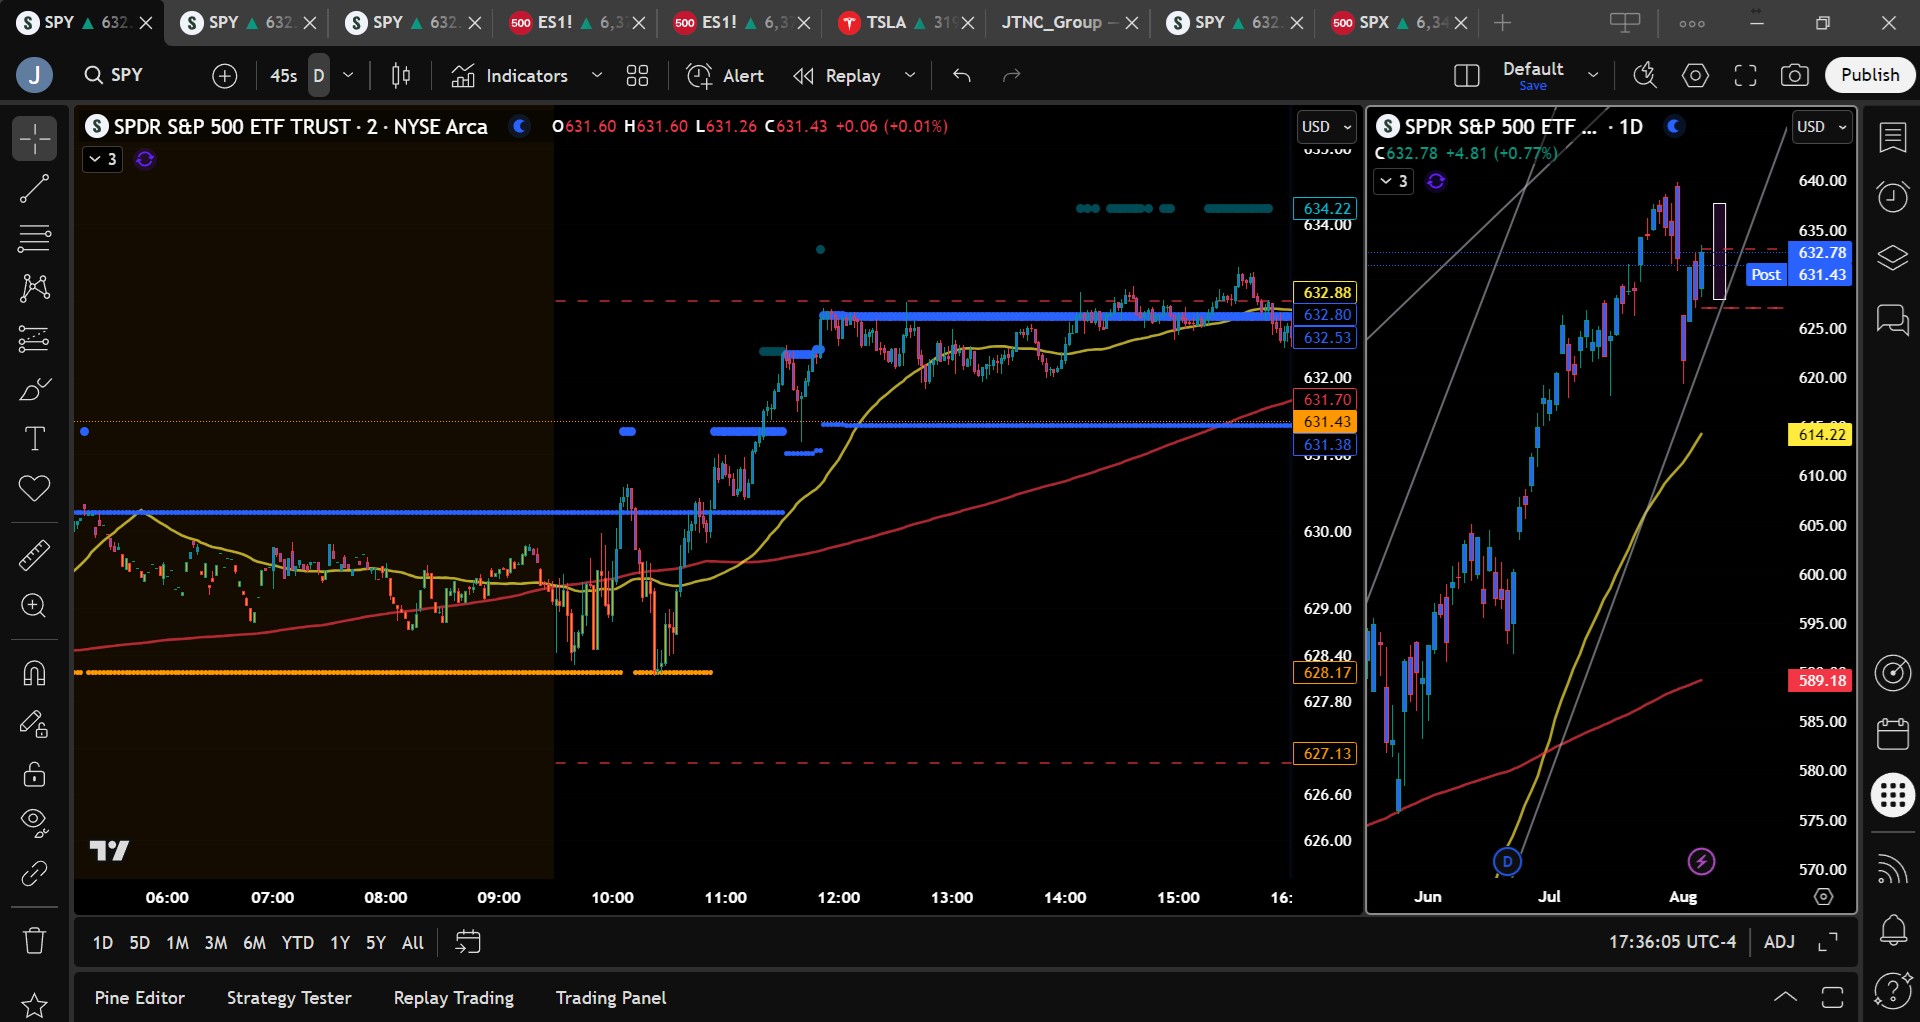
Model’s Projected Range
The model projects SPY’s maximum range for Thursday between $628 and $637.75 with the Call side dominating within a steady band suggesting consolidating price action with trending action intermittently. Overnight, markets initially fell and retested the day’s lows before gapping higher buoyed by strong earnings that renewed confidence in the economy despite weak macroeconomic data. The gap nearly filled before the open and markets traded sideways until a breakout at 10:45 AM pushed prices out of the wide overnight range toward the day’s highs. The rally stalled at $633, encountering heavy resistance, and the market traded in a narrow range for the remainder of the afternoon, ultimately closing at $632.78, back in the zone where bulls appear to be firmly in control. Since reclaiming the $585 level, SPY has maintained a strong uptrend that continues to defy expectations, with dips consistently being bought. To put this into perspective, seven companies have accounted for 86% of market gains since the April lows. These firms are averaging 26% earnings growth, compared to just 4% for the rest of the market. With the broader market trading at a premium, 23 times earnings versus the historical average of 19, portfolios not heavily exposed to these key names are likely underperforming. The big question remains: how long can a handful of stocks hold up the entire market? While uncertain, the trend will continue higher unless weakness emerges in these leading names. Volume today was average, adding to the mixed signals the market has shown in recent sessions. Nevertheless, the trend remains strong, and with SPY holding above $632, bulls have reasserted control. Barring a significant macro event, the path of least resistance points toward all-time highs. As noted yesterday, our model continues to forecast upside for the remainder of the week, though we remain cautious heading into next week. Tomorrow’s key resistance levels are $635, $638, and $640. Support sits at $630, $627, $625, and $620. Below $620, support thins out quickly, raising the risk of a swift move down to $615. On the upside, the $635–$640 zone is expected to offer strong resistance. Without a clear catalyst, overnight the bulls will likely focus on defending the $632 level. A breakdown there could open the door to $625 or lower. On the other hand, the ultra-bullish scenario sees a push toward $635, where the market may pause and consolidate. The $625–$635 range could take time to resolve, but we continue to favor the bulls while this range holds. For bears to gain traction, a decisive break below $625 is needed. As long as SPY remains above this level, dip-buying is likely to persist, and a move to new all-time highs remains the base case. A breakdown below $600 would suggest a test of the critical $585 level, long viewed as the bulls’ line in the sand. While seasonal volatility from August through October typically favors the bears, they remain on the sidelines for now as bulls dominate the broader narrative. Our model has redrawn the bull channel from the April lows into a weaker, yet still intact, bullish trend. SPY continues to trade above the lower bounds of this channel. Meanwhile, the VIX fell 6.05% to 16.77. We continue to recommend hedging long equity exposure with VIX Calls, anticipating increased volatility heading into the fall. A VIX below 23 remains supportive of equities, but the current contango structure suggests heightened volatility risk. A breakout above 23 could trigger the 5–10% pullback we’ve been anticipating.
Market State Indicator (MSI) Forecast
Current Market State Overview:
The MSI closed in a Bullish Trending Market State, with SPY closing just below resistance. There were no extended targets at the close but extended targets did print for much of the day. Overnight the MSI rescaled to a wide ranging state however after the open, the MSI began a series of rescalings higher to a bullish state which lasted into the close. The MSI is narrow but with extended targets above for much of the day, its likely prices will continue to drift higher overnight into Thursday. MSI support is currently $631.38 with resistance at $632.77.
Key Levels and Market Movements:
On Tuesday, we wrote: “The current administration continues to present macro risks, so we recommend staying alert for any developments that could disrupt market forces,” and added: “Our model continues to slightly favor the bulls, though a close above $632 is still needed to fully sideline the bears.” We also noted: “We expect some overnight volatility but believe dip buyers will step in again to support the market, as long as $625 holds. We advise looking for long setups from $625 and higher, while shorts may be considered on a break below $625 or a push above $633.” With that context for the day, the MSI and SPY opened in a ranging state, one we typically avoid trading. At 10:45 a.m., the MSI rescaled to a bullish state, and knowing the odds of price moving from support to resistance in this state exceed 70%, we entered long on the breakout at $630.50. Our first target was just $1 higher, given the lack of an MSI or premarket level to lean on. This target was reached quickly, and we then set T2 at the MSI resistance level of $632.35. Out with our second target by 11:35 a.m., we had little to do but trail. While a pullback to $631 had us considering re-entering long, once we’re in the money on the day, we shift to profit-protection mode and become very selective about putting more capital at risk. With a stop at breakeven and 90% of our position already banked, we held for the premarket level of $633, believing it was achievable. Sure enough, price reached that level by 2 p.m., and following a failed breakout late in the day, we exited on a trailer for a one-and-done day, posting a solid gain, thanks once again to a clear plan, disciplined execution, and strong alignment between MSI’s directional cues, our broader market model, and key technical levels. The MSI remains a cornerstone of our consistent trading process.
Trading Strategy Based on MSI:
Thursday brings Unemployment Claims, which normally wouldn’t warrant much concern, but given the recent Jobs report, we’ll be watching closely for any signs of weakness. The current administration continues to present macro risks, particularly with their willingness to disrupt the norm. Our model now firmly favors the bulls, with no consideration for the bears after the close above $632. While a pullback toward $625 remains possible, it’s highly probable that such a move would be bought, allowing the market to resume its path toward new all-time highs. Bears would need a clean break of $625 to even re-enter the picture; failure there could lead to a drop to $620 and potentially $615, which may act as a temporary floor on the way to $600. A confirmed break below $600 would be required to meaningfully shift the dynamic and raise the likelihood of a 9–10% pullback. With MSI currently in a narrow, Bullish Trending Market State, the market still appears inclined to move higher overnight. As long as $632 holds, we expect continued upward momentum. A failure at $632, however, could see a revisit of the $626/$625 area, where we again expect buyers to step in. We advise looking for long setups above $625, while shorts may be considered on a break below $625 or a push above $635, as we anticipate more two-way action during the session. As always, failed moves remain among the highest-probability setups. Stay nimble, avoid trades during Ranging Market States, and ensure full alignment with MSI. Providing real-time insights into market control, momentum shifts, and actionable levels, the MSI when integrated with our Pre-Market and Post-Market Reports continues to sharpen execution precision and elevate trade quality. If you haven’t yet integrated MSI and our model levels into your process, now is the time. Contact your representative to get started as these tools are designed to support consistency and enhance performance.
Dealer Positioning Analysis

Summary of Current Dealer Positioning:
Dealers are selling SPY $633 to $652 and higher strike Calls while also selling $632 Puts indicating the Dealers belief that prices will continue to move higher on Thursday. Dealers do not sell at the money Puts without a strong belief that prices will move higher. The ceiling for Thursday appears to be $640. To the downside, Dealers are buying $632 to $575 and lower strike Puts in a 3:1 ratio to the Calls they’re selling/buying displaying little concern that prices could move much lower on Thursday. Dealer positioning is unchanged from slightly bearish/neutral to slightly bearish/neutral.
Looking Ahead to Friday:
Dealers are selling SPY $636 to $650 and higher strike Calls while also buying $633 to $635 Calls indicating the Dealers desire to participate in any rally into the end of the week. The ceiling for the week appears to be $640. To the downside, Dealers are buying $632 to $575 and lower strike Puts in a 3:1 ratio to the Calls they’re selling, reflecting a slightly bearish/neutral outlook for the week. For the week Dealer positioning is unchanged from slightly bearish/neutral to slightly bearish/neutral. We advise reviewing Dealer positioning daily for directional clues. These positions evolve quickly and tracking them is essential for staying ahead of shifting market sentiment.
Recommendation for Traders
SPY is holding firm within the $625 to $635 range, offering clearly defined levels to trade against. Longs are favored above $625 with targets at $635 and $638, while short setups should be considered on failed rallies near resistance at $635 or above. Support levels at $627 and $625 are important to watch; breaks below these could trigger a slide to $620. With VIX pulling back to 16.77, volatility is receding for now, but traders should remain cautious and avoid oversized positions. Review the premarket analysis posted before 9 AM ET for updated model outlooks and changes in Dealer Positioning.
Good luck and good trading!
