Market Insights: Wednesday, August 5th, 2025
Market Overview
Wall Street hit pause Tuesday as investors weighed corporate earnings, a muted ISM services print, and another wave of tariff drama from the White House. The S&P 500 dipped 0.5%, the Dow eased 0.1%, and the Nasdaq slid 0.7% as market momentum faded after Monday’s powerful rally. The slowdown came as traders digested President Trump’s latest tariff threats, including a proposed 250% tax on pharmaceutical imports and further escalation toward India over its Russian oil purchases. In a Tuesday morning CNBC interview, Trump ruled out Treasury Secretary Scott Bessent as a candidate for Fed chair and hinted that Jerome Powell’s successor could be named soon, adding more uncertainty to an already jumpy market.
On the economic front, the ISM services PMI for July landed at a disappointing 50.1, down from June’s 50.8 and well below forecasts. The flat reading marked another sign of potential softening in the economy and raised fresh concerns about consumer demand and the durability of the recovery. Despite the mixed backdrop, earnings season continued to offer pockets of strength. Palantir delivered a standout report, jumping more than 7% after posting over $1 billion in quarterly revenue for the first time. Since joining the S&P 500 in September 2024, the stock is up over 610% and now ranks among the index’s top 25 holdings, surpassing names like Bank of America, Chevron, and Coca-Cola. With earnings from Disney and McDonald's on deck Wednesday, market participants are preparing for more swings as macro and micro narratives collide.
SPY Performance
SPY pulled back 0.51% to close at $627.97 on Tuesday after tagging a high of $632.61 shortly after the open. The ETF opened strong at $631.79 but faced early resistance and drifted lower throughout the session, bottoming at $627.04 before finishing near the day’s lows. Volume came in at 64.70 million shares, below Monday’s figure, suggesting a cooling of enthusiasm following Monday’s surge. Despite the slip, SPY remains above the key $625 pivot, holding onto a cautious bullish bias for now.
Major Indices Performance
The Russell 2000 outpaced broader markets with a gain of 0.62%, extending its recent run as small caps continued to outperform. The Dow dipped 0.14%, while the S&P 500 fell 0.5%. The Nasdaq led the decline, down 0.65%, as tech stocks gave back a portion of Monday’s gains. The session was shaped by weaker-than-expected ISM data and escalating trade tensions, with growth sectors taking the brunt of the selling. Defensives like healthcare showed modest resilience amid the noise.
Notable Stock Movements
Tuesday marked a rare red day across the Magnificent Seven, with Amazon the lone standout, rising 1.02%. Palantir stole the spotlight with a surge of over 7% following blockbuster earnings and the milestone of crossing $1 billion in quarterly revenue. Nvidia, Meta, Apple, Microsoft, Tesla, and Google all saw mild declines, showing traders took profits after Monday’s tech-driven rally. The group’s softness highlights the increasing two-way action in markets and a possible pause in the recent growth leadership.
Commodity and Cryptocurrency Updates
Crude oil fell another 1.66% to $65.20 as global demand worries and uncertainty around Russian oil supply pressured prices. Our model continues to view the recent rally as seasonal and unsustainable, projecting crude to move toward $60 in the months ahead. Gold gained 0.23% to $3,434, benefiting from safe-haven flows as macro risks remain elevated. Bitcoin slid 0.98%, settling above $113,660, as risk-off sentiment spilled into digital assets despite remaining in a consolidation range.
Treasury Yield Information
The 10-year Treasury yield dipped marginally by 0.05% to 4.208%, continuing to hover near recent highs but staying below the critical 4.5% threshold. The bond market remains on edge as investors try to reconcile softening data with ongoing Fed uncertainty. While yields have cooled slightly, they remain high enough to pressure equities if macro conditions worsen. With talk of new Fed leadership and inflation risks still in play, traders will continue watching yield curves closely for directional clues.
Previous Day’s Forecast Analysis
Tuesday’s forecast projected a SPY trading range of $626 to $633 with a cautiously bullish tilt. The model highlighted $626 as support and $633 as the upside pivot to clear for further gains. Long setups were preferred above $626, while short trades were only favored on failed rallies near resistance or a clean break of $624. The model also warned of heavy resistance between $633 and $635 and emphasized the importance of holding $625 to preserve the bullish case.
Market Performance vs. Forecast
SPY opened at $631.79 and briefly touched $632.61 before reversing and sliding toward the lower end of the projected range. It held support at $627.04 and closed at $627.97, right inside the modeled band. The price action aligned with the expected script, with the rejection near $633 leading to a steady decline through the session. Traders who followed the guidance to avoid longs into $633 and consider shorts on failure saw that play out cleanly. The pre-established support and resistance levels worked well, and the market’s respect for these areas further validates the model’s effectiveness.
Premarket Analysis Summary
In Tuesday’s premarket analysis posted at 6:50 AM, SPY was trading at $632.61 and the bias level was set at $633.60. Upside targets were set at $633.60, $635, and $637, while support levels were noted at $629 and $627. The outlook leaned bearish below $633.60, anticipating an ambiguous slide if resistance held. Long setups were favored only if SPY reclaimed and held above the bias level, while short entries were recommended on early rejection. The analysis also noted the possibility of rallies from the $629 area.
Validation of the Analysis
Tuesday’s session closely followed the premarket blueprint. SPY rejected just below $633.60, confirming the anticipated resistance zone, and began its decline from the opening hour. It sliced through $629 intraday and found temporary footing near $627 before closing at $627.97, well within the forecasted range. Traders who took short entries on the rejection or looked for bounces near $629 had defined opportunities. The model’s range, bias level, and reversal scenario all played out cleanly, showcasing another day of high-accuracy projections and reliable market guidance.
Looking Ahead
Wednesday’s calendar is clear of economic data, which leaves the market direction largely in the hands of corporate earnings and price action. Disney and McDonald’s reports will be closely watched for consumer sentiment clues and margin trends. With tariff headlines and Fed succession chatter still looming, traders should remain alert for sudden shifts in narrative. Without a macro catalyst, expect a technical session defined by how SPY behaves around key support and resistance levels.
Market Sentiment and Key Levels
SPY closed near $628, comfortably above the $625 support floor but below the $632 resistance pivot. Market sentiment remains cautiously bullish, though the rangebound action and headline risk are beginning to chip away at trader confidence. Resistance now stands at $631, $634, $637, and $640. On the downside, key support levels include $625, $622, $620, and $615. Bulls must defend $625 to maintain upward momentum, while a break below $620 could shift the tone sharply in favor of bears aiming for $615 or lower.
Expected Price Action
Our AI model projects SPY to trade between $625 and $634 on Wednesday, a narrow range that suggests consolidative behavior with intermittent bursts of movement. This is actionable intelligence generated by our AI model. The setup favors two-way action, with bulls controlling the tape as long as $625 holds. If SPY pushes through $632, a move toward $634 or even $637 could unfold. However, if resistance near $632 holds again and price breaks below $625, expect a test of $622 or lower. With macro data absent, traders should lean on technicals and remain nimble within the range.
Trading Strategy
Long trades remain favorable above $625, with upside targets at $631 and $634. A clean break through $634 could target $637, but heavy resistance remains just overhead. Short trades are appropriate only on failed rallies near $633 or above, or if SPY breaks below $625 with confirmation, targeting $622 and potentially $620. With VIX ticking up 1.88% to 17.85, risk remains elevated, and volatility is creeping back into the market. Keep stops tight and position sizes moderate, especially in a headline-sensitive environment.
Model’s Projected Range
The model projects SPY’s maximum range for Wednesday between $623.50 and $634.25 with the Put side dominating within a narrowing band suggesting consolidating price action with intermittent periods of trending action. Overnight, markets moved sideways as they digested yesterday’s reversal following two days of declines. While premarket PMI data came in weaker than expected, it had little to no impact on the market at the open. However, the White House’s continued tough stance on tariffs, including a proposed 250% tariff on drug companies, prompted a partial reversal of yesterday’s gains, with dip buyers beginning to question whether the gravy train may be running out of steam. SPY trended lower for most of the session, closing near the day’s lows at $627.97, but still holding above the key $625 level. Since reclaiming $585, SPY has been in a strong uptrend that at times appeared unstoppable. However, the past four sessions have been marked by wide trading ranges and sharp swings, potentially a sign of growing instability. Like yesterday, volume was underwhelming, adding to the market’s mixed signals. Despite today's retracement, the bulls still hold the edge with SPY above $625. Traders should remain open to the possibility that yesterday’s bounce was merely a dead cat bounce, but our model continues to forecast upside for the remainder of the week, though next week may tell a different story. Looking ahead to Wednesday, key resistance levels are $631, $634, $637, and $640. Support sits at $625, $622, $620, and $615. Below $620, support thins out quickly, increasing the likelihood of a swift drop to $615. On the upside, strong resistance between $634 and $640 is expected to limit gains. Without a clear catalyst tomorrow, bulls will likely focus on defending the $625 level. A failure there could open the door to $622 or lower. There is no ultra-bullish scenario for Wednesday, as SPY appears stuck in a range between $625 and $635, one that may take time to resolve. Notably, today’s pullback didn’t even revisit yesterday’s low of $626, suggesting a move back toward $635 remains likely. We continue to favor the bulls while this range holds. A decisive break below $600 would likely lead to a test of the critical $585 level, long seen as a line in the sand for bulls. While seasonal volatility from August through October tends to favor the bears, until they show more strength, bulls remain in control of the broader narrative. Today’s action may simply be another temporary setback. Our model has not yet redrawn the bull channel from the April lows, though SPY now trades well below the lower boundary. One more day of data should clarify whether this is a weakening bull trend or the beginning of a new bear channel. Meanwhile, the VIX rose 1.88% to 17.85. We've been recommending VIX Call options for some time and continue to do so, anticipating increased volatility into the fall. A VIX below 23 remains supportive for equities, but the current contango structure signals potential for further volatility. A breakout above 23 could easily trigger the 5–10% pullback we've been anticipating.
Market State Indicator (MSI) Forecast

Current Market State Overview:
The MSI closed in a Bearish Trending Market State, with SPY closing just above support. There were no extended targets at the close and only intermittent targets below in the morning session. The MSI rescaled lower several times after the open from a wide, ranging state to its current bearish state where it remained for the entire day. We pointed out yesterday that the fact the MSI did not rescale to a bullish state even after a 1.5% rally implied our model was unsure if yesterday’s rally was a bounce or an actual reversal. Given the failure to rescale higher, it was clear from the MSI that prices would retrace today. MSI support is currently $627.16 with resistance at $630.70.
Key Levels and Market Movements:
On Monday, we wrote: “The market continues to shrug off bad news, though the current administration still presents macro risks, so we recommend staying alert for any developments that could disrupt the rally’s momentum,” and added: “the bulls, who need a close above $632 to fully sideline the bears.” We also noted: “Tuesday should be a wait-and-see day favoring dip-buying near key support at $626 or $620, while shorts may be considered on a break below $620 or a push above $632.” With that context, SPY opened just below the key $632 level we had identified. Our plan was to look for a short entry at this level to test MSI support at $630. A less-than-convincing failed breakout attempt in the premarket, with price stalling just below $632, confirmed our setup. We entered short at $632 with an initial target (T1) at MSI support of $629.88. T1 was hit within the first hour, and with MSI rescaling lower and extended targets printing below, momentum was on our side. For T2, we chose the premarket level of $627. While this was a bit aggressive given that $629 was the next closer premarket level, we expected a retest of Monday’s lows at $626. Price came within pennies of our target, so we exited T2 at $627.30 and began trailing. Soon after, extended targets stopped printing and MSI rescaled slightly higher. With price sitting at premarket support around $627 and bullish bias still present, we exited the short and reversed long on a double bottom before noon, targeting a move back to the premarket level at $629. With T1 achieved, we then targeted T2 at MSI resistance around $630.70. Although SPY attempted to rally, it stalled at $630.27. We took what the market gave us and booked T2, moving our stop to breakeven to trail the rest. That proved wise as price pulled back, and while our remaining 10% position stayed protected, we held on a bit too long and exited just before the close for a small gain. All in all, a solid two-for-two day: a strong first winner and a smaller, counter-trend second trade. The key, once again, was a clear plan, disciplined execution, and strong alignment between MSI’s directional cues, our broader market model, and key technical levels. The MSI remains a cornerstone of our consistent trading process.
Trading Strategy Based on MSI:
Wednesday brought no major headlines, but as was evident today, the current administration continues to present macro risks, so we recommend staying alert for any developments that could disrupt market forces. While our model continues to slightly favor the bulls, a close above $632 is still needed to fully sideline the bears. A pullback toward $625 would likely be bought and could serve as a healthy pause following four days of volatility. Bears, meanwhile, need a clean break of $620 to press their case toward $615, which may act as a temporary floor en route to $600. A confirmed break below $600 would significantly shift the dynamic and increase the likelihood of a 9–10% pullback. With MSI currently in a wide, Bearish Trending Market State, the market appears inclined to move a bit lower overnight, potentially testing Tuesday’s lows. As such, we expect some overnight volatility but believe dip buyers will step in again to support the market, as long as $625 holds. We advise looking for long setups from $625 and higher, while shorts may be considered on a break below $625 or a push above $633, as we anticipate continued two-way action during the session. As always, failed moves remain among the highest-probability setups. Stay nimble, avoid trades during Ranging Market States, and ensure full alignment with MSI. Providing real-time insights into market control, momentum shifts, and actionable levels, the MSI when integrated with our Pre-Market and Post-Market Reports continues to sharpen execution precision and elevate trade quality. If you haven’t yet integrated MSI and our model levels into your process, now is the time. Contact your representative to get started as these tools are designed to support consistency and enhance performance.
Dealer Positioning Analysis
Summary of Current Dealer Positioning:
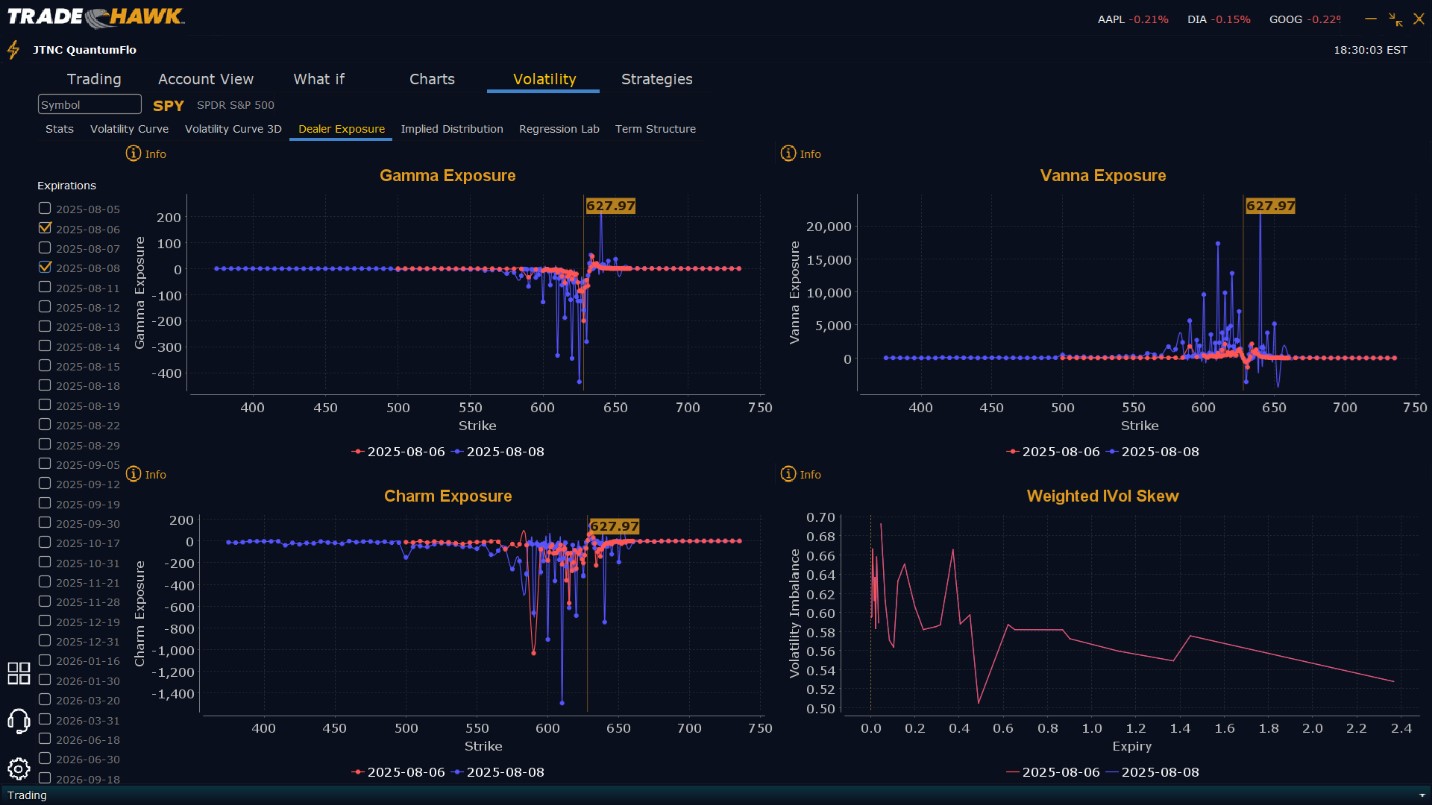
Dealers are selling SPY $633 to $645 and higher strike Calls while also buying $628 to $632 Calls indicating the Dealers desire to participate in any rally on Wednesday. Dealers are no longer selling Puts and the floor they established yesterday held. The ceiling for Wednesday appears to be $637. To the downside, Dealers are buying $627 to $575 and lower strike Puts in a 3:1 ratio to the Calls they’re selling/buying displaying little concern that prices could move much lower on Wednesday. Dealer positioning is unchanged from slightly bearish/neutral to slightly bearish/neutral.
Looking Ahead to Friday:
Dealers are selling SPY $633 to $650 and higher strike Calls while also buying $628 to $632 Calls indicating the Dealers desire to participate in any rally into the end of the week. The ceiling for the week appears to be $640. To the downside, Dealers are buying $627 to $575 and lower strike Puts in a 3:1 ratio to the Calls they’re selling, reflecting a slightly bearish/neutral outlook for the week. For the week Dealer positioning is unchanged from slightly bearish/neutral to slightly bearish/neutral. We advise reviewing Dealer positioning daily for directional clues. These positions evolve quickly and tracking them is essential for staying ahead of shifting market sentiment.
Recommendation for Traders
SPY is consolidating between $625 and $635, offering defined trade setups around key levels. Long trades are favored above $625 with targets at $631 and $635. A breakout above $635 could extend to $637. Short trades are best considered near resistance, particularly on failed rallies at $633 or higher, with downside targets at $625, $622, and $620. The VIX rose modestly to 17.85, suggesting creeping volatility. Traders should remain alert and use tighter stops around key levels. As always, review the premarket analysis posted before 9 AM ET for the latest updates in model outlook and Dealer Positioning.
Good luck and good trading!
