
Market Insights: Monday, August 31st, 2026
Market Overview
US stocks pulled back on Monday as the US struck Iranian rocket launchers in the Strait of Hormuz region, reigniting fears of a broader Middle East conflict and sending oil prices sharply higher. Brent crude futures climbed above $88 per barrel on worries the conflict could escalate further, keeping inflation concerns front and center. That pressure filtered into rate expectations, with traders now pricing in a 62% chance of a 25 basis point Fed hike in September — up from around 40% just a week ago. Despite Monday's losses, all three major indexes still closed out August with solid gains, with the S&P 500 up more than 2.5% for the month, the Nasdaq up more than 3%, and the Dow gaining 1.3%.
Amazon was among the session's biggest losers, tumbling more than 3% after the Wall Street Journal reported the FTC plans to sue the company for allegedly manipulating ad prices on its retail platform. A coalition of more than 20 state attorneys general is expected to join the suit, which could claim the practice generated tens of billions in profit over seven years. Meanwhile, Nvidia announced a $3.5 billion investment in Taiwanese chipmaker MediaTek, deepening its footprint across the AI ecosystem through what the two companies called a collaboration on AI infrastructure, local AI computing, and automotive platforms. Bank of England Governor Andrew Bailey also made headlines, warning G20 leaders that frontier AI models — including those from OpenAI and Anthropic — pose a serious cybersecurity threat to the global financial system, noting that Anthropic's most capable "Mythos" model has already been quietly shared with institutions like JPMorgan Chase and Intercontinental Exchange through a program called Project Glasswing to help identify system vulnerabilities.
SPY Performance
SPY opened at $767.33 and barely got off the ground, with the high of $767.99 coming almost immediately before sellers took control and pressed the tape lower. The low of $764.72 and close of $767.02 paint a picture of a market that had no real appetite for upside — price spent most of the session grinding in a compressed range with little in the way of meaningful bounces. The session range of $3.27 was notably tighter than the prior day, which reflects a lack of conviction rather than stability. When a market trades in a narrow band and still can't manage to close near the top of it, that's not a neutral signal — that's quiet pressure building.
SPY finished down 0.30% on the day, which extends the pullback from recent levels and adds another layer of caution to the short-term picture. Volume came in at 32.13 million shares, below average and slightly lighter than the prior session's pace — again, not a lot of firepower on either side, but the bears didn't need much to keep a lid on things. What stands out here is the VIX rising 3.26% to 14.90, a meaningful jump that contrasts sharply with the muted volatility of the prior session. When price drifts lower on quiet volume and the VIX picks up at the same time, it suggests the market is starting to price in a bit more risk — not panic, but enough of a shift to put bulls on notice heading into the next session.
Major Indices Performance
The Nasdaq held up best among the major indices today, slipping just 0.12% in a session where the broader market struggled to gain traction. Tech managed to avoid the worst of the damage, though the gains were far from convincing given the macro backdrop. With Treasury yields still parked at elevated levels, the growth side of the market continues to walk a tightrope, and today's marginal decline was more about surviving the session than any real show of strength.
The Russell 2000 finished down 0.47%, continuing its frustrating pattern of underperformance relative to large-cap peers. Small-caps remain caught in the crossfire of tight credit conditions and sticky rates, and today was another reminder that this corner of the market doesn't get much benefit of the doubt when the macro environment is uncertain. Traders aren't rushing into small-caps when borrowing costs stay punishing, and that dynamic isn't going away anytime soon.
The Dow was the clear laggard today, dropping 0.7% and dragging the blue-chip index to the bottom of the leaderboard. That's a notable reversal from the prior session when Dow components provided a relative safe haven. Today the defensives didn't offer the same cushion, and with the S&P 500 also finishing in the red, it was a broadly weak tape from top to bottom. The Dow's decline suggests that even the steadier, dividend-paying names are starting to feel the weight of an environment where yields remain stubbornly elevated and there's little macro catalyst to spark meaningful buying interest.
Notable Stock Movements
Amazon flipped the script today, going from yesterday's group leader to the biggest drag on the Magnificent Seven, sliding -2.50% to headline what was a mostly red session for the group. When the name that was carrying the torch just one day ago turns around and leads the losses, it sends a clear message that conviction in these large-caps is still fragile and momentum can shift fast. Amazon's reversal wasn't just a single-stock story — it set the tone for a group that spent most of the session on the defensive.
The broader Magnificent Seven picture leaned red on the day, which lines up with the mild but consistent selling pressure felt across all the major indices. The exceptions worth noting were Tesla and NVIDIA, both of which managed to finish green — a notable turnaround for NVIDIA after yesterday's steep pullback of nearly five percent. Seeing NVIDIA bounce back into positive territory after that kind of decline suggests there are still buyers willing to treat dips in high-momentum names as opportunities rather than warnings.
The overall read from the Magnificent Seven today is cautiously negative. A mostly red session for a group that often acts as the market's engine adds a layer of concern to an already soft tape day. When Amazon is selling off and the group can't muster broad-based strength, it reflects the same hesitancy that pushed the Dow, Nasdaq, and Russell 2000 all into the red. With the VIX climbing 3.26% to 14.90, fear is quietly creeping back into the picture, and that's not the kind of backdrop that typically brings out aggressive buyers in mega-cap tech.
Commodity and Cryptocurrency Updates
Crude oil came roaring back today, surging 3.05% to settle at $85.94. Black gold is making a statement here, sitting well above $70 with no signs of rolling over anytime soon. Geopolitical tensions and supply dynamics continue to be the dominant forces keeping energy prices elevated, and a move of this magnitude in a single session demands attention. The longer this stays parked at these levels, the more it complicates life for the Fed — persistent energy prices feeding into inflation is exactly the kind of variable that makes rate cuts a much harder conversation.
Gold edged higher today, tacking on 0.48% to close at $4,499. After yesterday's sharp 2.25% pullback, buyers stepped back in — quietly, but purposefully. The dip didn't last long, and that tells you something about the underlying conviction behind this market. Central bank demand and macro uncertainty aren't going anywhere, and gold continues to find support on weakness. The broader trend remains firmly intact.
Bitcoin managed a modest recovery today, climbing 0.79% to close just below $78,863. After yesterday's ugly reversal knocked prices back below $80,000, today's bounce is a small step in the right direction — but that's all it is right now, a small step. Crypto bulls will need to see a more convincing reclaim of higher levels before the tone shifts meaningfully. The volatility in both directions is a reminder that this market rewards patience over conviction.
Treasury Yield Information
The 10-year Treasury yield continued its grind higher today, adding another 0.81% to close at 4.760%. That's now four basis points from the 4.8% danger zone, and the market is running out of runway. What was an 8-basis-point cushion from that critical level yesterday has been cut nearly in half in a single session. The slow-motion march higher isn't pausing, and every closing print above 4.5% is another data point confirming that yield pressure on equities is structural, not temporary.
At 4.760%, the yield sits 26 basis points above the threshold where equity strain becomes real and meaningful. The 4.8% level — where this framework signals selling accelerates — is now just 4 basis points away. That's essentially nothing. One unexpected inflation datapoint, one weak Treasury auction, one hawkish Fed comment, and yields cross that line. When they do, history suggests the equity market's response won't be subtle. The buffer that existed even a week ago has effectively vanished.
The 5% level remains 24 basis points out, and the 5.2% threshold that historically foreshadows a 20%-plus correction still sits further off. But the direction of travel is what matters most right now, and that direction remains unambiguously higher. Equity rallies in this environment are difficult to sustain because rising yields constantly reset the discount rate on future earnings, making stocks harder to justify at current valuations. The 4.8% level is the line in the sand for the sessions ahead — a clean break above it changes the conversation from uncomfortable to genuinely dangerous.
Previous Day’s Forecast Analysis
Yesterday's newsletter projected SPY trading within a fourteen-point range, with $765 as the downside floor and $779 as the maximum upside target. The bias leaned cautiously bearish given that Friday's close at $769.38 sat in the lower half of the projected range and below the critical $770 level that needed to be reclaimed for bulls to regain control of the tape.
The $770 level was identified as the single most important threshold heading into the session — reclaiming it early was the prerequisite for any bullish continuation, with $772 as the next gate and $775 the following decision point before the $779 max upside came into view. On the downside, $769 was the immediate support, $767 was flagged as the point of last hope where major support materialized, and a failure there put $765 squarely in the crosshairs. The first clean break of either $770 to the upside or $767 to the downside was expected to set the directional tone for the entire session.
The recommended strategy called for position sizing in the 70-75% range given the low-volatility environment and below-average volume backdrop. For longs, the preferred entry was a pullback into the $768.50-$769 area with an initial target of $773 and a stretch target of $775-$775.29, with stops below $768.31. For shorts, a clean breakdown below $768.31 on accelerating volume opened a trade targeting $764 initially and $761-$762 as the secondary destination, with stops above $772. The strategy emphasized waiting for the market to show conviction before adding size in either direction.
Market Performance vs. Forecast
Monday's session tracked the bearish tilt embedded in the prior forecast with notable precision, as price opened below the critical $770 floor and never made a serious attempt to reclaim it — validating the framework's core directional read heading into the week. The forecast made clear that Friday's close below $770 put the burden on bulls to reclaim that level early, and Monday's open at $767.33 confirmed that burden went unmet. Price spent the entire session in the lower portion of the projected range, which is exactly the behavior the strategy warned about when it noted that losing $768.31 cleanly would open the door to accelerating selling pressure toward the $764 primary short target.
What the model got right was the directional bias and the level structure. The falling market scenario laid out a short entry on a clean break of $768.31 targeting $764 as the primary destination, and Monday's low of $764.72 came within a dollar of that exact target — a remarkably tight outcome given that price traversed the full downside scenario the forecast mapped. The $767 zone identified as "the point of last hope where major support comes in" also proved meaningful, with the close at $767.02 landing almost precisely on that level, suggesting buyers did step in around that reference point to stabilize price into the bell. The VIX's move higher to 14.90 — a 3.26% gain — was consistent with the forecast's caution that suppressed volatility has a reputation for snapping hard once direction is established, and that's exactly what played out as sellers gained traction on below-average volume. Risk management protocols protected capital throughout, and the framework's level-based roadmap gave traders a clear structure to work with from open to close. The model continues to demonstrate that disciplined level identification and a well-defined directional bias are the most durable tools in navigating sessions like this one.
Premarket Analysis Summary
The premarket analysis posted at market open identified SPY spot at $767.42 in a put-dominated tape, giving back Friday's push and sitting just below the level that had launched the prior week's breakout. The expected move was set at six points, and the defining level of the day was $768 — flagged as the gate right above spot and where the tape would begin to repair, with a reclaim and hold of that level needed to put buyers back in control. Upside targets were set at $769, $770, $772, and $774, with $769 as the first target on a hold of $768, $770 as the next decision point where price was expected to stall, $772 as the level bulls really needed to reclaim to get the prior week's move back on track, and $774 standing as max upside at the top of the expected move. On the downside, $766 was flagged as the first level to watch just beneath spot, with a clean loss of it opening the door for acceleration, $765 as the most important level below and the site of the heaviest battle, $764 as the point of last hope and the floor holding the range together, and $761 as max downside at the bottom of the expected move.
The actual session sided with the bears and confirmed the vulnerability flagged around the $766–$768 pinch. SPY opened at $767.33 and managed only a modest push to a high of $767.99, never reclaiming the critical $768 gate, before sellers stepped in and pushed price lower. The low of $764.72 undercut the $764 point of last hope and reached deep into the lower end of the expected range, validating the warning that a clean break of $765 could get ugly fast. The close at $767.02 for a loss of 0.30% left price still trapped below $768, with the burden on buyers remaining unmet as the new month opened. The VIX rising 3.26% to 14.90 reflected the session's anxious tone, and below-average volume accompanying the intraday fade suggested limited conviction on either side as price settled in the middle of the damage.
Validation of the Analysis
Today's session played out almost exactly as the premarket framework described, with SPY navigating the tight range between 766 and 768 that the analysis identified as the defining battleground. The open at $767.33 came in just beneath the 768 gate — the exact level the premarket called out as the spot where the tape begins to repair — and bulls never reclaimed it. The analysis was explicit: the burden was on buyers to take 768 back, and with the high of the day reaching only $767.99, price stalled a penny short of that threshold and never threatened it again. That was not an accident — the premarket flagged 768 as the defining level, and the market respected it to the cent.
From there, the downside framework took over just as described. The premarket warned that losing 766 cleanly would open the door for acceleration, and that is precisely what happened as SPY sliced through 766 and pressed toward the 765 zone identified as the heaviest battle below. The low of $764.72 undercut 765 and pushed into the 764 area the analysis called the point of last hope and the floor holding the range together — and that is exactly where buyers showed up to defend. Price bounced off that floor and closed at $767.02, right back inside the contested zone between 765 and 768, just as the structure suggested it would stabilize. Traders who faded the 768 rejection had a clean short setup with 765 and 764 as textbook targets, and those watching 765 as the key battle level got confirmation of the bounce right at the framework's support. The premarket delivered the roadmap with precision from open to close.
Looking Ahead
Tuesday's economic calendar brings ISM Manufacturing PMI for August, and that's the headliner traders will be watching as the market steps into September. Manufacturing data has been a reliable sentiment mover lately, and with investors already calibrating their read on economic health heading into the fall, a print that comes in either well above or well below the 50 expansion/contraction line could set the tone for the entire week. A stronger-than-expected number would signal that industrial activity is holding up better than feared, which could give risk assets a lift. A weak print, on the other hand, would stoke recession concerns and put pressure on equities right out of the gate on the first trading day of the month.
Beyond the headline PMI number, traders will also be paying attention to the prices paid and new orders sub-components, which tend to carry outsized influence on how the bond market and Fed expectations shift in response. The first session of September already carries symbolic weight as portfolio managers reset their positioning for a new month, so layering a high-impact data release on top of that structural dynamic makes Tuesday a session that demands full attention. Clean entries and disciplined risk management will matter here, because the combination of fresh-month positioning and hard economic data has all the ingredients for a volatile, directional open.
Market Sentiment and Key Levels
The directional bias today leans bearish, though the selling remained measured rather than aggressive. SPY dropped 0.30% on below-average volume of 32.13M shares, meaning bears had the edge but couldn't generate enough conviction to spark a real breakdown. The VIX rising 3.26% to 14.90 is worth watching — volatility is creeping higher, and that kind of uptick on a relatively quiet session suggests traders are quietly hedging against something bigger brewing beneath the surface. The broader market showed broad-based weakness with the Dow leading losses at -0.70% and the Russell 2000 sliding -0.47%, while the Nasdaq held up best at -0.12%. When small caps and blue chips are taking the worst of it, that's a sign of caution spreading across the risk spectrum.
Key resistance sits at $767.99, today's intraday high. A sustained push above that level on meaningful volume would signal the bulls are stepping back in and that today's softness was nothing more than routine digestion. On the downside, $764.72 is the immediate support to defend — if that level gives way with conviction, it opens the door to accelerated selling and a more serious test of lower price zones. Gold ticking up 0.48% to $4,499 shows a modest safe-haven bid, and Bitcoin's 0.79% gain closing below $78,863 is a mixed signal at best. The 10-year Treasury yield climbing another 0.81% to close at 4.760% remains a persistent headwind — yields at that level keep pressure on equity valuations, and any further drift higher in rates could easily turn today's mild weakness into something more consequential. Bulls need a definitive reclaim of resistance backed by volume to shift this narrative.
Expected Price Action
Tuesday's session brings actionable intelligence generated by our AI model, with SPY projected to trade within a range defined by $761 on the downside and $774 as the max upside target. That thirteen-point window keeps this in trending territory, meaning participants should be positioned for a directional move rather than expecting a choppy, indecisive grind. Monday's close at $767.02 sits in the lower-middle portion of that projected range, and with the VIX rising 3.26% to 14.90, the fear gauge is creeping back into the picture — a setup that tilts the near-term bias cautiously bearish until the bulls can prove otherwise.
The defining level to reclaim on Tuesday is $768, which the premarket notes flagged as the gate right above spot and where the tape begins to repair. Monday's session closed below it, putting the burden squarely on buyers to reclaim and hold $768 early in the session. Do that convincingly and $769 becomes the first target, with $770 acting as the next decision point where price should want to stall. Above $770, $772 is the level bulls really need — it carries the heaviest overhead concentration and a clean reclaim there gets last week's breakout move back on track. Beyond that, $774 caps the expected move as max upside. On the downside, $766 is the first line of defense sitting just beneath spot, and losing it cleanly opens the door for acceleration lower. Below there, $765 is the most important support level and where the heaviest battle sits — a clean break of $765 could get ugly fast. Under that, $764 is the point of last hope holding this range together, and a failure there leaves little cushion before $761 at the bottom of the expected move becomes the target. With spot pinned between $766 and $768 heading into Tuesday, this one resolves off the first clean break — and the burden remains on buyers to take $768 back.
Trading Strategy
The VIX rising 3.26% to 14.90 is worth paying attention to — it's not a dramatic spike, but it's a meaningful uptick from the recent complacency zone. At 14.90, the options market is starting to price in a modest increase in near-term risk, and that shift in volatility tone deserves respect. The mild uptick in the VIX alongside subdued trading volume tells you the bears are nudging the door open but haven't kicked it in yet. With volume running below average and the broad tape leaning soft, there's no reason to press hard in either direction. Position sizing in the 65-70% range is the right call here — the vol environment is still manageable, but the VIX's upward move warrants trimming your exposure slightly compared to a calmer session. Keep stop-losses in the 0.75-1.0% band from entry, and let the market prove itself before adding size.
In a rising market scenario, bulls need to reclaim and hold above the $768-$769 zone to have a credible case. The preferred long entry is a constructive pullback into the $765-$766 area, which aligns with the lower end of today's trading range and represents near-term intraday support. The initial profit target is $771, with a stretch target at $773-$775 if buyers can generate real volume expansion behind the move. Stops on longs belong below $764.72 to protect against a failed bounce. Only add aggressively to long exposure once price clears $769 with momentum behind it — a slow, low-volume grind higher in this environment is a trap, not a trend.
In a falling market scenario, $764.72 is the immediate line in the sand. A clean breakdown below that level on expanding selling pressure opens a short entry targeting $761-$762 as the primary profit destination, with $758-$759 as the secondary target if sellers gain real footing. Stops on shorts belong above $768 to keep risk tightly defined and avoid getting squeezed on a snap reversal. If the market opens weak and rolls straight through $764.72 without finding support, treat that as your trigger to initiate shorts with measured size. Cover methodically into those support levels and don't let the still-moderate 14.90 VIX breed false comfort — volatility that's creeping higher has a way of accelerating quickly once sellers find conviction, and a market moving on below-average volume can reprice sharply the moment real participation arrives.
Model’s Projected Range
SPY's projected maximum range for Tuesday is $763 to $772, with the Call side dominating in a contracting band that suggests choppy price action with intermittent trending periods. Tuesday brings Consumer Confidence data which could move markets if it surprises significantly. This is a holiday-shortened week with thin volume expected, so we don't anticipate too much movement absent an external catalyst until Friday's jobs report, and even then we suspect by noon the market will go sideways into the long weekend. SPY closed at $767.02, down 0.30% on the day, after opening at $767.33 and trading between a high of $767.99 and a low of $764.72 on light volume as the market digested renewed Iran hostilities that drove the overnight weakness. The long-term bull trend remains intact above $640 with SPY well above structural support. As long as price holds above key structural levels, this remains a broader dip-buying environment. If our first resistance at $768 breaks, price targets $770, while a break of first support at $766 would target $765. Should $763 fail to hold, there is little to keep price from falling toward $760. Absent a catalyst, resistance sits at $768, $770, $772 and $774 with support at $766, $765, $764 and $763. The VIX closed at 14.90, up 3.26%, a modest rise in fear consistent with the geopolitical headline risk. SPY closed near the upper trend channel line with structural support well below current price levels.
Market State Indicator (MSI) Forecast
Current Market State Overview:
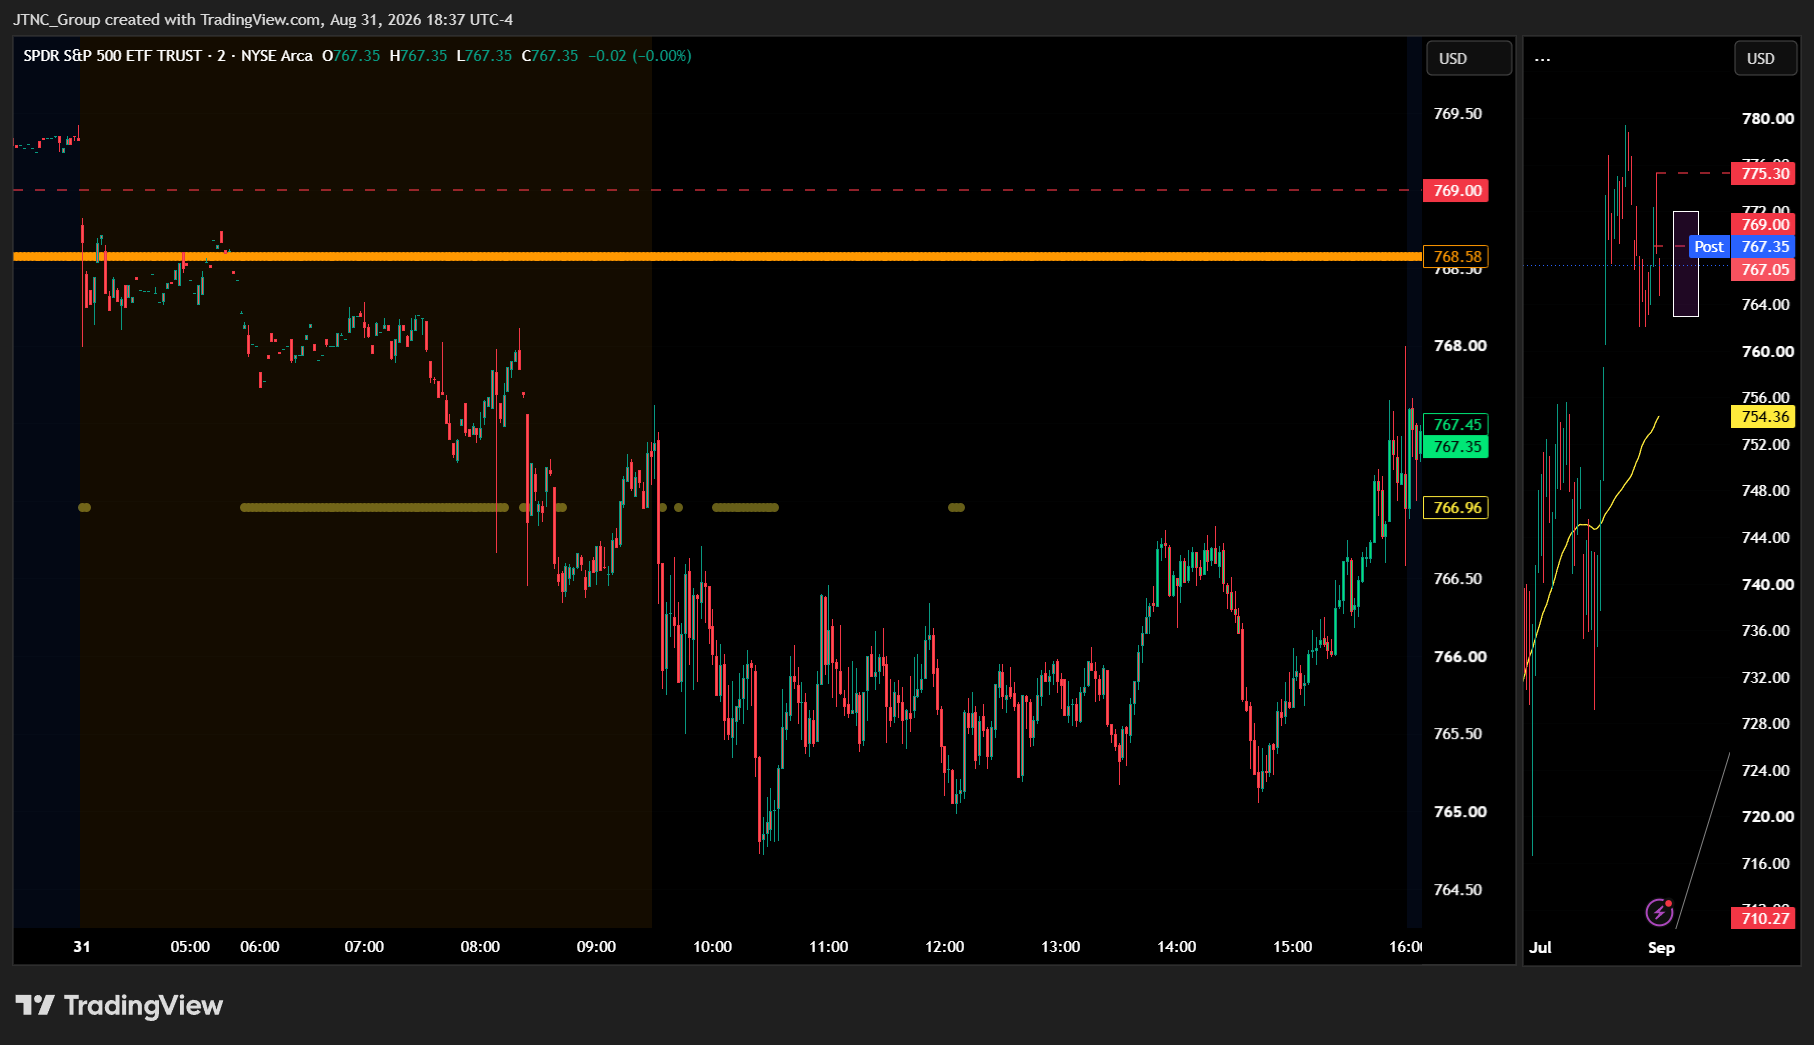
The MSI ended in a Bearish Trending Market State with SPY closing at $767.02. Since SPY closed below MSI support at $768.58, that former support now becomes resistance heading into Tuesday. Extended targets were not printing at the close. Extended targets were active during premarket printing below as the overnight selloff on renewed Iran hostilities pushed price from $768 down toward $765. The MSI did not rescale overnight and instead remained in its bearish state from Friday afternoon. While SPY broke Friday's lows as we suggested it may, this was due primarily to hostilities erupting again with Iran. The move lower came mostly overnight and in premarket with extended targets forecasting additional weakness. But once extended targets stopped printing in the late morning, SPY made a run back toward MSI support turned resistance and closed down just 0.30%. A very difficult trading day with an extremely tight range that lasted until the last hour. With the MSI not rescaling for the entire session and without extended targets, it is likely SPY moves back into the MSI range and tests MSI resistance while also potentially testing the day's lows once again. Remember this is a holiday week and volume is quite thin so we don't expect too much movement absent an external catalyst until Friday's jobs report. The narrow $1.62 Bearish Trending spread suggests consolidation. MSI support is $768.58 with resistance at $770.20.
Key Levels and Market Movements:
Friday we stated the MSI was forecasting some potential weakness that may test the lows and Monday delivered exactly that as renewed Iran hostilities drove the overnight gap lower. SPY opened at $767.33 below MSI support and immediately tested the downside, pushing to a session low of $764.72 before finding buyers. With the MSI holding its bearish state but not rescaling lower and extended targets stopping below, the selloff lacked follow-through — a key signal for traders watching the framework. SPY spent the rest of the session grinding sideways in an extremely tight range between $765 and $768 before a late push lifted price back toward $767. This was a one-trade session at best — a buy off the morning lows once extended targets stopped printing below. At minimum it was a one-for-one session for traders following the framework. It was an easy day to read albeit not an easy day to trade given the tight choppy range. But the setup was present, identified through proper context, patience, and flexibility while leveraging the MSI, premarket levels, and market structure rather than forcing trades. The MSI continues to prove its reliability as the cornerstone of our trading process.
Trading Strategy Based on MSI:
Tuesday has Consumer Confidence data but this is a holiday-shortened week with thin volume expected so the market is likely to move more sideways than trend. The narrow Bearish Trending MSI suggests consolidation rather than strong trending. It is likely SPY moves back into the MSI range and tests MSI resistance while also potentially testing the day's lows once again. With such a narrow range it is also likely the MSI rescales overnight and a short squeeze ensues which will push price back to test higher levels.
Bulls want to see overnight price reclaim $768.58 and push back into the MSI range toward $770.20 resistance. If the MSI rescales higher with extended targets above, the pullback from last week's highs is just a healthy consolidation and the rally resumes. Bears want to see $768.58 continue to act as resistance and press price toward $765 and below. If the MSI rescales lower with extended targets below, Monday's lows come back into play. Given holiday week thin volume, failed breakouts and failed breakdowns are the highest-probability setups.
The long-term bull trend remains intact above $640 and failed breakouts and failed breakdowns continue to offer the highest-probability setups. Remain flexible, avoid trading during Ranging Market States unless a clear failed breakout or breakdown presents itself, and ensure all trades are fully aligned with MSI signals. Providing real-time insights into market control, momentum shifts, and actionable levels, the MSI when integrated with our Pre-Market and Post-Market Reports continues to sharpen execution precision and elevate trade quality. If you haven't yet integrated MSI and our model levels into your process, now is the time. Contact your representative to get started as these tools are designed to support consistency and enhance performance.
Dealer Positioning Analysis
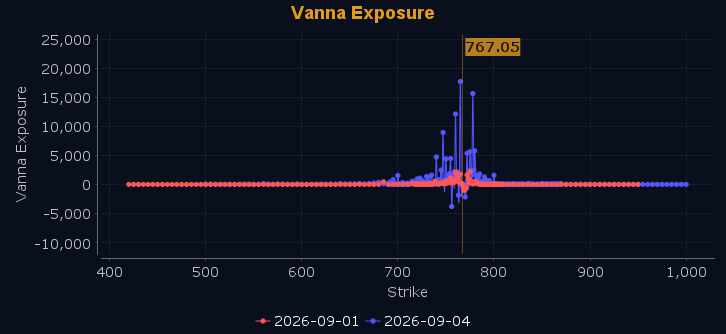
Dealers are selling SPY $774 to $790 and higher strike Calls while buying $768 to $773 Calls, indicating the Dealers' desire to participate in any rally on Tuesday. The ceiling for Tuesday appears to be $775. To the downside, Dealers are buying $767 to $710 and lower strike Puts in a 2:1 ratio to the Calls they're selling, displaying moderate concern that prices could move lower. Dealers are buying ATM Calls looking to participate in any rally Tuesday. They have not increased their hedges but at the same time they are not selling ATM Puts so they are not overly bullish for Tuesday. Below $765 is bearish and above $770 is bullish with everything in between being chop and trap filled. Should SPY fail to hold $765, $760 is in play while above $770 there is a wall of resistance to $775 which will slow any ascent. Dealer positioning is unchanged at bullish.
Looking Ahead to Next Friday:
Dealers are selling SPY $772 to $805 and higher strike Calls for the week ahead while buying $768 to $771 Calls. The ceiling for the week appears to be $778. To the downside, Dealers are buying $767 to $655 and lower strike Puts in a 3:1 ratio to the Calls they're selling, displaying moderate concern that prices could move lower. Dealers are no longer selling ATM Puts but are selling well OTM Puts at $756 and $763, implying their belief that even if prices continue to fall they won't fall below $756. Dealers do not sell ATM Puts unless they believe there is a floor in the market at $756. They are also buying ATM Calls so they will benefit from any rally into Friday. We remain bullish above $770 but below $766 we are bearish with the zone in between being nothing but chop and full of traps. For the week Dealer positioning has changed to neutral/slightly bearish. We advise reviewing Dealer positioning daily for directional clues. These positions evolve quickly and tracking them is essential for staying ahead of shifting market sentiment.
Recommendation for Traders
With SPY closing at $767.02 and VIX rising 3.26% to 14.90, the near-term bias leans cautiously defensive. Look to fade bounces toward $767.99 with stops above that level, and watch $764.72 as near-term support — a break below opens the door to further downside.
Keep risk tight with the 10-year yield at 4.760 and creeping toward the critical 4.8% danger zone. Always review the premarket analysis posted before 9 AM ET for any changes in the model's outlook and Dealer Positioning.
Good luck and good trading!
