
Market Insights: Thursday, August 20th, 2026
Market Overview
US stocks gave back Wednesday's gains on Thursday as bond yields rebounded and fresh geopolitical tension sent oil prices surging. The Dow dropped 1.3%, or nearly 700 points, the S&P 500 slipped 0.8%, and the Nasdaq fell 1% after all three had managed modest wins the session before. The Treasury Department's surprise intervention to cap long-dated yields proved short-lived — the 10-year climbed 4 basis points to 4.69% and the 30-year rose 4 basis points to 5.24%, essentially reversing the prior day's relief rally. Treasury Secretary Scott Bessent told CNBC that buybacks could exceed $4 billion and that the move was meant "to show that we believe that the yields don't reflect the underlying fundamentals," but markets weren't buying it.
The selling was broad, with Walmart leading consumer stocks lower after dropping over 9% despite reporting solid earnings — shoppers are making "trade-offs" because of high gas prices, and that spooked the market. Meanwhile, the national debt crossed $40 trillion, more than doubling in under a decade, prompting fresh warnings about a potential "debt spiral" even as Bessent brushed it off. On the geopolitical front, Trump took to Truth Social threatening "ECONOMIC D-DAY" against Iran with "Economic Warfare and Isolation on an unprecedented scale," driving Brent crude above $93 per barrel and WTI to $86. Bitcoin, bucking the risk-off mood, surged past $70,000 for the first time since early June.
SPY Performance
SPY opened at $765.96 and struggled to find any footing from the start. The high of $768.15 came early and faded fast, with sellers stepping in to deny any meaningful upside follow-through. From there, price ground lower through the session, carving out a low of $762.05 before settling at $762.78 — right near the bottom of the range. That's a $6.10 spread from low to high, a wider range than the prior session and one that leaned heavily bearish from open to close.
SPY finished down 0.82% on the day, giving back the prior session's modest gain and then some. Volume came in at 40.13 million shares, near average, meaning this wasn't a low-conviction drift lower — there was real participation behind the selling. That's the kind of price-volume combination that gets bears more comfortable and bulls more nervous. Making things worse, the VIX surged 7.52% to close at 16.01, signaling a meaningful uptick in fear and confirming that the market isn't shrugging off the pressure. Two sessions ago the VIX was pulling back and offering bulls a glimmer of hope — today erased that entirely. Until SPY can stop making lower lows, attract buyers on volume, and push back toward the upper end of its recent range, the path of least resistance remains pointed south.
Major Indices Performance
The Nasdaq held up best among the major indices today, though "best" is relative in a session that saw broad red across the board. The tech-heavy index dropped 1.0%, weighed down by weakness across the growth names that typically drive it. When sentiment sours and investors start trimming risk, high-multiple tech stocks are usually the first to feel it — and today was no exception. That said, a 1.0% decline could have been worse given the macro headwinds in play, and the index avoided a more significant breakdown.
The Dow and Russell 2000 both took harder hits, with the Dow falling 1.32% and the Russell 2000 close behind at 1.33%. The Dow's decline is notable because blue-chip names don't usually lead a selloff — when the defensives are getting hit, it tells you the selling pressure is broad-based and not just a tech story. The S&P 500 also finished firmly in the red, consistent with the negative tone that swept across every corner of the market.
The Russell 2000's 1.33% drop is worth paying attention to. Small-caps are particularly sensitive to interest rate expectations and credit conditions, so when yields are elevated and risk appetite fades, these names tend to get hit first and hardest. After flashing some optimism in yesterday's session, small-cap bulls got a cold reminder that the macro environment still carries real bite. Today wasn't a subtle, sector-specific pullback — it was a broad retreat that left very little green on the screen.
Notable Stock Movements
Amazon took the dubious honor of leading the Magnificent Seven to the downside today, dropping -2.16% to headline what was a mostly red session for the cohort. That's a meaningful decline for a name of Amazon's scale, and when the group's biggest movers are pushing lower rather than higher, it creates a very different kind of gravitational pull on the tape than what investors enjoyed in the prior session. Amazon leading losses sends a clear message — the demand-side of the economy, at least as Wall Street is pricing it, is getting questioned again.
The Magnificent Seven as a group had a rough go of it today, with the majority of names finishing in the red and the overall tone standing in stark contrast to the clean, mostly green showing from the prior session. After one of the more constructive days this cohort had strung together recently, today's reversal serves as a reminder of just how quickly sentiment can shift when macro headwinds reassert themselves. One good day doesn't break a pattern, and today's performance made that painfully clear.
What makes today's broad weakness across the cohort worth watching is the signal it sends for overall market sentiment. These are the stocks that institutional money leans on when risk appetite is healthy, and when they're collectively declining, it tends to confirm rather than contradict what the broader indices are doing. With the Nasdaq off -1.0% and the rest of the major averages also finishing well in the red, the Magnificent Seven wasn't bucking the trend — it was reinforcing it. Until this group can string together consecutive days of coordinated upside, the broader market is going to have a very hard ceiling to work against.
Commodity and Cryptocurrency Updates
Crude oil added another 0.90% on the session, settling at $86.60 and continuing to push well above levels that would give policymakers any comfort. Energy has been defying longer-term expectations for some time now, and with prices entrenched in the mid-to-upper $80s, the inflationary math doesn't get easier from here. Supply remains tight, global demand isn't rolling over, and there's no clear near-term catalyst to drag crude back toward more neutral territory. The longer black gold stays camped out at these levels, the more complicated the Fed's job becomes — and that's a headwind the broader market simply can't shake off.
Gold continued its impressive run, tacking on another 2.17% to close at $4,587. The metal has been in full momentum mode, and today's move only reinforces the idea that buyers aren't waiting around for pullbacks. Central bank demand, macro uncertainty, and persistent inflation concerns remain the structural pillars holding this rally together, and nothing in today's session suggested any of that is changing. The bull case for gold remains firmly intact.
Bitcoin had another strong showing, climbing 4.95% to close above $72,698. That's a meaningful push higher that builds on recent upside momentum and keeps bulls firmly in control of the narrative. Demand has been consistent and conviction appears to be growing, with buyers stepping in rather than fading strength. The crypto market's tone remains decidedly positive, and Bitcoin is once again leading the charge.
Treasury Yield Information
The 10-year Treasury yield reversed course today, climbing 0.92% to close at 4.700%. That snaps the two-day pullback that had been building a little optimism, and it's a reminder that yield relief in this environment tends to be fragile. One decent session of calm, and then the pressure creeps right back.
At 4.700%, the yield is now sitting 20 basis points above the 4.5% threshold where equities begin to feel genuine strain — and today's broad market selloff reflects exactly that dynamic. The cushion that was slowly building over the prior two sessions has been trimmed back, and the yield is now pushing closer to territory that makes investors genuinely uncomfortable. The 4.8% level, where this framework calls for accelerating selling and more serious market damage, is only 10 basis points away. That's not a comfortable margin. A single hawkish Fed comment, a hot inflation reading, or a poorly received Treasury auction could breach that level without much warning.
The 5% mark — where things get genuinely painful — is still 30 basis points out, and the 5.2% correction territory remains further off. But the direction of travel today is the wrong one, and that matters. Two steps forward, one step back is still progress, but when yields are hovering this close to 4.8%, even small moves in the wrong direction carry real weight for stocks.
What to watch now is whether today's bounce in yield was a one-day blip or the start of a renewed push higher. If the 10-year stabilizes and pulls back below 4.65%, the market can find its footing again. If it keeps drifting toward 4.8%, expect selling pressure to intensify. The level to defend is clear — the direction over the next few sessions will tell the story.
Previous Day’s Forecast Analysis
Thursday's forecast called for SPY to trade within a projected range of $762 on the downside and $775 as the max upside target, a thirteen-point window that the model characterized as wide enough for purposeful directional movement rather than rangebound drift. With Wednesday's close at $769.10 sitting in the lower half of that range, the bias leaned modestly bearish heading into the session, though the VIX dropping 4.99% to 15.05 was flagged as a constructive signal suggesting sellers were losing some conviction.
The $769 level was identified as the defining pivot of the session — the line separating two very different outcomes. A clean reclaim of $769 pointed bulls toward $770 as the next immediate target, with $771 and $773 as subsequent decision points and $775 representing max upside and the heaviest overhead resistance. On the downside, $767 was the first warning level, with $766 the next decision point and $765 flagged as the most critical battleground where the heaviest support fight was expected. A break below $765 opened the door to $762 as the session floor.
The recommended strategy called for position sizing in the 80-90% range with stop-losses widened slightly to the 1.0-1.25% band from entry, given the calmer volatility backdrop. In a rising scenario, the preferred entry was a confirmed bounce off $769-770 with stops below $768, targeting the $774-775 zone with $777 as the stretch goal. In a falling scenario, a breakdown below $768.11 set up a short targeting $765-766 with stops above $770, and a push through $765 with conviction opened a secondary target at $762-763. The overall message was to respect directional breaks as they developed and avoid letting a low-fear environment breed complacency.
Market Performance vs. Forecast
Thursday's session opened at $765.96, slicing directly through the forecast's first major support cluster and immediately signaling that sellers had control before the opening bell finished ringing. The model had identified $767 as the first line bears needed to crack to hand the session to the downside — Thursday's open never even tested that level from above, instead gapping beneath it and putting the $765 battleground zone in play from the jump. That kind of gap-down open reflects external pressure that the model's base case scenario doesn't price in, and Thursday's move was driven by forces beyond the framework's standard inputs. The model does not account for unpredictable geopolitical developments, surprise macro headlines, or sentiment shocks — and when those catalysts hit, price action can exceed the projected range in ways that no quantitative framework is designed to anticipate.
What the model got right was the architecture of the downside. The forecast had mapped $765 as the most critical battleground and flagged $762 as the max downside floor — Thursday's low of $762.05 found its footing almost exactly at that level before buyers showed any sign of life. That's not coincidence — that's the framework identifying where structural support should live, and the tape confirmed it. The falling market scenario had outlined $762-763 as the secondary profit target for traders running trailing stops on shorts, meaning disciplined traders following that roadmap had a clearly defined cover zone that aligned directly with where Thursday's selling exhausted itself. Risk management protocols protected capital for anyone who respected the stop structure above $770 and managed size accordingly. The VIX surging 7.52% to 16.01 confirmed the anxiety the model had cautioned was still lurking beneath a calm surface — the low-fear warning in the prior forecast proved prescient even as the directional magnitude surprised. The framework's level precision continues to deliver real value, and its ability to pinpoint the exact floor of a sharp down move is exactly why respecting the full projected range — not just the base case — remains essential to navigating sessions like this one.
Premarket Analysis Summary
The premarket analysis posted at market open identified SPY spot at $767 in a put-dominated tape, holding flat on the level that had given way Tuesday after two straight sessions of selling pressure. The expected move was widened to six points, signaling participants were bracing for larger swings with just one session left in the week. The defining level of the day was $769 — flagged as the gate sitting directly above spot and the point where the tape would begin to repair. Upside targets were set at $770, $771, $772, and $773, with $772 identified as the level bulls really needed to reclaim to flip the tone and $773 standing as the max upside cap on the expected move. On the downside, $766 was the first level to watch sitting just beneath spot, $765 was flagged as the most important level below with the heaviest battle expected there, $764 was identified as the point of last hope and the floor holding the move together, and $761 stood as max downside at the bottom of the expected move. The analysis placed the burden squarely on buyers, warning that a clean loss of $766 early would open the door for a quick test of $765 and that a failure there could get ugly fast.
The actual session confirmed the bearish concern with authority. SPY opened at $765.96, immediately below the $766 first support level, triggering the very acceleration the premarket warned about. Price made a brief attempt higher, tagging $768.15 on the high but never threatening the $769 defining level or any of the upside targets. The downside played out largely as scripted — the tape broke through $766, fought at $765, and eventually cracked through $764, the point of last hope, with the low of $762.05 reaching deep into the lower end of the expected move toward the $761 max downside. The close at $762.78 locked in a loss of 0.82% and settled price well below every level of consequence from the morning analysis. The VIX surging 7.52% to 16.01 confirmed the fear that was always lurking in the put-dominated setup — buyers never showed up, and the tape delivered exactly the kind of ugly breakdown the premarket flagged as the risk scenario.
Validation of the Analysis
Thursday's session validated the premarket framework from the first print, with SPY opening directly at $765.96 and immediately confirming the concern flagged before the open — that losing 766 cleanly would open the door for acceleration lower. The analysis was explicit: 766 was the first level to watch just beneath spot, and the open sitting right on it was the day's first real signal. Buyers couldn't defend it, and the tape wasted no time working toward 765, which the premarket identified as the most important level below and where the heaviest battle would sit. That battle played out exactly as described, with price eventually breaking through and pushing to a low of $762.05 — a clean test of the 761 max downside zone at the bottom of the expected move. The framework defined the full range of the session before a single share traded.
The upside analysis proved equally sharp. The premarket identified 769 as the defining gate above spot and noted the burden was entirely on buyers — a burden they were never able to meet. The high of $768.15 stopped just short of that 769 level, which is textbook resistance behavior. Every bounce attempt ran directly into the ceiling the analysis had mapped, and sellers retained control throughout. The close at $762.78 settled just above the 761 max downside target, containing the entire day within the six-point expected move that was telegraphed heading in. With the VIX surging 7.52% to 16.01 confirming the fear that was already baked into the put-dominated tape description, traders who leaned short below 766 early, used 765 as their acceleration trigger, and targeted 761 as the floor had a fully structured session with defined entries and logical exits at every key level.
Looking Ahead
Friday's economic calendar is quiet, with no high-impact releases on the schedule to push the market in either direction. That gives traders a clean session to assess how the week's narrative is holding up heading into the weekend. After Wednesday's FOMC Minutes provided the week's main macro catalyst, Friday becomes more about conviction than new information — the kind of session where you find out whether the moves made earlier in the week were built on solid footing or just noise.
With no data to reset the story, price action will do the talking. Watch how the major indices behave relative to the levels that emerged out of the Minutes reaction — if strength has been the theme, the question is whether buyers show up to defend it or if the market starts leaking into the close. If the week's tone has been cautious, look for signs of stabilization or any late positioning ahead of the weekend. A quiet Friday is rarely boring — it's just a different kind of signal, and often a useful one.
Market Sentiment and Key Levels
The directional bias today tilts firmly bearish, and unlike some days where you have to squint to read the tape, this one is pretty clear. SPY shed 0.82% and closed near the lows of the session, finishing at $762.78 after briefly touching $768.15 early on — that failed attempt to hold the highs is exactly the kind of price action that emboldens sellers. The broader market confirmed the weakness across the board, with the Dow and Russell 2000 each getting hit harder than SPY, and the Nasdaq sliding 1.0%. When small caps and tech are both rolling over in unison, the bulls don't have many places to hide. The VIX jumping 7.52% to 16.01 is the options market sending a clear message — hedging demand is picking up, and volatility sellers are stepping back, which is a headwind for equities heading into the next session.
Key resistance to watch is $768.15, the intraday high that SPY tagged and immediately rejected. A reclaim of that level on meaningful volume would be the first sign bulls are clawing back control, and above there the $765.96 open becomes a secondary checkpoint to clear before the picture improves. On the downside, $762.05 — today's intraday low — is the immediate support line in the sand. A break below that print on expanding volume would be a meaningful deterioration, opening the door toward the $760 area and potentially lower if selling pressure accelerates. With the 10-year yield still elevated above 4.5% and crude oil adding to inflationary noise, the macro backdrop isn't doing equities any favors. Gold's 2.17% surge to $4,587 and Bitcoin's nearly 5% rally closing above $72,698 do carry some risk-on energy, but that enthusiasm hasn't translated into equity buying yet. Bears are in the driver's seat for now, and bulls need to show up with conviction to change that narrative.
Expected Price Action
Friday's session brings actionable intelligence generated by our AI model, with SPY projected to trade within a range defined by $761 on the downside and $773 as the max upside target. That twelve-point window sits just at the edge of trending territory, meaning participants should expect purposeful directional movement rather than lazy sideways chop — this is not a setup for drift. With Thursday's close sitting in the lower portion of the projected range and the VIX surging 7.52% to 16.01, fear is on the rise and bears carry a clear structural edge heading into Friday's final session of the week.
The $769 level remains the defining line in the sand — it's the gate above the tape and the level that has to be reclaimed for any real repair to begin. Push through $769 cleanly and $770 becomes the first meaningful target, with $771 the next decision point and $772 the level bulls truly need to reclaim to flip the tone after this week's slide. Above that, $773 stands as max upside and the heaviest overhead resistance on the board — reaching it would require a genuine shift in sentiment. On the downside, $766 is the first level to respect and sits just beneath Thursday's close, meaning sellers who push through there early hand the session to bears in a hurry. Below $766, $765 becomes the most critical battleground and where the heaviest support fight should occur — a clean break there could get ugly fast. Under $765, $764 is the last line of defense before $761 serves as max downside and the floor at the bottom of the expected move. Bias leans bearish given where Thursday closed within the projected range, but the real question is whether buyers can reclaim $769 and hold it, or whether sellers crack $766 early and force a quick trip toward $765. Those two levels decide Friday's direction.
Trading Strategy
The VIX rising 7.52% to 16.01 is a warning shot for bulls. Fear is creeping back into the market, and that directional move higher in volatility — on top of broad-based selling across every major index — tells you hedging activity is picking up. At 16.01, the VIX isn't at panic levels yet, but the speed of that jump matters. When volatility expands at this pace on near-average volume, it suggests institutional players are repositioning defensively rather than buying the dip with conviction. Trim position sizing down to the 60-70% range to reflect the elevated risk environment, and tighten stop-losses to the 0.75-1.0% band from entry. This is not a session to be a hero — let the market show its hand before committing size.
In a rising market scenario, bulls need to reclaim $765 quickly and push back toward the $768 zone to signal that today's selling was a one-day shakeout rather than a trend change. A confirmed bounce off $762-763 support — which held as the session low — is the preferred long entry, with the initial profit target sitting at $765 and the stretch goal at $768.15 if buying momentum returns. Stops on longs belong below $761 to give the trade room to breathe without absorbing a deeper breakdown. With the VIX elevated at 16.01, don't chase any early morning gap up — wait for a clean retest of support with visible buying participation before pulling the trigger.
In a falling market scenario, the critical level to watch is $762.05, the session low. A sustained break below that floor with renewed selling pressure sets up a short entry targeting the $758-759 zone as the primary profit target, with $755 as the secondary target if sellers stay in control. Place stops on shorts firmly above $765 to keep risk defined. If the market opens weak and immediately breaks $762 without any meaningful buying response, that's your signal to add to the short side with conviction. Cover into support rather than chasing the move lower, and don't let the still-moderate VIX reading fool you — 16.01 is heading in a dangerous direction, and the trend of that move matters as much as the level itself.
Model’s Projected Range
SPY's projected maximum range for Friday is $756 to $769, with the Put side dominating in an expanding band that suggests trending price action with intermittent chop. Friday brings no economic news due out so the market will trade on technicals. SPY closed at $762.78, down 0.82%, after opening at $765.96, tagging a high of $768.15, and sliding to a low of $762.05 before settling near session lows — a session that saw sellers in control for most of the day with volume coming in below average. SPY remains in the $760 to $765 range that has defined recent trading, with ongoing trade policy uncertainty continuing to weigh on sentiment and keep buyers cautious near the top of the range. On the upside, our model shows the first resistance at $765, and a clean break above that level targets $769 next — on the downside, the first support sits at $760, and a break below there opens the door to $756, and if that gives way there is little to keep price from falling toward $750. The long-term bull trend remains intact above $640 with SPY well above structural support. As long as price holds above key structural levels, this remains a broader dip-buying environment. Absent a catalyst, resistance sits at $765, $769, $770, $775, while support rests at $760, $756, $755, $750. Given that SPY closed near the lower end of the range at $762.78, we favor buying dips at $760 where our model shows initial support holding. Bitcoin surged 4.95% to close above $72,698, showing genuine strength in the risk-on crypto space, while MAG stocks were mostly red led by Amazon down 2.16% — sustained weakness across both leadership groups would be required to signal a deeper pullback. The VIX closed at 16.01, up 7.52%, suggesting elevated fear given the broad selloff in equities and the underperformance in mega-cap names. SPY closed just above the lower line of the trend channel with structural support near $760, keeping the broader uptrend intact but on notice heading into Friday's session.
Market State Indicator (MSI) Forecast
Current Market State Overview:
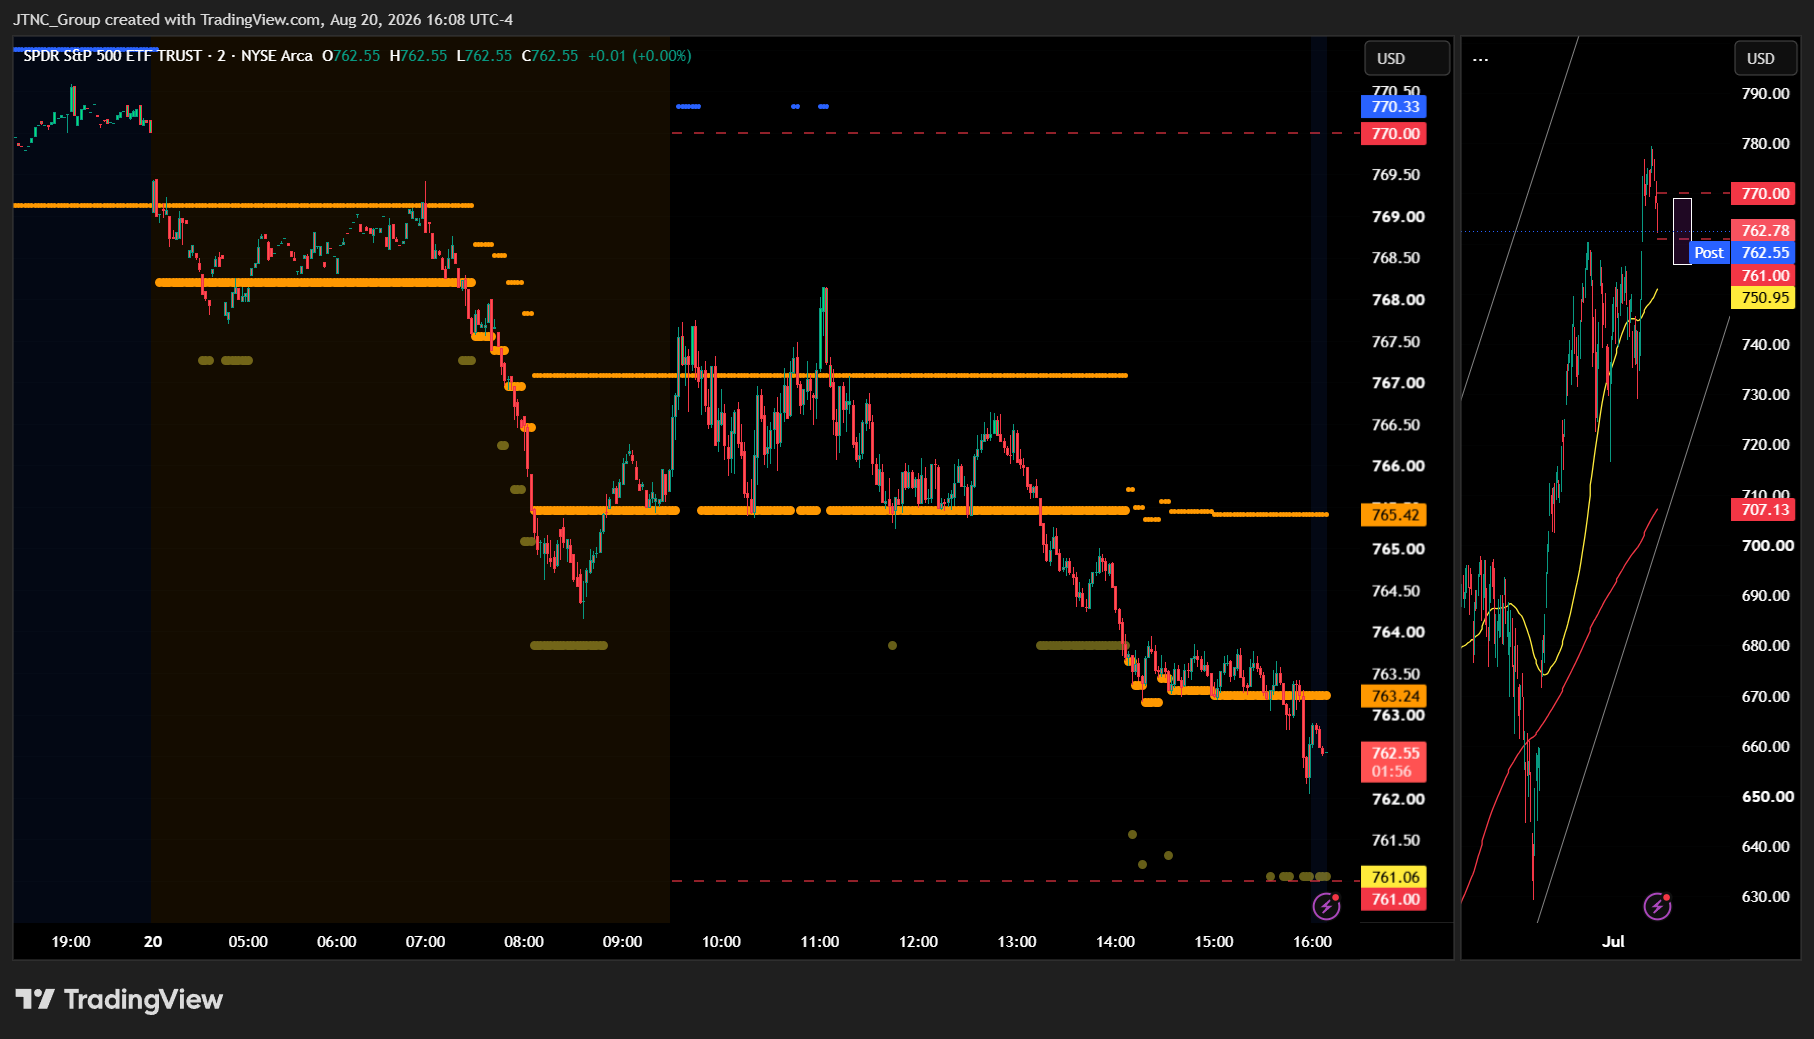
The MSI ended in a Bearish Trending Market State with SPY closing at $762.78. SPY closed below MSI support, which means that $763.24 level now flips to resistance heading into Friday, with $765.42 serving as the next layer of resistance above. Extended targets were not printing at the close, though they were visible in premarket and printed below during both the AM and PM sessions. The session itself was a steady, grinding decline as the MSI rescaled progressively lower throughout the day, moving from the 768-769 range at the open all the way down to the 761-763 range by the close. Unlike a choppy or indecisive session, this was a clean directional move with the Bearish Trending state holding from premarket through the entire regular session without interruption. The moderate $2.18 spread at the close reflects a market with genuine directional conviction on the bear side, not a market coiling for a reversal. With SPY closing beneath MSI support and extended targets having printed below during the session, the structure heading into Friday remains bearish, though the absence of extended targets at the close does suggest the downside may be measured rather than aggressive. The MSI is forecasting a slow grind lower for Friday, though without extended targets at the close the downside may be limited and is likely to find support at key levels below. MSI support is $763.24 with resistance at $765.42.
Key Levels and Market Movements:
Wednesday we stated, "Bears want to see $769.14 cap any rally and MSI support at $768.2 fail, which would expose SPY to a retest of Wednesday's low and deeper levels beneath the day's range," and added, "The most actionable setup in a narrow Bearish Trending MSI without extended targets is to sell rallies to MSI resistance at $769.14 if the Bearish Trending state persists and extended targets are not printing above, targeting premarket levels below as the primary downside reference," while also noting, "Do not anticipate the direction — let the MSI confirm its state before committing to either side." That framework set the table precisely for Thursday's session, and the bears delivered on nearly every condition laid out.
The MSI rescaled lower overnight and remained in a narrow Bearish Trending state, keeping prices contained right up until the open. When SPY opened at $765.96 and attempted to recover, it ran directly into MSI resistance and failed. That rejection happened not once but several times as prices tested the overhead level and were turned away, each attempt giving traders a clean opportunity to get short and ride the move down to MSI support. Extended targets printed below during both the AM and PM sessions, providing additional confirmation that the bears were firmly in control and adding fuel to the downside pressure. As the MSI rescaled progressively lower throughout the day, traders who held runners into the afternoon were rewarded as SPY pressed deeper and the session grind continued without any meaningful relief rally to speak of. SPY opened at $765.96, traded a high of $768.15, a low of $762.05, and closed at $762.78, down 0.82% on volume of 40.13 million shares, which came in near average. The VIX rose 7.52% to 16.01, confirming the pickup in anxiety that accompanied the day's steady decline. The primary trade setup was selling rallies to MSI resistance each time the Bearish Trending state held and extended targets confirmed the move lower, targeting MSI support below as prices followed the progressively rescaling structure down. At minimum it was a 2-for-2 session for traders following the framework. It was an easy day to read and execute with substantial setups, all identified through proper context, patience, and flexibility while leveraging the MSI, premarket levels, and market structure rather than forcing trades. The MSI continues to prove its reliability as the cornerstone of our trading process.
Trading Strategy Based on MSI:
Friday has light economic news so the market is likely to grind lower given the Bearish Trending at the close, though the move may be modest. The MSI is closing in a moderate Bearish Trending state with a $2.18 spread, and with SPY now sitting below former MSI support, that $763.24 level has flipped to resistance. Bears have the structural edge heading into Friday's OPEX session, and overnight expect a test of that resistance level. With extended targets having printed below during Thursday's session, the path of least resistance remains lower, though the absence of extended targets at the close does take some of the urgency out of the move. Friday is an OPEX session and that brings its own volatility as positioning gets unwound and the MSI is likely to rescale more aggressively than a typical Friday. Traders should be ready for sharp moves in either direction, even within an overall bearish structure.
Given the Bearish Trending close with SPY beneath former support, any rally into $763.24 should be treated as a potential shorting opportunity as long as the Bearish Trending state persists and extended targets are not printing above. If the MSI rescales overnight and extended targets appear below before the open, that further strengthens the case for selling any pop toward resistance. On the other side, if the MSI rescales overnight into a higher state and SPY reclaims $763.24 with conviction, that would begin to shift the balance back toward the bulls and a push toward $765.42 and potentially higher would become the more actionable setup. Bulls want to see overnight price hold current levels and the MSI rescale into a Bullish Trending state, opening the door to reclaiming $763.24 and targeting $765.42 above. Bears want to see $763.24 cap any overnight rally and SPY press toward lower levels beneath Thursday's session range, particularly if extended targets print below at the open.
The most actionable setup in a moderate Bearish Trending MSI without extended targets at the close is to sell rallies to $763.24 if the Bearish Trending state persists and extended targets are not printing above, targeting premarket levels below as the primary downside reference since SPY has now closed beneath the MSI range. If the MSI rescales overnight into a Bullish Trending state and reclaims $763.24 with conviction, buying dips toward that level and targeting $765.42 and higher becomes the preferred approach. A Ranging state at the open is also possible on OPEX, and in that environment the highest-probability plays remain failed breakouts above $763.24 and failed breakdowns below Thursday's low at $762.05. Do not anticipate the direction — let the MSI confirm its state before committing to either side.
The long-term bull trend remains intact above $640 and failed breakouts and failed breakdowns continue to offer the highest-probability setups. Remain flexible, avoid trading during Ranging Market States unless a clear failed breakout or breakdown presents itself, and ensure all trades are fully aligned with MSI signals. Providing real-time insights into market control, momentum shifts, and actionable levels, the MSI when integrated with our Pre-Market and Post-Market Reports continues to sharpen execution precision and elevate trade quality. If you haven't yet integrated MSI and our model levels into your process, now is the time. Contact your representative to get started as these tools are designed to support consistency and enhance performance.
Dealer Positioning Analysis
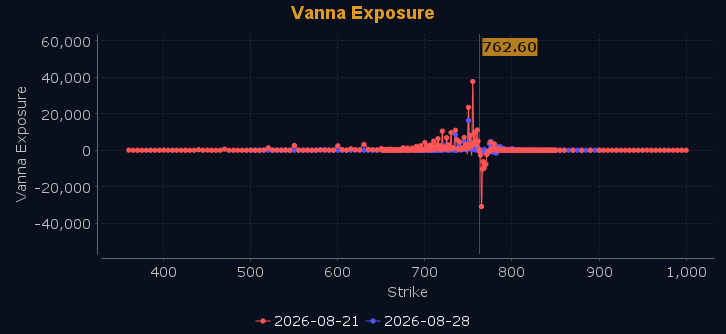
Dealers are selling SPY $768 to $786 and higher strike Calls while buying $763 to $767 Calls, indicating the Dealers' desire to participate in any relief rally on Friday. The ceiling for Friday appears to be $775. Notably, Dealers are not selling any ATM Puts, telling us they have no defined floor in the market for Friday. To the downside, Dealers are buying $762 to $705 and lower strike Puts in a 4:1 ratio to the Calls they're selling, displaying heightened concern that prices could move lower. Dealers have increased their hedges, implying they are less confident prices may rally from current levels. Below $761 is bearish and above $770 is bullish with everything in between expected to be choppy and trap filled. Should SPY fail to hold $770, support from $760 to $770 has thinned and lower prices are likely absent an external catalyst. Above $770 there is little resistance, so any rally may generate meaningful gains. Dealer positioning is unchanged at bearish.
Looking Ahead to Next Friday:
Dealers are selling SPY $771 to $795 and higher strike Calls while buying $763 to $770 Calls, indicating the Dealers' desire to participate in any rally next week. The ceiling for next week appears to be $776. Dealers are not selling any ATM Puts, telling us they have no defined floor heading into the end of next week. To the downside, Dealers are buying $762 to $655 and lower strike Puts in a 4:1 ratio to the Calls they're selling, displaying heightened concern that prices could move lower should support give way. Notably, Dealers have not added to their hedges, implying they continue to believe dips are buying opportunities. Remain bullish above $772, but below $767 the posture shifts bearish with chop in between. For the week Dealer positioning is unchanged at bearish. We advise reviewing Dealer positioning daily for directional clues. These positions evolve quickly and tracking them is essential for staying ahead of shifting market sentiment.
Recommendation for Traders
With SPY closing at $762.78 and VIX surging 7.52% to 16.01, the tape favors caution. Look for longs only on a reclaim of $765, targeting $768. Shorts on a break below $762, with stops tight above $764.
With broad selling across all major indices, keep position sizing conservative. Review the premarket analysis posted before 9 AM ET for any changes in the model's outlook and Dealer Positioning.
Good luck and good trading!
