
Market Insights: Tuesday, August 18th, 2026
Market Overview
US stocks fell again on Tuesday, with tech leading the way down as elevated oil prices and rising bond yields continued to weigh on sentiment. The Nasdaq dropped 1.3%, the S&P 500 slid 0.6%, and the Dow edged lower by 0.2%, extending Monday's losses into a second straight session of selling.
Oil pushed even higher after Trump doubled down on threats to bomb Oman if it interferes with US plans for the Strait of Hormuz, sending Brent crude near $91 per barrel and WTI to $84 per barrel. The US Strategic Petroleum Reserve falling to its lowest level since 1982 added fuel to the move. Meanwhile, the 10-year Treasury yield eased slightly but held at 4.70%, and the 30-year yield stayed near a 19-year high as a combination of AI-driven borrowing, rising oil, and government debt concerns kept global bond markets on edge. On the earnings front, Home Depot posted improved second-quarter sales as customers stuck to smaller projects, while Klarna stock got hit hard after trimming its outlook.
SPY Performance
SPY opened at $768.70 and never gave bulls much to work with. The high of $769.50 came early and faded fast, with any attempt at upside momentum getting quickly swatted down. From there, price drifted lower throughout the session, carving out a low of $766.92 before settling at $767.36 — well off the highs and closer to the bottom of the day's range. That's a $2.58 spread from low to high, a tight and listless range that reflects a market with no real conviction in either direction — though what little conviction existed clearly leaned bearish.
SPY finished down 0.69% on the day, making this the third consecutive session of declining closes. Volume came in at 35.50 million shares, below average, but still a step up from the prior session's pace — meaning the selling wasn't entirely passive. The VIX climbed another 3.42% to close at 15.71, continuing its steady march higher. That's now back-to-back sessions of rising fear alongside falling prices, and that combination is exactly what tends to shake loose the weaker hands. Bulls have had multiple chances to defend key levels and keep coming up empty. Until there's a session where SPY holds a low, bounces with purpose, and closes near the top of its range, the path of least resistance remains lower.
Major Indices Performance
The Nasdaq led the losses today, falling 1.33%, and it wasn't hard to see why. When Meta is getting hammered like it was, the tech-heavy index absorbs that pain fast. The selling wasn't isolated to one pocket of the market either — it spread broadly across growth names, leaving the Nasdaq without the kind of defensive rotation that might have cushioned the blow. This was a notably sharper drop than yesterday's modest slip, and it signals that momentum traders are not in a forgiving mood right now.
The Russell 2000 wasn't far behind, shedding 1.18% in a session that erased what little optimism small-cap bulls had built up. Small-caps tend to be more sensitive to economic uncertainty, and with the macro environment still carrying plenty of unresolved pressure, there wasn't much of a case for bargain hunters to step in aggressively. The Russell's decline keeps it in a frustrating position — unable to sustain any meaningful rally before sellers reassert control.
The Dow held up the best of the three, dropping just 0.22%, which in the context of today's broader weakness actually qualifies as relative outperformance. Blue-chip names with stable earnings and dividend support gave the Dow a modest buffer that the growth-heavy indices simply didn't have access to. The S&P 500 came in at -0.69%, slotting neatly between the Dow's resilience and the Nasdaq's heavier damage. Across the board, the story was red — just a question of how deep — and the day belonged to the sellers without much debate.
Notable Stock Movements
Meta once again found itself at the center of the storm, this time posting an even sharper decline of -4.45% to lead the Magnificent Seven lower. That's a brutal move for a mega-cap name in a single session, and when a company of Meta's size drops that aggressively, it doesn't just hurt its own shareholders — it poisons the well for the entire group. A loss that steep from one of the most heavily weighted names in the market sends a message to the tape, and today that message was decidedly bearish.
The Magnificent Seven had a mostly red session overall, with Apple, Microsoft, and Alphabet managing to finish in the green but unable to offset the damage done by Meta and the rest of the cohort's losing names. Three green finishes out of seven sounds like progress on paper, but when the biggest mover in the group is dropping nearly four and a half percent, the green names are essentially just noise. The group's overall tone was negative, and the pattern of inconsistency that has defined this cohort over recent sessions showed no signs of breaking.
What's particularly concerning is that this weakness didn't happen in isolation. The Nasdaq dropped -1.33% on the day, and mega-cap tech was a clear contributor to that pressure rather than a source of stability. There was nowhere to hide in this group if you were looking for the Magnificent Seven to act as a market anchor. Until Meta stops leading this cohort lower and the green finishes become more than a minority outcome, it's hard to build a bullish case for the group carrying the broader market higher in the near term.
Commodity and Cryptocurrency Updates
Crude oil slipped 0.47% to settle at $84.10, but make no mistake — at these levels, energy remains a significant wildcard for markets and policymakers alike. Crude has rallied well above $70 and is holding firm in the mid-$80s, defying longer-term expectations and keeping inflationary pressure alive. Supply dynamics and global demand continue to underpin the move, and as long as crude stays entrenched at these prices, the Fed's job gets that much harder. A sustained run here isn't something central bankers can look past.
Gold pulled back modestly, dropping 0.43% to close at $4,399. After the remarkable run that pushed the metal to fresh highs in recent sessions, a small breather is hardly alarming. The structural drivers — central bank demand, macro uncertainty, and lingering inflation concerns — haven't gone anywhere, and buyers have shown a consistent willingness to step in on any weakness. Nothing about today's dip changes the broader bull case for gold.
Bitcoin essentially flatlined, gaining just 0.08% to close just above $64,556. After the bounce in the prior session, today's near-standstill reflects a market that's consolidating rather than committing to a directional move. Demand has remained steady enough to keep prices supported, and the lack of selling pressure is actually a constructive sign. The crypto market continues to hold its range, and the tone remains broadly positive even on a session where almost nothing happened.
Treasury Yield Information
The 10-year Treasury yield finally gave back a little ground today, slipping 0.38% to close at 4.710%. It's a modest pullback, and after two straight sessions of climbing pressure, bulls will take any relief they can get — but let's not read too much into a single down day. The direction is mildly encouraging, but the yield is still firmly planted in uncomfortable territory, and one small retreat doesn't change the broader picture.
At 4.710%, the yield remains 21 basis points above the 4.5% threshold where equities begin to feel real strain, and just 9 basis points away from the 4.8% level where this framework calls for accelerating selling pressure. That gap is essentially unchanged from where things stood yesterday, which means the cushion is still razor-thin. Today's dip offered a brief exhale, but the wall is still right there. A single hawkish data point — an inflation surprise, a hot jobs number, or a poorly received auction — could erase today's move and push right back toward that critical 4.8% line.
What matters now is whether this pullback has any follow-through. A yield that dips slightly and immediately resumes its climb is just noise. For equity investors to feel genuinely relieved, the 10-year needs to show it can trend back toward and eventually below 4.5% with conviction. Until that happens, the headwind hasn't been removed — it's just paused. The 4.8% level stays the key line to watch in the near term, with 5% representing a meaningfully more difficult environment for stocks and 5.2% being the threshold where a 20%-plus correction enters the conversation. Today bought a little breathing room. What the market does with it is what matters next.
Previous Day’s Forecast Analysis
Yesterday's forecast called for SPY to trade within a defined range of $772 on the downside and $782 as the max upside target, with Monday's close at $772.66 sitting right at the bottom of that window. The model flagged that positioning as a structural edge for bears, and the bias heading into Tuesday was clearly bearish. The VIX climbing 6.46% to 15.17 was cited as confirmation that the market was beginning to price in real caution, and traders were advised to trim position sizing to the 75-85% range while keeping stop-losses tight in the 1.0-1.25% band from entry.
On the levels, $778 was identified as the defining ceiling bulls needed to reclaim to keep any recovery attempt alive, with $780 serving as the heaviest overhead resistance and $782 capping the expected move entirely. To the downside, $776 was the first line of defense, $775 the most critical battleground of the session, and $773 the last stand for bulls before $772 came into play. The forecast was direct — those two zones around $775 and $778 would decide the day's direction.
The trading strategy leaned short, with a break below the session low of $772.51 triggering a short entry targeting the $769-770 zone, and stops above $775. A secondary target of $765-766 was outlined for traders using a trailing stop on continued downside follow-through. On the long side, bulls needed to reclaim $775 cleanly first, with $776.78 as the initial resistance hurdle and $779-780 as the primary upside target on a confirmed bounce. The overall message was disciplined — let price confirm before sizing in, and respect the shift in volatility tone rather than fading it.
Market Performance vs. Forecast
Tuesday's session opened at $768.70, a full four points below Monday's close of $772.66 and well beneath the projected range floor of $772 — an immediate signal that external catalysts were driving price action beyond the model's base case scenario. The gap-down open took the falling market scenario's short entry trigger at $772.51 and blew straight through it before the opening bell, with price never once testing the key battleground levels of $775 or $773 that the framework had identified as the defining decision points for the session. That kind of directional displacement below a projected range reflects the kind of overnight development the model does not account for — unpredictable external events can introduce volatility that exceeds the framework's defined parameters, and Tuesday's tape was a clear example of that dynamic.
What the framework did get right was the directional bias. The forecast leaned clearly bearish, flagged sellers as holding the structural edge, and explicitly warned that a clean break of $773 left little cushion below — Tuesday validated every element of that read. Price never threatened the $778 ceiling, never forced bulls to defend $776, and never gave the rising market scenario any oxygen. The model's bearish structural lean proved entirely correct in direction, even as the magnitude of the move exceeded the projected range. Risk management protocols protected capital for traders who had stops placed above $775 per the falling market scenario's specifications, as the gap-down open would have triggered clean exits before additional downside developed. The VIX pushing another 3.42% higher to 15.71 continued the trend the framework had flagged Monday — fear is building in an orderly but persistent way, and the recommendation to keep position sizing trimmed and stops tight continues to prove its value. The framework's level architecture remains sound, and as the model recalibrates for Wednesday, the trend structure and VIX trajectory provide sharper context for what the next session's tape is likely to bring.
Premarket Analysis Summary
The premarket analysis posted at market open identified SPY spot at $769.60 in a put-dominated tape, sharply lower after Monday's failed push into $778 and a weak back half of that session. The expected move had widened to six points, signaling participants were bracing for larger swings. The defining level of the day was $770 — flagged as the most critical pivot with spot sitting right on it. Upside targets were set at $773, $775, $776, and $777, with $773 carrying the heaviest concentration above and $775 marking the expected move top. On the downside, $769 was the first level to watch sitting right beneath spot, $768 was identified as the most important level below with the heaviest battle expected there, $766 was flagged as the point of last hope and the floor holding the move together, and $764 stood as max downside. The analysis warned this was a fragile setup with no real shelf underneath until $766, and that the first clean break would decide the day.
The actual session validated that cautious tone entirely. SPY opened at $768.70, already below the $769 first downside level and having never reclaimed the $770 defining level — meaning sellers owned the session from the first tick. The high of $769.50 briefly tested the $769 area but never threatened anything above it, and the downside levels came into play quickly. Price dropped to a low of $766.92, essentially tagging the point of last hope at $766 before finding a short-lived floor. The close at $767.36 locked in a loss of 0.69% and settled price well inside the lower half of the expected move range. Volume came in at 35.50 million shares, below average for the size of the move. The VIX climbing 3.42% to 15.71 confirmed the risk-off tone and added further pressure to an already defensive tape.
Validation of the Analysis
Tuesday's session validated the premarket framework with striking precision, as SPY's behavior from the opening print straight through the close played out almost exactly within the roadmap drawn before the bell. The analysis flagged 770 as the defining level of the day and was explicit that failing to reclaim it handed the session to sellers — SPY opened at $768.70, already beneath 770, and that single data point told the whole story before the first trade was even made. The premarket warned that losing 769 cleanly gave sellers control, and with the open printing right through that level, the bear case was activated immediately.
The downside targets then did exactly what they were designed to do. The analysis identified 768 as the most important level below and the heaviest battle zone, warning that a clean break could get ugly fast — and that's precisely the sequence that followed. Price stalled near the high of $769.50, which tested the underside of the 769 level the analysis had flagged, then rolled over as sellers reasserted. The low of $766.92 reached directly into the 766 zone the premarket called the point of last hope and the floor holding the move together. Price found its footing right there, just as the framework suggested it would, and the close at $767.36 settled in the zone between 766 and 768 — entirely inside the defined downside territory. Traders who marked 769 as their short trigger at the open and 768 as confirmation had a clean, well-mapped trade with 766 as the logical target, and the session delivered all of it. With the VIX surging 3.42% to 15.71 adding confirmation of real selling pressure, the premarket analysis demonstrated exactly the kind of value that separates disciplined level-based trading from guesswork.
Looking Ahead
Wednesday brings the main event of the week with the release of the FOMC Meeting Minutes, and the market is going to be paying close attention. These minutes give traders a detailed look inside the Fed's thinking — tone, debate, and any dissent around the rate path — and right now, any Fed-related language carries extra weight. The big question heading in is whether the committee sounds more cautious about cutting or whether there's growing consensus that conditions are improving enough to justify a move. Either read will move markets, so expect volatility around the release.
Going into Wednesday's session, the setup you built on Tuesday matters. The way price behaved and where it settled gives you the baseline for how the market is positioned heading into a Fed catalyst. If the Minutes come across as more hawkish than expected, don't be surprised to see pressure across equities and rate-sensitive sectors. If the tone leans dovish, you could get a meaningful relief rally. Have your levels ready, know your risk, and don't get caught flat-footed — the Minutes have a way of moving fast and reversing faster as traders work through the details in real time.
Market Sentiment and Key Levels
The directional bias today leans bearish, with sellers maintaining the upper hand after SPY opened near session highs and spent the rest of the day grinding lower, closing well off the $769.50 peak. The -0.69% decline on below-average volume of 35.50 million shares reflects a market where buyers simply aren't showing up with enough conviction to push back against the selling pressure. The Nasdaq's -1.33% drop is the loudest signal in the room today — when tech gets hit that hard, it pulls the broader market's mood with it, and the Russell 2000's -1.18% confirms the weakness wasn't isolated to a single corner of the tape. The VIX rising 3.42% to 15.71 is worth noting carefully — while that's still not a fear-driven reading by historical standards, it's the continuation of a creeping bid in volatility that suggests the options market is quietly building in more downside hedging.
Key resistance now sits at $769.50, the session high that was essentially tagged at the open and never revisited — a textbook example of an opening fade that leaves overhead supply firmly in place. A sustained push back above that level on volume that returns to at least average would be the minimum requirement to shift the short-term narrative back toward neutral. On the support side, $766.92 — today's intraday low — is the immediate line in the sand. A clean breakdown below that print on expanding volume would open the door toward the $764 to $765 area, and from there the $760 zone becomes the next meaningful floor. The macro backdrop isn't giving the bulls much ammunition either — yields remain elevated above the 4.5% threshold that historically creates headwinds for equities, and crude oil holding near $84.10 keeps the inflation conversation alive. Bitcoin's essentially flat finish at above $64,556 offers no real risk-on spark. Until SPY can reclaim resistance with purpose and volume, the bears remain in control of the short-term tape.
Expected Price Action
Wednesday's session brings actionable intelligence generated by our AI model, with SPY projected to trade within a range defined by $764 on the downside and $777 as the max upside target. That thirteen-point window sits just below the trending threshold, but it's wide enough to expect purposeful directional movement rather than lazy chop — this is not a setup for rangebound drift. With Tuesday's close at $767.36 sitting in the lower third of the projected range, bears hold a structural edge heading into Wednesday, and VIX climbing 3.42% to 15.71 signals that uncertainty is still building beneath the surface.
The $770 level is the defining line in the sand — it's the most important pivot of the session and the level that separates two very different outcomes. Reclaim and hold $770 cleanly and the first real target above is $773, where the heaviest overhead concentration sits and price should want to stall. Above $773, $775 caps the top of the expected move, with $776 and $777 representing max upside territory that bulls would need a strong catalyst to reach. On the downside, $769 is the first level to defend and sits just beneath Tuesday's close — sellers pushing through there early hands the session to the bears without much of a fight. Below $769, $768 becomes the most critical battleground and where the heaviest support battle should occur. A clean break of $768 could accelerate losses quickly, with $766 serving as the point of last hope and the floor holding this setup together. Losing $766 opens $764 as max downside at the bottom of the expected move. Bias leans clearly bearish given where Tuesday's close landed within the projected range, but the key test is whether buyers can push back through $769 and reclaim $770, or whether sellers crack $768 early and force a fast move toward $766. Those two levels decide Wednesday's direction.
Trading Strategy
The VIX rising 3.42% to 15.71 continues the creeping anxiety that's been building in the market, and traders should take note. At 15.71, volatility is still not screaming danger, but it has now pushed meaningfully higher on back-to-back sessions, which tells you the mood is souring. This kind of steady VIX expansion on relatively subdued volume is often more telling than a single spike — it suggests sellers are in control without needing to panic. Keep position sizing in the 75-85% range and hold stop-losses tight in the 1.0-1.25% band from entry. Respect the trend in fear, not just the level.
In a falling market scenario, the critical level to watch is $766.92, yesterday's session low. A clean breakdown below that level on any fresh wave of selling pressure opens a short entry targeting the $764-765 zone, with stops placed above $769.50 to keep risk defined. If sellers push through $764 with conviction, the next meaningful support cluster sits around $761-762, which becomes the secondary profit target for traders running a trailing stop. With the VIX at 15.71 and still trending higher across consecutive sessions, short setups have a bit more favorable wind at their back than they did earlier this week — but don't press into support blindly. Cover into those zones, let the level prove itself, and avoid chasing momentum without confirmation.
In a rising market scenario, bulls need to reclaim $769.50 — the session high — and hold it before pressing any long position. A firm bounce off $767-768 with visible buying participation is the preferred entry, using $769.50 as the first resistance target to clear. A convincing push through that level opens $772-773 as the primary profit target, with $775 serving as the stretch goal on strong continuation. Stops on longs belong below $766 to protect against a deeper flush. The VIX at 15.71 is still below levels that historically derail rallies entirely, so if buyers show up with real conviction, a recovery bounce is absolutely tradeable — just wait for price to confirm before committing size.
Model’s Projected Range
SPY's projected maximum range for Wednesday is $762 to $773, with the Put side dominating in an expanding band that suggests trending price action with intermittent chop. Wednesday brings FOMC Meeting Minutes, which are likely to produce significant volatility particularly in the first hour of trading. SPY closed at $767.36, down 0.69%, with the session opening at $768.70, tagging a high of $769.50, and pulling back to a low of $766.92 before settling near the bottom of the day's range on below-average volume — a mild but controlled selloff. SPY is trading near our model's first support at $765, and the market continues to digest a backdrop of cautious Fed commentary as traders position ahead of the minutes release. If price can reclaim and break above our model's first resistance at $770, the next target moves up to $773, but if $765 gives way, the tape likely slides toward $762 next. Should $762 fail to hold, there is little to keep price from falling toward $760. The long-term bull trend remains intact above $640 with SPY well above structural support. As long as price holds above key structural levels, this remains a broader dip-buying environment. Absent a catalyst, resistance sits at $770, $773, $774, $775, while support rests at $765, $762, $760, $755. Given the close at $767.36 — sitting between first support and first resistance — we favor buying dips near $765 rather than chasing into strength. On the leadership front, Bitcoin was essentially flat, up just 0.08% closing above $64,556, while MAG stocks were mostly red led by Meta down 4.45%, with Apple bucking the trend as the lone bright spot up 1.45% — sustained weakness across both leadership groups would be required to signal a deeper pullback. The VIX closed at 15.71, up 3.42%, suggesting elevated fear heading into the FOMC minutes with traders hedging ahead of any hawkish surprise. SPY closed just above the lower line of the trend channel, with structural support nearby keeping the broader uptrend technically intact for now.
Market State Indicator (MSI) Forecast
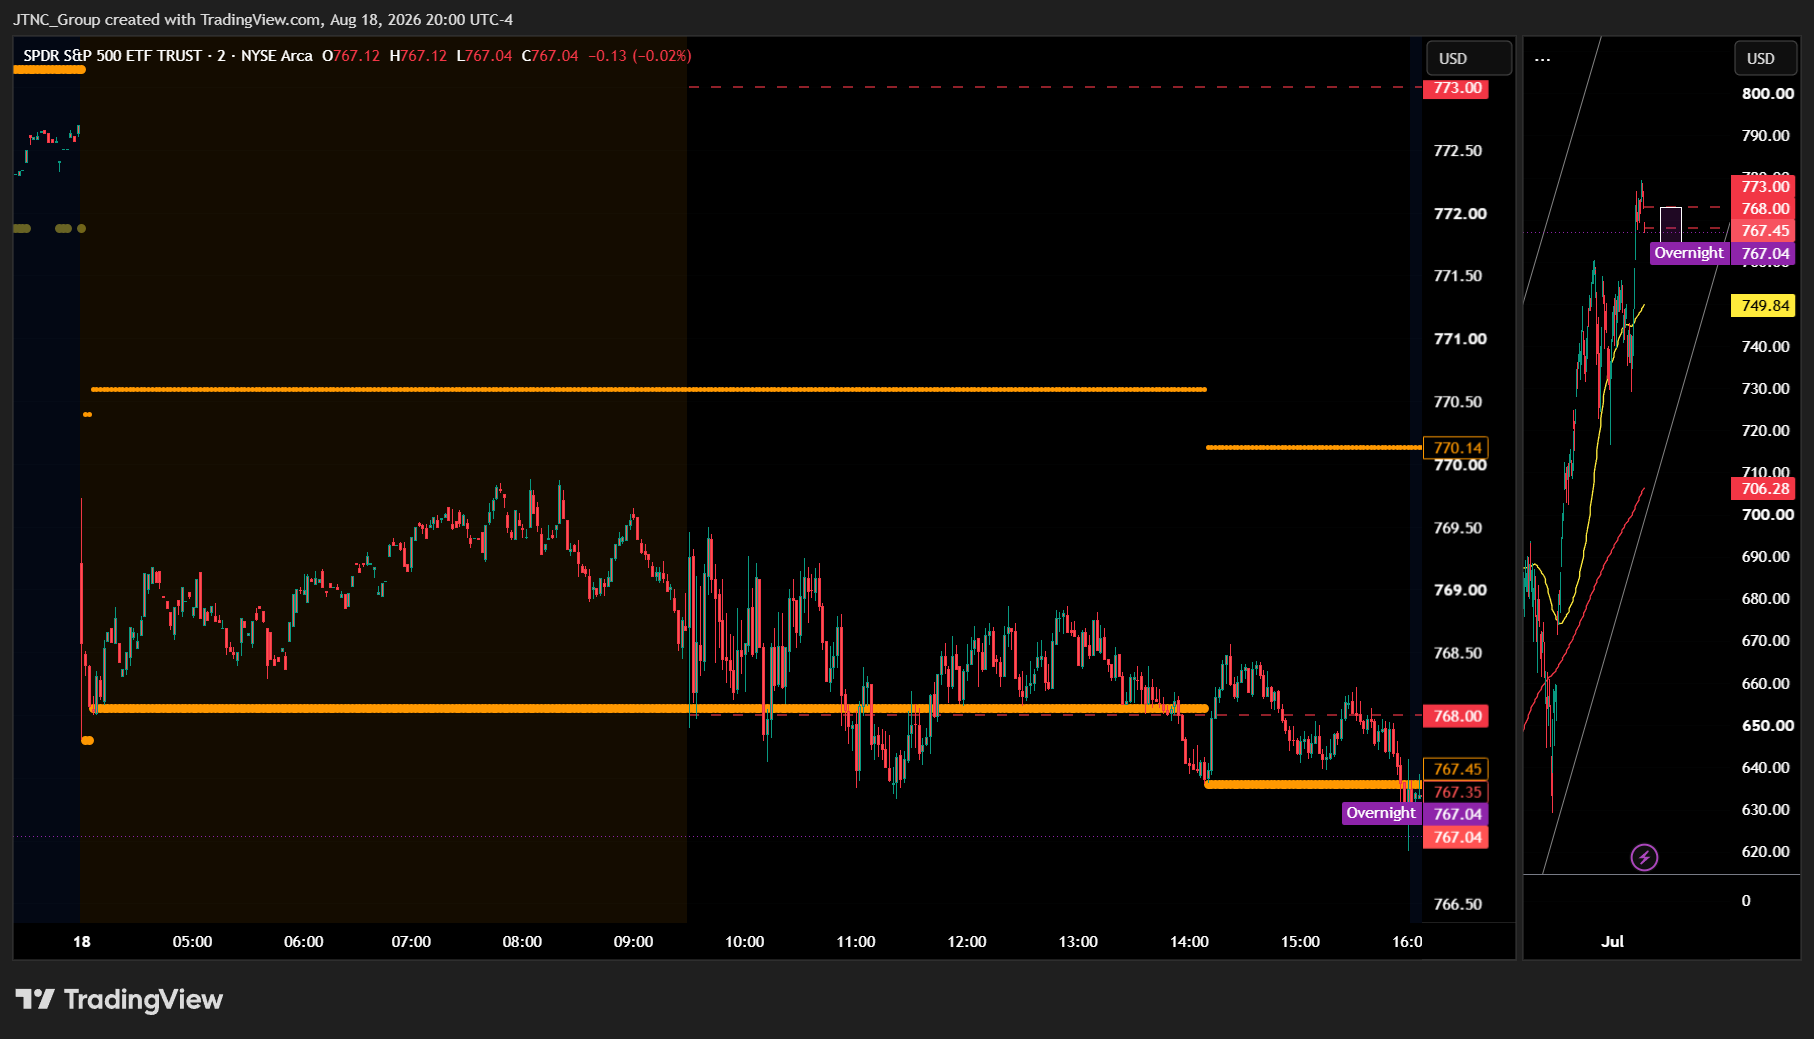
Current Market State Overview:
The MSI ended in a Bearish Trending Market State with SPY closing at $767.36. Since SPY closed below MSI support, that former support level at $767.45 now becomes resistance heading into Wednesday, with the prior MSI resistance at $770.14 serving as the upper resistance level above. Extended targets were not printing at the close, though they were visible below during premarket. The MSI rescaled lower overnight into a wide Bearish Trending state that remained in place for most of the session. From there, price largely sat on MSI support through the AM session and into the PM session, grinding sideways in an exceptionally tight range of less than $2 all day. It was only late in the PM session that the MSI rescaled lower again and SPY finally broke out of that narrow consolidation zone and moved lower with conviction. The moderate $2.69 spread at the close reflects a market that has picked a direction but lacks the momentum to drive it aggressively. Without extended targets printing at the close, the MSI is forecasting a slow grind lower for Wednesday, though the downside may be limited and is likely to find support at key levels below. MSI support is $767.45 with resistance at $770.14.
Key Levels and Market Movements:
Monday we stated, "Bulls want to see overnight price hold current levels and the MSI rescale higher with extended targets printing above," and added, "Bears want to see $773.15 cap any rally and the MSI rescale lower with extended targets printing below. If that occurs, SPY is likely to retest Monday's low at $772.51 and press toward lower levels beneath the session range," while also noting, "Do not anticipate the direction — let the MSI confirm its state before committing to either side." That framework delivered the answer clearly on Tuesday, and the bears were firmly in control of the narrative even if they had to wait most of the day to fully cash in on it.
The MSI opened with a wide Bearish Trending state overnight and kept that posture through the bulk of the session. Extended targets were visible below in premarket, offering an early signal that downside pressure was present, but what followed during regular trading hours was one of the more frustrating sessions of the summer. SPY settled right onto MSI support and simply refused to move in a meaningful way for most of the day. The range held under $2 through the AM session and deep into the PM session, making clean entries and clean exits exceptionally difficult to execute with confidence. It was not until late in the PM session that the MSI finally rescaled lower, breaking SPY out of that suffocating range and allowing price to make its real move of the day. That late rescaling provided the primary trade setup of the session — selling the rally to MSI support-turned-resistance as SPY sat below the range, targeting the premarket levels below since there was no MSI target beneath the current structure. SPY opened at $768.70, traded a high of $769.50, a low of $766.92, and closed at $767.36, down 0.69% on volume of 35.50 million shares, which came in below average. The VIX rose 3.42% to 15.71. At minimum it was a 1-for-1 session for traders following the framework. It was an easy day to read albeit not an easy day to trade given the tight choppy range. But substantial setups were present, all identified through proper context, patience, and flexibility while leveraging the MSI, premarket levels, and market structure rather than forcing trades. The MSI continues to prove its reliability as the cornerstone of our trading process.
Trading Strategy Based on MSI:
Wednesday has heavy economic data with FOMC Meeting Minutes which can introduce significant volatility, so traders should be ready to trade what they see rather than predict. The MSI is closing in a moderate Bearish Trending state and that gives the bears a structural edge heading into Wednesday, but the absence of extended targets at the close means the downside is likely to be measured rather than aggressive. A slow grind lower is the base case, though the move may be modest and is likely to encounter support at key levels below before any sustained continuation develops. Traders should be cautious about overcommitting in either direction ahead of the FOMC Minutes release, as that catalyst has the potential to shift the MSI state quickly and introduce a sharp move that rewrites the intraday narrative.
Given the moderate Bearish Trending close with no extended targets, Wednesday is likely to see continued pressure from the bears, but the lack of extended targets removes the fuel needed to drive a clean, sustained breakdown. Bears retain the edge, and since SPY closed below MSI support, that $767.45 level now acts as resistance. Any failure to reclaim $767.45 could see SPY press toward lower levels and retest Tuesday's low at $766.92 and potentially deeper levels below the session range. Conversely, if the FOMC Minutes provide a bullish catalyst or the MSI rescales overnight into a higher state, $767.45 and levels above quickly come back into play. Bulls want to see overnight price hold current levels and the MSI rescale higher with extended targets printing above. If that happens, the door opens for a push toward $767.45 and potentially higher toward $770.14 and above. Bears want to see $767.45 cap any rally and the MSI rescale lower with extended targets printing below. If that occurs, SPY is likely to press toward lower levels beneath Tuesday's session range.
The most actionable setup in a moderate Bearish Trending MSI without extended targets is to sell rallies to MSI resistance at $767.45 if the Bearish Trending state persists and extended targets are not printing above, targeting the premarket levels below since price is currently sitting beneath the MSI range. Alternatively, if the MSI rescales overnight into a bullish state and reclaims $767.45 with conviction, buying dips toward that level and targeting $770.14 and higher becomes the preferred approach. The FOMC Minutes have the potential to trigger a sharp rescaling in either direction, so be ready to adjust quickly if the MSI transitions state around that release. A Ranging state at the open is also possible, and in that environment the highest-probability plays remain failed breakouts above $767.45 and failed breakdowns below Tuesday's low. Do not anticipate the direction — let the MSI confirm its state before committing to either side.
The long-term bull trend remains intact above $640 and failed breakouts and failed breakdowns continue to offer the highest-probability setups. Remain flexible, avoid trading during Ranging Market States unless a clear failed breakout or breakdown presents itself, and ensure all trades are fully aligned with MSI signals. Providing real-time insights into market control, momentum shifts, and actionable levels, the MSI when integrated with our Pre-Market and Post-Market Reports continues to sharpen execution precision and elevate trade quality. If you haven't yet integrated MSI and our model levels into your process, now is the time. Contact your representative to get started as these tools are designed to support consistency and enhance performance.
Dealer Positioning Analysis
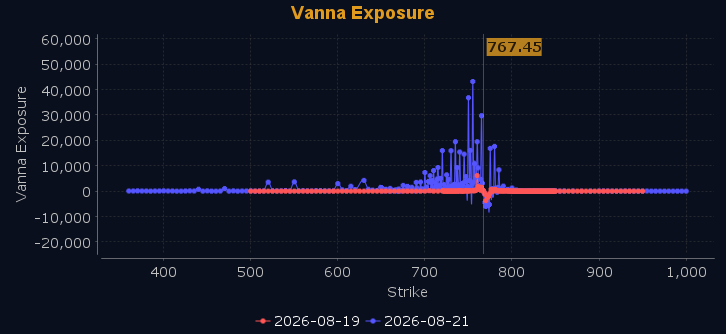
Dealers are selling SPY $776 to $788 and higher strike Calls while buying $768 to $775 Calls, indicating the Dealers' desire to participate in any relief rally on Wednesday. The ceiling for Wednesday appears to be $776. Notably, Dealers are not selling any ATM Puts, telling us they have no defined floor in the market for Wednesday. To the downside, Dealers are buying $767 to $705 and lower strike Puts in a 4:1 ratio to the Calls they're selling, displaying heightened concern that prices could move lower. Below $775 is bearish and above $776 is bullish. Should SPY fail to hold $770, the zone from $760 to $770 is well supported, which should keep prices from falling too much further absent an external catalyst. Dealer positioning is unchanged at bearish.
Looking Ahead to Next Friday:
Dealers are selling SPY $772 to $795 and higher strike Calls while buying $768 to $771 Calls, indicating the Dealers' desire to participate in any rally into next Friday. The ceiling for next week appears to be $780. Dealers are not selling any ATM Puts, telling us they have no defined floor heading into the end of the week. To the downside, Dealers are buying $767 to $655 and lower strike Puts in a 4:1 ratio to the Calls they're selling, displaying heightened concern that prices could move lower should support give way. Notably, Dealers have not added to their hedges in some time, implying they continue to believe dips are buying opportunities. Remain bullish above $769, but below $765 the posture shifts bearish with chop in between. For the week Dealer positioning is unchanged at bearish. We advise reviewing Dealer positioning daily for directional clues. These positions evolve quickly and tracking them is essential for staying ahead of shifting market sentiment.
Recommendation for Traders
With SPY closing at $767.36 and VIX rising 3.42% to 15.71, the bias remains cautious. Look for longs only on a reclaim of $769.50, with stops below $767. Below that, favor the short side toward $766. Don't chase strength into resistance — let price come to your levels.
Manage risk carefully given the continued volatility creep. Review the premarket analysis posted before 9 AM ET for any changes in the model's outlook and Dealer Positioning.
Good luck and good trading!
