
Market Insights: Monday, August 17th, 2026
Market Overview
US stocks slid Monday as a combination of rising oil prices and surging Treasury yields rattled investors. The Dow fell 0.5%, the S&P 500 dropped 0.5% — snapping its three-week winning streak — and the Nasdaq shed 0.3%. The selling picked up in the afternoon after an MOU between the US and Iran expired, with President Trump saying he doesn't see the war ending anytime soon and threatening to bomb Oman if it interferes with the Strait of Hormuz. Brent crude futures hit $90 per barrel on the headlines. Adding to the pressure, the 30-year Treasury yield jumped 5 basis points to 5.31%, its highest level since June 2007, as concerns about the national debt continued to tighten financial conditions.
With fewer market-moving data releases on the calendar, investors are watching a busy week of retail earnings for clues on consumer health heading into back-to-school season. Walmart, Target, Lowe's, and Home Depot all report quarterly results, and Wednesday's FOMC meeting minutes could shed more light on where Fed officials stand on future rate decisions.
SPY Performance
SPY opened at $776.18 and struggled to find its footing right from the start. The high of $776.78 came early and didn't last long, with buyers unable to push price anywhere meaningful before sellers took over. From there, the tape leaked steadily lower, tagging a session low of $772.51 before closing at $772.66 — just a few cents off the worst levels of the day. That's a range of $4.27 from low to high, and the close pinned near the bottom of that range tells you everything you need to know about who was in control. This is the kind of price action that makes bulls nervous — no meaningful bounce, no late-day recovery attempt, just steady, grinding pressure from open to close.
SPY finished down 0.47% on the session, extending the recent stretch of uninspiring tape. Unlike yesterday's quiet drift, today's selling came with a bit more conviction — volume clocked in at 30.03 million shares, still below average, but notably higher than the prior session's pace. More telling was the VIX, which jumped 6.46% to close at 15.17. That's a meaningful shift in tone. When SPY sells off and the fear gauge moves higher in lockstep, it's a signal that market participants are starting to take the weakness more seriously — this isn't just noise. Back-to-back days of declining closes with the VIX now pushing higher puts the pressure squarely on the bulls. They need to show up soon with real buying interest, or this pullback risks picking up momentum.
Major Indices Performance
The Dow was the weakest of the major indices today, dropping 0.51%, as blue-chip names had little to work with in a session defined by broad-based selling pressure. There was no meaningful catalyst to lift value-oriented names, and with the macro backdrop offering little comfort — yields still elevated above the 4.5% danger zone and energy prices surging — the Dow's composition left it exposed to the downside.
The Nasdaq slipped 0.32%, a modest decline on the surface but one that carried some weight given the heavy losses from the index's largest members. When mega-cap growth names are getting hit hard, the Nasdaq typically doesn't have anywhere to hide, and today was no exception. The index managed to avoid being the worst performer of the day, but that's faint praise in a session where momentum was clearly working against the bulls.
The Russell 2000 fell 0.38%, landing between the Dow and the Nasdaq in terms of damage. Small-caps had been showing some relative strength in recent sessions, but today that resilience faded as selling spread across market caps more evenly. Unlike yesterday's session where small-caps managed to defy the broader weakness, today there was no corner of the market that could claim a real win. The uniform red across all three indices tells a cleaner story than yesterday's divergence — this was a day where sellers were in control from open to close, with no meaningful rotation to offset the pressure.
Notable Stock Movements
Meta took the crown as the session's biggest loser among the Magnificent Seven, dropping a sharp -3.54% and dragging the group's overall tone decidedly into the red. That kind of move from one of the largest market cap companies in the world doesn't go unnoticed — it casts a shadow over the entire cohort and makes it difficult for the rest of the group to build any meaningful positive momentum. When Meta is selling off that hard, it tends to reflect something beyond routine profit-taking, and it reinforced the cautious sentiment already hanging over the broader tape.
The Magnificent Seven as a whole had a mostly red session, continuing what's shaping up to be an inconsistent stretch for the group. The cohort had shown flashes of leadership in recent sessions, but those efforts keep getting interrupted by days like this one where the heavyweights stumble and the recovery narrative gets reset. A mostly red showing across mega-cap tech, led by a -3.54% drop in Meta, is exactly the kind of session that erodes confidence in the group's ability to sustain a leadership role going forward.
What makes today's Magnificent Seven weakness particularly notable is that it came on a day when the broader market was already under pressure across all major indices. There was no rotation into smaller caps to soften the blow this time — the selling was fairly broad-based, and the mega-cap names offered no shelter. When the Magnificent Seven can't provide a buffer during a down tape, it raises legitimate questions about whether this group is positioned to lead any meaningful push higher. Until these names start stringing together more consistent green sessions, the market's leadership foundation remains on shaky ground.
Commodity and Cryptocurrency Updates
Crude oil surged 2.65% to settle at $84.58, pushing even further above the $70 level that already had energy markets commanding attention. At these prices, crude is firmly in territory that complicates the inflation narrative, and with no signs of a meaningful pullback, the pressure on policymakers only intensifies. Supply dynamics and global demand continue to support the rally, and a sustained run in the mid-$80s keeps energy costs as a persistent headwind on the path toward price stability. The Fed simply can't tune out crude when it's trading at these levels.
Gold extended its already impressive run, gaining 2.14% to close at $4,474. The metal continues to attract buyers on virtually every session, driven by central bank demand, macro uncertainty, and inflation concerns that refuse to fade. There's no structural sign of exhaustion here, and gold remains the market's go-to safe haven regardless of what's happening in equities or elsewhere. Buyers are clearly in control, and today's move reinforces that the bull case remains very much intact.
Bitcoin bounced back nicely, gaining 2.26% and closing just above $64,241. After the modest drift lower in the prior session, today's move higher suggests buyers were ready to step back in near those support levels. This kind of recovery is exactly what you'd expect from a market where demand has been consistent, and the rebound keeps Bitcoin well within the consolidation range that's been forming. Nothing about today's action changes the broader constructive tone around crypto.
Treasury Yield Information
The 10-year Treasury yield continued its climb today, adding another 0.60% to close at 4.720%. It's a smaller move than yesterday's 1.19% surge, but the direction remains the wrong one, and the cumulative effect is what matters here. Two consecutive days of rising yields puts the bond market in an increasingly uncomfortable position for equity investors, and there's no sign yet that the pressure is ready to reverse.
At 4.720%, the yield is now sitting 22 basis points above the 4.5% threshold where stocks begin to feel real strain — and just 8 basis points away from the 4.8% level where this framework calls for accelerating selling pressure. That's an uncomfortably thin margin, and it's getting thinner by the session. A single bad inflation reading, a poorly received Treasury auction, or a Fed official striking a hawkish tone could be all it takes to close that gap. The bond market is not giving equity bulls much room to breathe right now.
What makes this two-day stretch worth watching closely is the persistence of the move. Yields aren't just spiking and pulling back — they're grinding higher with staying power, and that slow creep is arguably more dangerous than a one-day spike that quickly reverses. The 4.8% level remains the critical near-term line in the sand, and the market's relatively muted response to these yield moves shouldn't inspire overconfidence. Once 4.8% breaks convincingly, history under this framework suggests equities won't take it quietly. Beyond that, 5% is where conditions turn genuinely difficult, and 5.2% is where a 20%-plus correction becomes a real conversation. For now, the key is watching whether yields can find any reason to pull back — because until they do, this headwind isn't going anywhere.
Previous Day’s Forecast Analysis
Yesterday's forecast projected SPY trading within a range of $770 on the downside and $787 as the max upside target, a seventeen-point window wide enough to signal directional movement rather than sideways chop. With Friday's close at $776.32 sitting in the lower half of that range, the bias leaned bearish heading into Monday's session, though the VIX dropping 3.01% to 14.19 kept the outlook from turning outright pessimistic. The model flagged $780 as the key ceiling bulls needed to clear to sustain any upside push, with $781 and $782 as the next targets above that and $784 marking the top of the expected move before $787 max upside. On the downside, $778 was identified as the first line of defense, with $775 serving as the most critical battleground of the session and the level where the heaviest fight was expected. A clean break of $775 was seen as a potential accelerant lower, with $774 as the last real floor and $770 as max downside support where buyers were expected to step in with force.
The recommended trading strategy called for position sizing in the 80-90% range with stop-losses held in the 1.0-1.25% range from entry, with confirmation emphasized over anticipation. On the short side, a clean break below $775.43 was the trigger, targeting $772-773 with stops above $778, and a secondary target of $768-769 if sellers followed through with momentum. On the long side, bulls needed to reclaim $776.32 as an intraday base and push through $778.80 convincingly, with the cleaner entry on a shallow pullback toward $775-776 targeting $779-780 first and $782-783 on follow-through. Stops on longs were placed below $773. The low VIX environment reinforced patience and discipline on both sides, as quick reversals were flagged as a real risk at compressed volatility levels.
Market Performance vs. Forecast
Monday's session opened at $776.18, landing almost exactly on Friday's close of $776.32 and right in line with the model's identified base level for bulls to defend heading into the day. That opening alignment was precise — the forecast had flagged $776.32 as the intraday base bulls needed to reclaim and hold, and price opened there to the cent, confirming the model's structural read on where the session would begin its first test. The rising market scenario's shallow pullback entry toward $775-$776 was immediately in play, and the framework's defined architecture was directly relevant from the opening bell.
The session ultimately closed at $772.66, a decline of 0.47%, with the low reaching $772.51 — a move that pushed below the $773 stop level the framework had specified for long positions in the rising market scenario. That stop placement was deliberate, and risk management protocols protected capital as price broke beneath the key $773 floor. The forecast had correctly identified $778 as the immediate ceiling and $775 as the most critical battleground of the session — and sellers did push through $778 cleanly, handed the tape back to bears early, and forced exactly the confrontation at $775 the model had anticipated. The model does not account for unpredictable external catalysts, and Monday's selling pressure beyond that $773 floor reflects developments outside the base case scenario rather than a failure of the framework's level identification. The $780 ceiling the forecast designated for bulls never came into play, which was entirely consistent with the bearish structural lean the model had outlined given Friday's close sitting in the lower half of the projected range — the directional bias proved correct. The VIX rising 6.46% to 15.17 confirmed the shift in tone the model's caution about thin participation and disciplined sizing was designed to protect against. The framework's recommendation to keep sizing in the 80-90% range and hold stops in the 1.0-1.25% band from entry proved its value precisely on a session like this one — and that disciplined architecture continues to guide positioning as the model recalibrates for Tuesday's tape.
Premarket Analysis Summary
The premarket analysis posted at market open identified SPY spot at $777.17 in a call-dominated tape, holding most of Friday's ground and pressing just under the ceiling that had capped price into the weekly close. The expected move was five points, keeping projected ranges contained. The defining level of the day was $778 — flagged as the immediate ceiling bulls needed to clear to keep the trend intact, with $779, $780, $782, and $785 as upside targets beyond it, $780 carrying the heaviest interest above. On the downside, $776 was the first line of defense sitting right beneath spot, $775 was identified as the most important level below with the heaviest battle expected there, $773 was flagged as the point of last hope and the floor holding the move together, and $772 stood as max downside. The analysis noted this was the third consecutive session pressing the same ceiling — the kind of setup that tends to resolve — and warned that losing both $776 and $775 early would likely produce a fast trip lower.
The actual session played out decisively on the bearish side of that framework. SPY opened at $776.18, already below the $778 defining level and sitting right on top of the first downside defense at $776. Price never made any attempt at the upside targets, with the high of $776.78 barely clearing the open before sellers took over. The $776 and $775 levels that were flagged as stacked and dangerous gave way in sequence, and the flush the analysis warned about materialized — price dropped to a low of $772.51, essentially tagging the max downside level of $772. The close at $772.66 locked in a loss of 0.47% and settled price at the very bottom of the expected move range. Volume came in at 30.03 million shares, below average despite the directional move. The VIX surging 6.46% to 15.17 confirmed the risk-off tone and underscored the conviction behind the selling.
Validation of the Analysis
Monday's session validated the premarket framework from the opening print, with SPY tracking the downside roadmap almost step for step and delivering clean, tradeable moves at every level the analysis had flagged before the bell. SPY opened at $776.18, immediately below the critical 776 support the premarket identified as the first line separating a neutral tape from a seller-controlled session. That open itself was the signal — the analysis was explicit that losing 776 cleanly tips the week's open in the sellers' favor, and price never recovered above it. The week's tone was set within the first minutes.
From there, the premarket's warning about 775 did all the heavy lifting. The analysis called 775 the most important level below and the heaviest battle zone, stating that a clean break opens the door lower quickly. That's exactly what the session delivered. Once 775 gave way, sellers accelerated and SPY drove straight toward the lower end of the expected move range. The low of $772.51 tagged the 772 max downside level with remarkable precision — the analysis had mapped 772 as the bottom of the expected move, and price found its floor right there. The close at $772.66 settled just above that floor, entirely within the downside framework's defined territory. Traders who had 776 marked as their short trigger at the open got a textbook entry, with 775 as the first confirmation and 773 and 772 as clearly mapped targets the entire way down. The VIX surging 6.46% to 15.17 confirmed the urgency of the move and validated the premarket's read that three sessions pressing the same ceiling was a setup primed to resolve — and resolve it did, hard to the downside. The framework performed exactly as designed.
Looking Ahead
Tuesday's economic calendar is quiet, with no high-impact releases scheduled to shake things up. That keeps the session relatively clean for traders who want to fine-tune their positioning ahead of Wednesday's FOMC Meeting Minutes, which is shaping up to be the main event of the week. Without a data point forcing a reaction, Tuesday becomes more of a positioning day — you're watching how money flows and whether the market wants to extend any momentum or pull back ahead of a catalyst.
Use Tuesday's session to get your levels locked in and your thesis straight before the Minutes drop Wednesday. The market has been sensitive to any Fed-related language lately, and traders will be dissecting every word for clues on the rate path. A quiet Tuesday tape that still shows directional conviction — either buyers defending key levels or sellers pressing — can be just as informative as a data-heavy day. Pay attention to how volume behaves and where price settles, because that context will matter when Wednesday delivers something for the market to chew on.
Market Sentiment and Key Levels
The directional bias today leans bearish, with the bears holding a modest but clear edge after SPY failed to hold its opening levels and closed near the session low. The -0.47% decline on below-average volume of 30.03 million shares tells a familiar story — conviction is lacking on both sides, but when price drifts lower and can't attract meaningful buying interest, the path of least resistance favors the sellers. The Nasdaq's -0.32%, the Dow's -0.51%, and the Russell 2000's -0.38% paint a picture of synchronized weakness across the board, with no major index bucking the trend to offer any real counter-narrative. The VIX rising 6.46% to 15.17 is the most important sentiment signal from today's session — that's not a panic number by any stretch, but a jump of that magnitude in a single day tells you the options market is starting to price in a little more caution, and that shift in tone deserves respect.
Key resistance sits at $776.78, today's intraday high, which was essentially set at the open and never threatened again — that's a weak structure. A recovery back above that level on volume that gets back to or exceeds average would neutralize the short-term bearish tone and put the $778 to $780 area back in play. On the downside, $772.51 — today's session low — is the immediate line in the sand. A clean break below that print on rising volume would be a meaningful warning shot, shifting attention quickly toward the $770 area and potentially deeper support around $768. The macro backdrop isn't doing the bulls any favors either — gold's 2.14% surge to $4,474 and crude oil's 2.65% advance to $84.58 keep inflationary pressures simmering, which complicates the rate cut narrative and gives the bond market little reason to settle down. Bitcoin's 2.26% gain to above $64,241 is one of the few risk-on signals in the mix, though it reads more like an idiosyncratic move than a broad green light. Until SPY can reclaim resistance with authority, the bears have the short-term edge.
Expected Price Action
Tuesday's session brings actionable intelligence generated by our AI model, with SPY projected to trade within a range defined by $772 on the downside and $782 as the max upside target. That ten-point window sits right at the consolidation threshold, meaning Tuesday is set up for more contained, rangebound action rather than a clean directional trend. With Monday's close at $772.66 sitting at the very bottom of the projected range, bears hold a clear structural edge heading into the session, and the VIX climbing 6.46% to 15.17 confirms the market is beginning to price in real caution.
The $778 level is the defining ceiling to watch — that's the immediate gate bulls need to reclaim to keep any recovery attempt alive. Getting through $778 opens $779 first, then $780 where the heaviest overhead interest sits and price should want to stall. Above $780, $782 caps the expected move top and represents max upside. On the downside, $776 is the first level that matters and sits right above where Monday closed — sellers defending that level early would be a meaningful warning sign. Below $776, $775 becomes the most critical battleground of the session and where the heaviest fight should occur. A clean break of $775 opens the door lower quickly, with $773 serving as the point of last hope for bulls and the floor holding this move together. Losing $773 leaves little cushion until $772 at the bottom of the expected move. Bias leans clearly bearish given where Monday's close fell within the projected range, but the key test is whether buyers can push back through $776 and reclaim $778, or whether sellers break $775 early and force a fast trip to $773. Watch those two levels — they decide Tuesday's direction.
Trading Strategy
The VIX rising 6.46% to 15.17 is a modest but notable shift in tone, signaling that fear is beginning to creep back into the market after an extended period of calm. At 15.17, volatility is still historically contained and not yet in alarm territory, but the uptick is a reminder that complacency has a cost. Traders should respect this shift by trimming position sizing down to the 75-85% range and keeping stop-losses tight in the 1.0-1.25% range from entry. Don't overreact to a single day of elevated VIX, but don't ignore it either — when fear starts ticking higher on light-volume selling days, it often means the path of least resistance is shifting.
In a falling market scenario, the key level to watch is $772.51, the session low. A decisive break below that level on any meaningful pickup in selling pressure opens a short entry targeting the $769-770 zone, with stops placed above $775 to manage risk cleanly. If sellers push through $769 with conviction, the next meaningful support sits around $765-766, making that a reasonable secondary profit target for traders running a trailing stop. With the VIX at 15.17 and trending higher, shorts have slightly more runway than they did recently — but discipline is still required. Avoid pressing a short into oversold conditions without confirmation of continued downside momentum, and cover into the support zones rather than waiting for a full reversal to slap you out.
In a rising market scenario, bulls need to first reclaim $775 cleanly and hold it as an intraday base before pressing higher. A bounce off that level with visible buying interest is the better long entry, with $776.78 — the session high — serving as the first resistance hurdle to clear. A clean push through $776.78 opens the door to $779-780 as the primary profit target, and $782-783 on strong continuation. Stops on longs belong below $772 to protect against a deeper break. The VIX at 15.17 is still well below levels that historically stall rallies outright, so if buyers show up and volume picks up, the setup for a recovery bounce is there — just let price confirm before sizing in.
Model’s Projected Range
SPY's projected maximum range for Tuesday is $768 to $777, with the Put side dominating in an expanding band that suggests trending price action with intermittent chop. Tuesday brings no economic news due out so the market will trade on technicals. SPY closed at $772.66, down 0.47%, after opening at $776.18, tagging a high of $776.78, and sliding to a low of $772.51 before settling near the lows — a session that saw sellers in control for most of the day with the VIX rising 6.46% to 15.17, confirming the modest risk-off tone. SPY remains in the $770 to $775 range that has defined recent trading, with broader macro uncertainty continuing to keep buyers cautious at elevated levels. Our model shows the first resistance at $775, and a clean break above that level would target $776 next, while a break below the first support at $770 opens the door toward $768, and if that gives way there is little to keep price from falling toward $760. The long-term bull trend remains intact above $640 with SPY well above structural support. As long as price holds above key structural levels, this remains a broader dip-buying environment. Absent a catalyst, resistance sits at $775, $776, $777, $780, while support rests at $770, $768, $765, $760. We favor buying dips at $770 given SPY closed near the lower end of the range and the model's expanding Put band suggests potential for a snapback if support holds. Bitcoin posted a solid gain of 2.26%, closing above $64,241, but MAG stocks were mostly red across the board led by Meta down 3.54%, creating a mixed leadership picture — sustained weakness across both groups would be required to signal a deeper pullback. The VIX closed at 15.17, up 6.46%, suggesting elevated fear given the selling pressure into the close and the broader caution around extended price levels. SPY closed just above the lower line of the trend channel with structural support near $770, keeping the near-term structure intact but putting bulls on notice to defend that level Tuesday.
Market State Indicator (MSI) Forecast
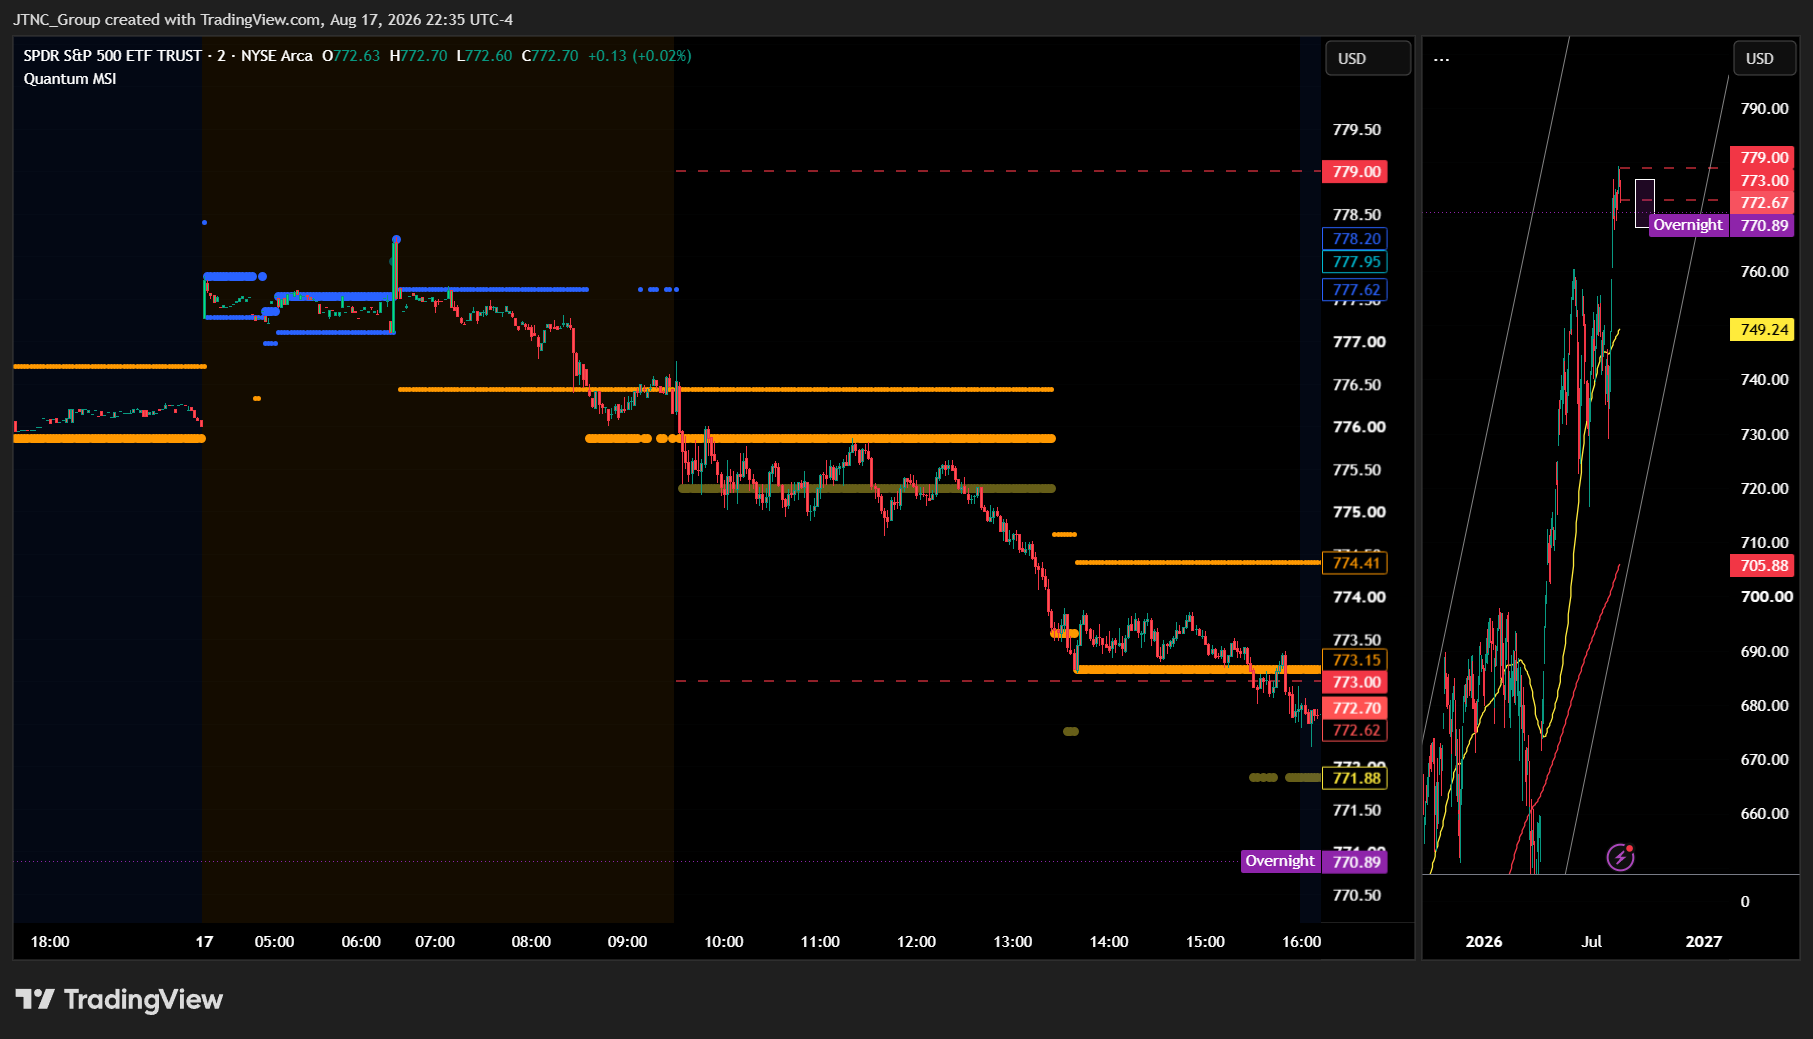
Current Market State Overview:
The MSI ended in a Bearish Trending Market State with SPY closing at $772.66. Since SPY closed below MSI support, that former support level at $773.15 now becomes resistance heading into Tuesday, with the prior MSI resistance at $774.41 serving as the upper resistance level above. Extended targets were not printing at the close, though they did print below during the PM session. The MSI opened overnight in a bullish state but quickly rescaled lower, transitioning into a wide Bearish Trending state by the open. From there, the bears maintained firm control as the MSI underwent a series of rapid rescalings lower with extended targets printing below, driving price from $776 all the way down to $772 through the afternoon session. The MSI then settled into a narrow Bearish Trending state into the close with extended targets no longer present. Without extended targets at the close and with a narrow $1.26 spread, the MSI is forecasting slightly lower prices Tuesday but ones that will likely remain in a range. The narrow width suggests the market is coiling rather than trending with conviction, and the absence of extended targets removes the fuel needed to sustain a clean directional move in either direction. The forecast for Tuesday is likely sideways to possibly up as the narrow bearish MSI suggests consolidation rather than strong trending. That said, the bears are likely to maintain pressure to the downside. Any failure of MSI support is likely to see SPY retest the day's lows. MSI support is $773.15 with resistance at $774.41.
Key Levels and Market Movements:
Friday we stated, "Bulls want to see overnight price hold $775.86 as support and the MSI rescale higher with extended targets printing above," and added, "Bears want to see $775.86 fail and the MSI rescale lower with extended targets printing below. If that occurs, SPY is likely to retest Friday's low at $775.43 and press toward lower levels beneath the session range," while also noting, "A Ranging state at the open is entirely possible given the tight width at the close, and in that environment the highest-probability plays remain failed breakouts above $776.71 and failed breakdowns below $775.86. Do not anticipate the direction — let the MSI confirm its state before committing to either side." That framework played out with precision on Monday, and the bears delivered a decisive answer right from the open. The bulls never gained the traction needed to hold $775.86 as support, and what followed was a session that belonged to the bears from start to finish.
The MSI opened overnight in a bullish state with extended targets visible in premarket in the $777 to $778 range, offering an early optimistic signal. But that optimism faded fast. From the open, the Bearish Trending state took hold as price sold off sharply, and the MSI began a series of rapid rescalings lower that defined the entire session. Extended targets printed below through the PM session, giving traders a clear and consistent signal that selling rallies to MSI resistance was the dominant setup. Each time the MSI rescaled lower and established a fresh resistance level, the framework offered another opportunity to get short and ride price down toward the next support level. The bears drove SPY from $776 all the way down to $772 through the afternoon, with extended targets printing below confirming the momentum throughout that move. It was only as the session wound down and extended targets stopped printing that the aggressive downside pressure began to ease. SPY opened at $776.18, traded a high of $776.78, a low of $772.51, and closed at $772.66, down 0.47% on volume of 30.03 million shares, which came in below average. The VIX rose 6.46% to 15.17. The primary trade setups the MSI provided were selling rallies to MSI resistance during the AM and PM sessions when extended targets were printing below, and then recognizing the exhaustion of that downside momentum once extended targets faded. At minimum it was a 2-for-2 session for traders following the framework. It was an easy day to read and execute with substantial setups, all identified through proper context, patience, and flexibility while leveraging the MSI, premarket levels, and market structure rather than forcing trades. The MSI continues to prove its reliability as the cornerstone of our trading process.
Trading Strategy Based on MSI:
Tuesday has light economic news so the market is likely to move more sideways than trend given the Bearish Trending state at the close. But with such a narrow range it is also likely the MSI rescales overnight and a short squeeze ensues which will push price back to test higher levels. There are no high-impact catalysts on the calendar Tuesday, which means the MSI's behavior overnight and at the open will once again be the most important guide for how the session unfolds. The real fireworks on the economic calendar do not arrive until Wednesday with FOMC Meeting Minutes, so between now and then the market may simply be content to coil within its current range and digest Monday's move lower.
Given the narrow Bearish Trending close with no extended targets, Tuesday is likely to see continued pressure from the bears, but the lack of conviction in the MSI width makes a sustained directional move in either direction less probable than a choppy, back-and-forth session. The $1.26 spread is telling you the market is coiling, not trending, and the absence of extended targets at the close removes the fuel that would be needed to drive a clean continuation lower. That said, bears retain a modest edge heading into Tuesday, and since SPY closed below MSI support, that $773.15 level now acts as resistance. Any failure to reclaim $773.15 could see SPY retest Monday's low at $772.51 and press toward lower levels beneath the session range. Conversely, a short squeeze overnight or a bullish MSI rescale could flip the narrative quickly and put $773.15 and levels above back in play. Bulls want to see overnight price hold current levels and the MSI rescale higher with extended targets printing above. If that happens, the door opens for a push toward $773.15 and potentially higher toward $774.41 and above. Bears want to see $773.15 cap any rally and the MSI rescale lower with extended targets printing below. If that occurs, SPY is likely to retest Monday's low at $772.51 and press toward lower levels beneath the session range.
The most actionable setup in a narrow Bearish Trending MSI without extended targets is to sell rallies to MSI resistance at $773.15 if the Bearish Trending state persists and extended targets are not printing above, targeting the premarket levels below since price is currently sitting beneath the MSI range. Alternatively, if the MSI rescales overnight into a bullish state and reclaims $773.15 with conviction, buying dips toward that level and targeting $774.41 and higher becomes the preferred approach. A Ranging state at the open is entirely possible given the tight width at the close, and in that environment the highest-probability plays remain failed breakouts above $773.15 and failed breakdowns below the session low. Do not anticipate the direction — let the MSI confirm its state before committing to either side.
The long-term bull trend remains intact above $640 and failed breakouts and failed breakdowns continue to offer the highest-probability setups. Remain flexible, avoid trading during Ranging Market States unless a clear failed breakout or breakdown presents itself, and ensure all trades are fully aligned with MSI signals. Providing real-time insights into market control, momentum shifts, and actionable levels, the MSI when integrated with our Pre-Market and Post-Market Reports continues to sharpen execution precision and elevate trade quality. If you haven't yet integrated MSI and our model levels into your process, now is the time. Contact your representative to get started as these tools are designed to support consistency and enhance performance.
Dealer Positioning Analysis
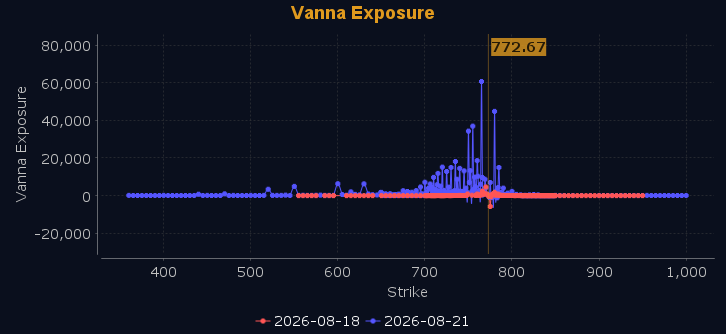
Dealers are selling SPY $774 to $788 and higher strike Calls, indicating the Dealers' limited conviction on direction heading into Tuesday. The ceiling for Tuesday appears to be $776. Notably, Dealers are no longer selling ATM Puts, telling us they have no defined floor in the market for Tuesday. To the downside, Dealers are buying $770 to $705 and lower strike Puts in a 4:1 ratio to the Calls they're selling, displaying heightened concern that prices could move lower. Should SPY fail to hold $770, the zone from $764 to $770 becomes a minefield of indecisive price action with false breakouts in both directions. Below $770 is bearish and above $772 is bullish, with heavy chop in between. Dealer positioning is unchanged at bearish.
Looking Ahead to Next Friday:
Dealers are selling SPY $774 to $795 and higher strike Calls, indicating the Dealers' belief that prices may face resistance at higher levels but remain supported. The ceiling for next week appears to be $779. Dealers are also selling $769 to $773 Puts near the money — Dealers do not sell ATM Puts unless they believe there is a floor in the market at $769 — and this represents the strongest bullish conviction we have seen from Dealers in weeks. To the downside, Dealers are buying $768 to $655 and lower strike Puts in a 4:1 ratio to the Calls they're selling, displaying heightened concern that prices could move lower should support break. Dealers appear fully committed to higher prices and are positioned to participate in a continuation of the current rally, setting up the market for further upside into late August. Remain bullish above $769, but below $767 and especially $763 the posture shifts bearish. There is major resistance at $774 to $779 which will slow any ascent. For the week Dealer positioning is unchanged at bullish. We advise reviewing Dealer positioning daily for directional clues. These positions evolve quickly and tracking them is essential for staying ahead of shifting market sentiment.
Recommendation for Traders
With SPY closing at $772.66 and VIX jumping 6.46% to 15.17, the near-term bias leans cautious. Look for potential longs only on a reclaim of $774–$775, with tight stops below $772.51. Below that level, favor the short side toward $770. Don't press longs into overhead resistance near $776.78 — that's where sellers showed up.
Keep size in check given the uptick in volatility. Review the premarket analysis posted before 9 AM ET for any changes in the model's outlook and Dealer Positioning.
Good luck and good trading!
