Market Insights: Friday, August 15th, 2025
Market Overview
Stocks ended the week on a mixed note Friday, with the major averages logging a second straight week of gains, even as rate-cut expectations were muddied by fresh economic data. After a hot PPI reading on Thursday triggered doubts about the Fed's next move, Friday brought more conflicting signals. Retail sales for July rose 0.5%, slightly below expectations but still suggesting consumer resilience. Meanwhile, University of Michigan data showed consumer sentiment slipping for the first time in four months, with longer-term inflation expectations ticking higher, adding to the uncertainty surrounding the path of monetary policy. The Dow managed a modest gain thanks to a surge in UnitedHealth after news broke that Berkshire Hathaway had taken a sizable stake in the company. Meanwhile, the S&P 500 and Nasdaq both retreated, pressured in part by weakness in chip stocks following soft guidance from Applied Materials. Investors also kept one eye on global developments, with a meeting between President Trump and Russian President Putin drawing headlines, particularly around potential shifts in semiconductor policy. With the data picture turning murky, traders are reassessing just how soon and how deep any Fed rate cuts might be.
SPY Performance
SPY slipped 0.23% to close at $643.44 after opening at $646.06 and briefly tagging a high of $646.08. The ETF tested the prior day’s low near $642.50 midday before recovering into the close, though it remained in negative territory. Volume picked up modestly to 60.74 million shares, signaling a slightly more active session as traders positioned ahead of the weekend. The shallow pullback suggests bulls are still in control, but the failure to hold intraday highs reflects rising caution amid mixed data and OPEX-driven volatility.
Major Indices Performance
The Dow led the day with a modest gain of 0.08%, boosted by strength in UnitedHealth, while the Russell 2000 lagged once again, dropping 0.56% as small caps struggled under renewed inflation pressures. The Nasdaq lost 0.40%, weighed down by chip-related weakness, and the S&P 500 gave up 0.3%, retreating from its recent record highs. Sector performance skewed defensive, with healthcare outperforming, while tech stocks took a breather following multiple weeks of outperformance. The muddled economic picture, solid consumer spending paired with lingering inflation, left the market in a holding pattern as traders digest the implications for the Fed’s next move.
Notable Stock Movements
The Magnificent Seven posted a mixed performance, mirroring the indecision across broader markets. Meta, Netflix, Amazon, and Alphabet ended in the green, helping limit downside in the Nasdaq. Tesla, Microsoft, and Apple edged lower, though none experienced outsized losses. The standout mover was UnitedHealth, which surged after news of Berkshire Hathaway’s investment surfaced. Conversely, Applied Materials sank around 14% following weak forward guidance, underscoring lingering uncertainty around global chip demand. Overall, individual stock action reflected a balance between risk-on positioning and selective profit-taking.
Commodity and Cryptocurrency Updates
Crude oil pulled back 1.30% to $63.14, retracing part of its recent bounce and reinforcing our model’s long-standing view that a move toward $60 remains on the horizon. Gold was flat on the day, ending at $3,380, holding steady despite shifting inflation expectations and rising yields. Bitcoin dipped 0.71% to close just above $117,000, consolidating near recent highs. With crypto and commodities both showing muted reactions, markets appear to be in wait-and-see mode, awaiting a clearer directional cue from the Fed or economic data.
Treasury Yield Information
The 10-year Treasury yield climbed 0.63% to close at 4.320%, continuing its gradual rise in the wake of Thursday’s hot PPI print. Yields remain comfortably below the danger zone above 4.5%, but this drift higher is notable. With inflation expectations creeping up and sentiment data softening, the Fed’s path is increasingly uncertain, and yields could play a decisive role in guiding equity markets in the coming weeks. For now, the rise in yields hasn't derailed the equity rally, but traders are watching closely for signs of stress, particularly in rate-sensitive sectors.
Previous Day’s Forecast Analysis
Thursday’s forecast called for SPY to trade between $638.75 and $649.75 with a bullish bias above $642. Upside targets were set at $645, $648, and $650, with downside levels pegged at $642, $640, and $638. The model leaned toward long setups on dips above $642, suggesting that a sustained hold above this level could lead to continued upside. It also cautioned that a break below $642 might usher in a pullback toward $638 or lower. With volatility expected to rise due to OPEX and economic data, the strategy emphasized nimbleness and a preference for long trades unless key support failed.
Market Performance vs. Forecast
Friday’s session respected the forecasted parameters almost exactly. SPY opened at $646.06, near the model’s upper targets, and tagged a high of $646.08 before retreating to a low of $642.52. The close at $643.44 fell just within the lower half of the projected range. SPY spent most of the session moving between the $642.50 support zone and resistance near $645, consistent with the model’s expectations for choppy but directional price action. The early fade offered opportunities for short trades off intraday highs, while the rebound into the close validated the long setups suggested by the model. While $648 and $650 weren’t tested, the session played out as a textbook example of respecting technical levels in a volatile environment.
Premarket Analysis Summary
In today’s premarket analysis posted at 7:19 AM, SPY was trading at $646.33 with a bias level identified at $645.75. The model projected continued upward drift as long as SPY remained above this level, with upside targets at $648.20 and $650. On the downside, the model flagged $645.75 as key support, with further levels to watch at $643, $642, $639.75, and $638.25. Traders were advised to avoid shorts unless the bias level failed and were encouraged to look for long entries on dips, expecting buying interest to persist unless the market showed clear signs of reversal.
Validation of the Analysis
The premarket blueprint delivered another accurate read. SPY opened just above the bias level at $646.06 and immediately lost momentum, dipping to a low of $642.52 before rebounding into the close. While the upward drift did not continue, the premarket analysis correctly predicted that a break below the bias would lead to a pullback toward the $642–$643 zone. The bounce from this area late in the day confirmed the model’s suggestion that dip buyers would defend key support. Although the day didn’t produce trending upside, the projected range, bias level, and caution against aggressive shorts proved spot-on once again.
Looking Ahead
With no scheduled economic data on Monday or Tuesday, traders’ attention will shift to Wednesday’s FOMC minutes and Thursday’s unemployment claims and PMI data. These events could significantly influence rate-cut expectations and market sentiment. Friday’s Jackson Hole Symposium also looms large on the calendar, and any unexpected commentary could create sharp volatility. With markets lacking a near-term catalyst in the first half of the week, expect consolidation to dominate until traders have a clearer picture of the Fed’s next move.
Market Sentiment and Key Levels
SPY closed at $643.44, slightly lower on the day but still above key support levels, maintaining its bullish structure for now. The recent inability to hold intraday highs, however, signals some softening momentum. Resistance now stands at $645, $649, and $650, with heavy supply expected near these levels. Support sits at $641, $640, $637, and $635, with a broader cushion between $630 and $635. Bulls remain in control above $642, but a decisive break below $640 could put pressure on the trend and invite deeper pullbacks.
Expected Price Action
Our AI model projects SPY to trade between $640 and $647 on Monday, suggesting a slightly narrower range that implies more consolidation. The bias remains bullish above $642, with upside targets at $645, $649, and $650. A break above $649 would likely prompt a quick test of $650, though resistance may firm above that zone. If SPY fails to hold $640, the market could slide toward $638 or even $635. This is actionable intelligence and signals a potential tug-of-war as traders prepare for a catalyst-heavy second half of the week. The model suggests the next session may be rangebound with sudden, short-lived trending moves.
Trading Strategy
With SPY closing near the midpoint of its range and the VIX edging up to 15.09, long trades are still favored on dips near $641 or $640. Profit targets for longs are $645, $649, and $650, and traders should tighten stops near each resistance level. Short trades should only be attempted on failed breakouts above $645 or a breakdown below $640, with downside targets at $637 and $635. The slight increase in VIX signals that volatility may rise into midweek, so traders should size down and remain flexible. Avoid overexposure heading into a data-heavy week and manage risk carefully around key levels.
Model’s Projected Range
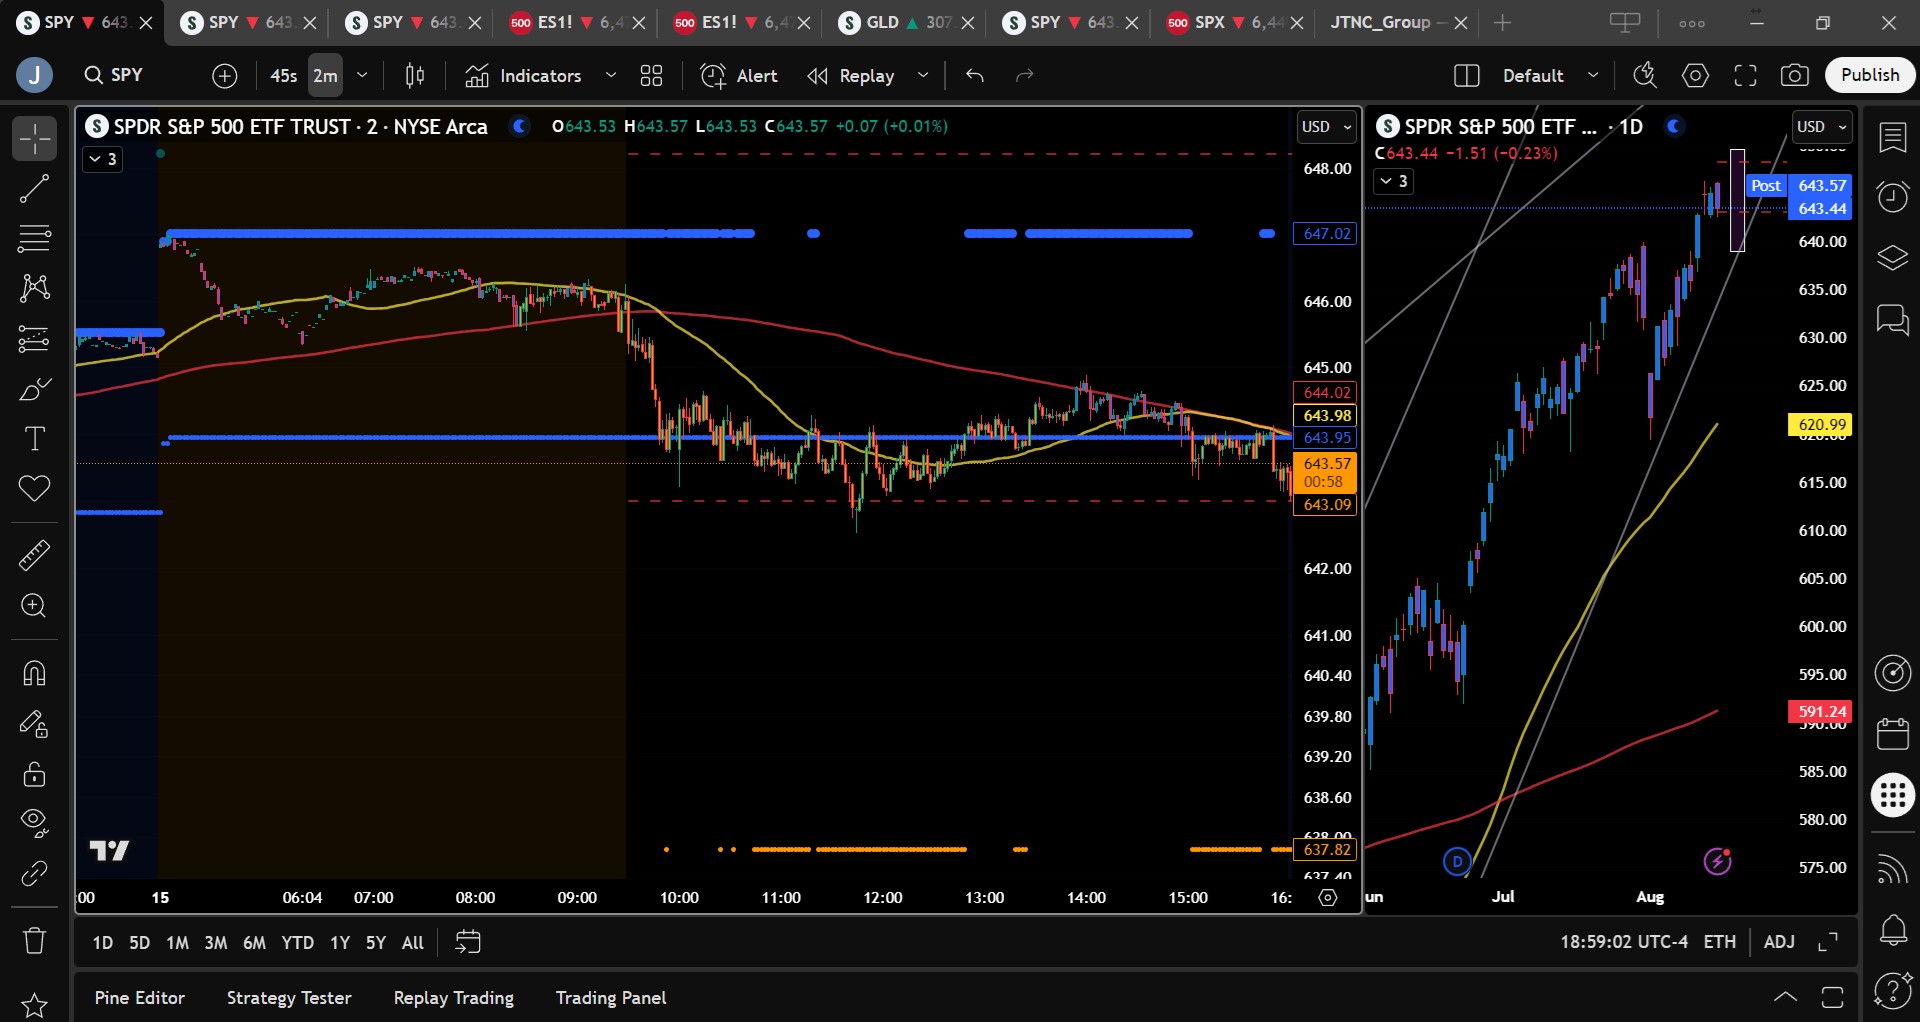
The model projects SPY’s maximum range for Monday between $639 and $649.50, with the Call side dominating in a narrowing range, suggesting consolidation with intermittent trending moves. Overnight, markets traded higher as forecast, making a new intraday all-time high at $647.02 before pulling back to just under $646 at the open, then quickly selling off to test the prior day’s lows at $642.50 before noon. The afternoon session was range-bound between $642.50 and $645, fading into the close to finish down 0.23% on average volume. Dip buyers defended the $642 level as expected, and despite weaker UoM Consumer Sentiment and higher Inflation Expectations, the close at $643.44 kept the bull trend intact. Absent an external catalyst, bulls are likely to defend $642 overnight, with a failure there targeting $640; a successful defense could push SPY toward new highs next week. A break below $640 risks a move to $638 or lower. Resistance sits at $645, $649, and $650, above which heavy supply could cap gains. Support rests at $641, $640, $637, and $635, with a cushion forming between $630–$635 that may limit downside. Since reclaiming $585, SPY has trended strongly higher, buying dips consistently unless leadership falters or macro shocks hit. “Mag” stocks today were mixed likely due to OPEX rather than weakness. Yet we still view the recent parabolic move as high risk and low reward, favoring quick profit-taking and no overnight holds. Early signs point to a potential correction in early September through mid-October, but for Monday, expect more sideways than trending action as SPY consolidates for its next move. The VIX rose 1.75% to 15.09, a mild uptick worth monitoring but still supportive of the bullish tone. We continue to recommend hedging long exposure in anticipation of rising volatility this fall. A VIX below 23 remains supportive of equities, while a breakout above 23 could spark the widely anticipated 5–10% pullback.
Market State Indicator (MSI) Forecast
Current Market State Overview:
The MSI ended the day in a wide Ranging Market State, with SPY closing at the upper end of the range. There were no extended targets all day as the MSI spent much of the day in a ranging state. Overnight the MSI rescaled higher in a bullish state but as price tested MSI support at $642.95, the MSI flip flopped between a bullish state and ranging state. With the MSI currently in a ranging state, Sunday night and Monday is likely to see more sideways than higher or lower price action. We recommend watching the MSI for changes in the premarket given price is resting right at a major support level which could lead to the MSI rescaling lower. MSI support is currently $637.82 with resistance at $643.93.
Key Levels and Market Movements:
On Thursday we wrote, “Friday brings…OPEX, which tends to bring whippy, choppy action,” and noted, “a close above $642 paired with new highs will likely continue to pressure market participants to buy.” We also noted “we expect the market to drift higher overnight toward the $646 area, which could attract sellers.” With that context and with the MSI in a Bullish Trending Market State with no extended targets above, and the premarket setting up a textbook failed breakout, we entered short at $646 on a double top at the open, targeting MSI support at $644, which hit before 10 a.m.. We then looked to the premarket report for T2 at $643, reached by noon, at which point a textbook failed breakdown led us to close the final 10% of the short. While we considered reversing long, readers know we avoid trades within an MSI Ranging State, and with one solid winner in the bank, a Friday in the summer, and OPEX in a market near all-time highs, the edge simply wasn’t strong enough to warrant re-entry, so we started the weekend early, capping off a great week with no losers and solid profits each day, thanks to a clear plan, disciplined execution, and strong alignment between MSI’s directional cues, our broader market model, and key technical levels. The MSI continues to be a cornerstone of our consistent trading process.
Trading Strategy Based on MSI:
Monday and Tuesday have no scheduled economic news, though the weekend can always produce unexpected developments or macro triggers from the White House, so remain alert and, as always, trade what you see should anything unusual occur. Absent an external catalyst, Monday is likely to bring sideways consolidation with two-way trading between $642 and $647. With a close once again above $642, market participants are likely to continue buying all dips, driving prices higher. We expect the market on Sunday to drift lower, testing $642, where dip buyers should reemerge, keeping the bulls in control as long as SPY holds above this level; a break could trigger a move toward $640 and potentially lower. Our model still favors the bulls with further all-time highs possible next week, given for the bears to regain real control, a clean break below $635 is required. Such a move could shift the outlook and raise the risk of a 10%+ correction. With the MSI in a Ranging Market State, choppy conditions are likely until it rescales, so we continue to favor long setups above $640 and shorts only on a confirmed break below $640 or a failed breakout near $646. As always, failed moves remain among the highest-probability setups. Stay nimble, avoid trades during Ranging Market States, and ensure full alignment with MSI. Providing real-time insights into market control, momentum shifts, and actionable levels, the MSI when integrated with our Pre-Market and Post-Market Reports continues to sharpen execution precision and elevate trade quality. If you haven’t yet integrated MSI and our model levels into your process, now is the time. Contact your representative to get started as these tools are designed to support consistency and enhance performance.
Dealer Positioning Analysis
Summary of Current Dealer Positioning:
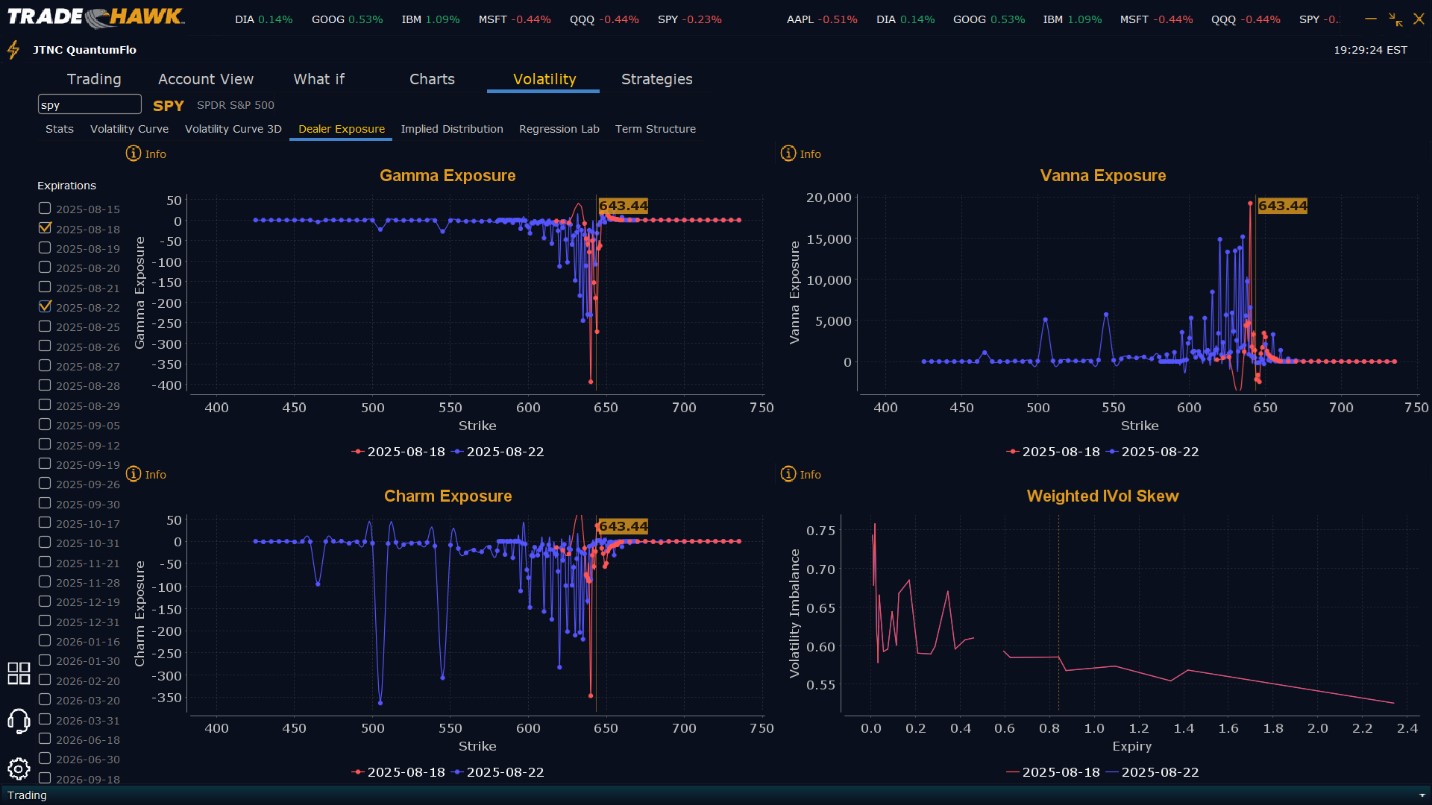
Dealers are selling SPY $647 to $665 and higher strike Calls while buying $644 and $646 Calls indicating the Dealers desire to participate in any rally on Monday. The ceiling for Monday appears to be $650. To the downside, Dealers are buying $643 to $575 and lower strike Puts in a 3:1 ratio to the Calls they’re selling/buying continuing to display little concern that prices could move much lower on Monday. Dealer positioning is unchanged from slightly bearish/neutral to slightly bearish/neutral.
Looking Ahead to Next Friday:
Dealers are selling SPY $647 to $670 and higher strike Calls while buying $644 to $646 Calls indicating the Dealers desire to participate in any continuation of the rally next week. The ceiling for next week appears to be $655 although $650 will also provide material resistance. To the downside, Dealers are buying $643 to $575 and lower strike Puts in a 7:1 ratio to the Calls they’re selling/buying, reflecting an increasingly bearish outlook for the week. For the week Dealer positioning is unchanged from bearish to bearish but has become slightly more bearish. We advise reviewing Dealer positioning daily for directional clues. These positions evolve quickly and tracking them is essential for staying ahead of shifting market sentiment.
Recommendation for Traders
SPY’s retreat from intraday highs and failure to hold above $645 suggest growing caution, though bulls remain in control above $642. Longs are still favored on dips toward $641 or $640, with upside targets at $645, $649, and $650. Shorts may be considered only on a failed breakout above $645 or a confirmed break below $640, with downside targets at $637 and $635. The VIX rising to 15.09 is a mild uptick, but it signals that intraday volatility may continue to build. Position sizing should remain conservative, especially as we approach a data-heavy back half of the week. Be sure to review the premarket analysis posted before 9 AM ET to confirm levels and dealer positioning.
Good luck and good trading!
