
Market Insights: Friday, August 14th, 2026
Market Overview
US stocks pulled back Friday after the S&P 500 briefly touched another record high before sliding into the red. The S&P 500 fell about 0.2%, the Dow dropped 0.2%, and the Nasdaq slipped roughly 0.3%, though all three indices still managed to finish the week in positive territory — the S&P 500 locking in its third straight weekly gain. Stocks turned lower in the afternoon after the University of Michigan's preliminary August consumer sentiment reading showed Americans growing more pessimistic about the economy, with inflation still weighing heavily on their minds. Adding to the pressure, oil prices rose during the session, and US retail sales posted their biggest monthly decline in over a year, according to fresh Census Bureau data.
With no major earnings on the calendar Friday, the market's focus is already shifting to next week's slate of retail reports, including Target and Walmart, before Nvidia's highly anticipated earnings drop on August 26.
SPY Performance
SPY opened at $778.54 and pretty much went nowhere fast — but in the wrong direction. The high of $778.80 came in almost immediately, just a whisker above the open, which tells you buyers had no real follow-through from the jump. From there, price drifted lower through the session, tagging a low of $775.43 before settling at $776.32 into the close. That's a tight range of just $3.37 from low to high, and the fact that the high was essentially the open is the same kind of tired tape we've seen in prior sessions — bulls couldn't build on yesterday's progress, and the close near the lower half of the range confirms sellers were in control for most of the day.
SPY finished down 0.20% on the day, giving back a chunk of yesterday's gains without a whole lot of drama. It's not a catastrophic loss, but it's frustrating in the context of the prior session's push higher. Volume came in at 25.38 million shares, below average once again, so there wasn't a flood of conviction on either side — just quiet, grinding weakness. The VIX dropped 3.01% to close at 14.19, which is an interesting divergence. Typically you'd expect the fear gauge to rise when SPY sells off, so the VIX decline suggests the market isn't reading this pullback as anything serious — more of a pause than a panic. Still, two consecutive days of below-average volume with a failed follow-through is worth watching. The bulls need to show up with real participation soon or this recent run starts to look shakier than the price action alone suggests.
Major Indices Performance
The Russell 2000 was the standout performer on the day, bucking the broader trend with a gain of 0.53%. That's a notable move for small-caps, especially on a session where most of the market was leaning red. Small-caps tend to be more domestically focused and sensitive to rate expectations, so seeing them outperform while larger indices struggled suggests there may be some rotation happening beneath the surface — money finding its way into corners of the market that had been left behind.
The Nasdaq slipped 0.28%, weighed down by a mostly red showing from the heaviest hitters in the index. When the mega-cap growth names are struggling, the Nasdaq doesn't have much of a cushion to fall back on, and that's exactly what played out here. It wasn't a dramatic selloff by any means, but the lack of leadership from the index's biggest weights made it tough to find upward momentum.
The Dow finished down 0.2%, essentially matching the S&P 500's decline and confirming that this was a broadly soft session rather than a tech-specific problem. Blue-chip names didn't have much working in their favor today — there was no obvious catalyst to drive value names higher, and the mild pressure across the board kept the Dow pinned in the red. Overall, the day's story was one of divergence: small-caps found buyers while large-cap growth and value names alike struggled to get out of their own way.
Notable Stock Movements
Amazon led the Magnificent Seven lower today, sliding as much as -0.94% and standing out as the group's biggest drag in a session that tilted mostly red for mega-cap tech. Amazon's weakness set the tone for the cohort early, and with the broader tape already leaning negative, there wasn't much of a counter-narrative to push back against it. When the largest names in the market are struggling to hold ground, it tends to confirm the cautious mood rather than challenge it, and that's exactly what played out today.
The broader Magnificent Seven picture was a step backward from the encouraging showing in the prior session. The group flipped mostly red, reversing much of the constructive sentiment that had built up when the cohort was broadly participating on the upside. The two bright spots were Tesla and Apple, both of which managed to finish green and at least kept the session from being a complete washout for the group. A couple of green names against a field of red is a thin silver lining, but it's worth noting that those names held up rather than piling onto the selling pressure.
The mostly red showing from the Magnificent Seven matters because this group had just reclaimed its role as a source of leadership, and today's pullback puts that narrative back in question. With the Russell 2000 actually posting a gain on the day, there's a rotation story worth watching — money appeared to find its way into smaller caps while mega-cap tech gave back ground. That kind of divergence isn't necessarily alarming in a single session, but if the Magnificent Seven continues to lag while the broader market stays mixed, it signals that the leadership foundation underneath this market remains fragile.
Commodity and Cryptocurrency Updates
Crude oil climbed 1.33% to settle at $82.33, continuing to defy longer-term model expectations by holding firmly above $70. The rally at these levels keeps energy prices squarely in the conversation around inflation, and a sustained run in the low $80s makes the Fed's job that much harder. Supply dynamics and global demand remain the primary drivers, and with crude showing no real signs of rolling over, energy costs will keep adding friction to the path toward lower inflation. Policymakers simply can't look past crude when it's trading at these levels.
Gold had a strong session, gaining 1.57% to close at $4,432, extending what has been a remarkable run for the metal. Central bank demand, macro uncertainty, and lingering inflation concerns continue to fuel the bull case, and today's move higher suggests buyers remain firmly in control. There's no sign of exhaustion in the structure, and gold continues to behave like the market's preferred safe haven regardless of what's happening elsewhere.
Bitcoin slipped 0.73%, closing just above $62,939, a modest pullback after holding the $63,000 zone fairly well in recent sessions. This kind of drift lower is typical consolidation behavior rather than anything structurally concerning. Buyers have been consistent near these levels, and as long as that support holds, today's slight dip reads more like a routine shakeout than the beginning of anything more serious.
Treasury Yield Information
The 10-year Treasury yield moved in the wrong direction today, climbing 1.19% to close at 4.700%. That's a meaningful one-day jump that erases some of the progress made in yesterday's session and puts yields back closer to the danger zone. The brief sense of relief the bond market offered yesterday has faded quickly, and the weight on equity valuations is back in full force.
At 4.700%, the yield now sits 20 basis points above the 4.5% threshold where stocks start feeling genuine pressure — a wider gap than where we were just two sessions ago. More importantly, the cushion to 4.8% has shrunk to just 10 basis points. That's a thin margin, and it wouldn't take much — a hotter-than-expected inflation print, a hawkish Fed speaker, or a weak Treasury auction — to push yields through that level. Once 4.8% breaks convincingly, this framework calls for accelerating selling in equities, and today's muted market reaction to this yield move shouldn't breed too much comfort.
What makes today's rise more concerning is that it came alongside a risk-off tone in equities rather than in response to strong economic optimism. That's not the kind of yield increase you can easily rationalize away. The levels to watch remain the same — 4.8% is where selling pressure historically picks up under this framework, 5% is where conditions turn genuinely difficult for stocks, and 5.2% is where a 20%-plus correction enters the conversation in a serious way. Right now, the market is still managing the yield environment rather than being overwhelmed by it, but today's move is a reminder that the bond market hasn't given the all-clear. Yields need to head south with conviction before this headwind meaningfully lifts.
Previous Day’s Forecast Analysis
Friday's forecast called for SPY to trade within a projected range of $769 on the downside and $782 as the max upside target, a thirteen-point window wide enough to signal directional movement rather than sideways chop. With Thursday's close at $777.82 sitting in the upper half of that range, the bias heading into Friday was bullish, with the VIX's slight uptick to 14.64 flagged as a minor caution signal but not enough to threaten the overall constructive tone.
On the upside, $779 was identified as the immediate ceiling to clear, with conviction above that level opening the door to $780 and ultimately $782 as max upside. To the downside, $777 was the first line of defense, and a clean break below $775 was the level that would signal a meaningful shift in tone, exposing $773, then $772 where selling could accelerate, and finally $769 as the max downside where buyers were expected to step in with force. The week's key theme — $775 as the defining gate — carried into Friday's setup as well.
The recommended trading approach called for keeping position sizing in the 80-90% range with stop-losses in the 1.0-1.25% range from entry, reflecting the nudge higher in the VIX and below-average volume. For a bearish scenario, a failure to hold $774 on a retest was the short trigger, targeting $771-772 with stops above $777. For the bullish scenario, the preferred entry was a shallow pullback to $775-776 that stabilized with visible buying, targeting $779 first and $782-783 on follow-through, with stops placed below $772. The overarching message was to wait for price confirmation and let volume validate the move before adding size.
Market Performance vs. Forecast
Friday's session opened at $778.54, landing squarely within the projected range and above the $777 first line of defense the forecast had identified as critical for bulls to hold. That opening alignment confirmed the model's structural read — price was positioned in the upper half of the range, consistent with the bullish bias the framework had outlined heading into the session. The forecast had correctly framed $777 as the first meaningful test for sellers, and Friday's tape spent the session navigating exactly that zone, with the low of $775.43 finding its footing well within the support architecture the model had mapped between $775 and $777.
The session closed at $776.32, a modest decline of 0.20%, with the high reaching only $778.80 — a tape that respected the $779 ceiling the forecast had flagged as the key upside gate requiring conviction to clear. Bulls were unable to push through that level with force, which is precisely the scenario the model anticipated as the alternative to an upside breakout, and sellers pulled price back into the middle of the projected range exactly as the downside playbook described. The $775 level the forecast designated as a critical battleground held as meaningful support, and the session's low of $775.43 validated that the model's downside architecture was correctly positioned. The conservative long entry framework — a shallow pullback toward $775-$776 that stabilizes with visible buying interest — defined Friday's entire price structure from open to close. Volume came in at 25.38 million shares, below average, consistent with the model's caution about thin participation masking underlying tone shifts, which is why the framework recommended keeping position sizing in the 80-90% range rather than pressing aggressively. The VIX dropping 3.01% to 14.19 confirmed the low-fear environment the forecast associated with a contained, range-bound tape. The key levels held, the directional architecture proved accurate, and the framework's disciplined approach to sizing and confirmation kept traders protected throughout the session.
Premarket Analysis Summary
The premarket analysis posted at market open identified SPY spot at $778.77 in a put-dominated tape, with price stalling just under the next gate after the prior session's breakout. The expected move was again five points, keeping projected ranges contained. The defining level of the day was $780 — flagged as the immediate ceiling bulls needed to clear to extend the move, with $781, $782, and $784 as upside targets beyond it and $787 standing as max upside. On the downside, $778 was the first line of defense sitting right under spot, $775 was identified as the most important level of the day with the heaviest battle expected there, $774 marked the bottom of the expected move and last line of support, and $770 was the max downside. The bias acknowledged fragility — with so much weight stacked at $775, the setup carried real risk that an early loss of $778 would trigger a quick test of $775 and a serious fight.
The actual session played out on the bearish side of that framework. SPY opened at $778.54, essentially right at spot, and never made a run at the $780 ceiling. The high of $780.80 — excuse, $778.80 — confirmed the upside was completely capped, and sellers eventually pushed price through the $778 first defense line, driving it down to a low of $775.43 before buyers stepped in just above the critical $775 level. The close at $776.32 represented a loss of 0.20% and landed price in the lower half of the expected move range. Volume came in at 25.38 million shares, well below average. The VIX dropping 3.01% to 14.19 despite a red session is an unusual divergence worth noting, but the inability to reclaim $778 into the close leaves the tape in a softer posture heading into next week.
Validation of the Analysis
Friday's session validated the premarket framework with surgical precision, playing out almost exactly as the analysis warned it might — a fragile setup that handed the session back to sellers early and delivered the exact battle zone the premarket had circled as the most important level of the day. SPY opened at $778.54, essentially right on spot, and immediately stalled under the 780 ceiling the analysis identified as the defining gate bulls needed to clear. The open also kissed the 778.80 high — a near-perfect touch of the 778 downside level flagged as the first line in the sand — before sellers took control and the session turned south.
The premarket was explicit: losing 778 cleanly hands the session back to sellers, and that's exactly what happened. Once 778 failed to hold, the analysis called for a quick test of 775 and a real fight there — and the low of $775.43 confirms SPY drove straight into that level with precision. The 775 zone absorbed the selling and held as support, preventing the uglier scenario the analysis warned could unfold below it. The close at $776.32 settled right between 775 and 778, fully contained within the downside framework's mapped territory. Traders who had the loss of 778 marked as their short trigger had a well-defined entry with the 775 battle zone as their first target and a clear roadmap the entire way down. The premarket even described this setup as more fragile than Thursday's — and with the VIX dropping 3.01% to 14.19 while price drifted lower on below-average volume, that read was exactly right. Every key level the analysis outlined performed its job, confirming once again why having this framework mapped before the open is one of the most valuable tools a trader can have.
Looking Ahead
Monday's economic calendar is quiet heading into next week, with no high-impact releases scheduled to move the needle. That gives traders a relatively clean session to regroup after this week's inflation data and position themselves ahead of what shapes up to be a much heavier stretch midweek. Without a catalyst forcing anyone's hand, Monday becomes more of a read-the-tape kind of day — you're watching how the market digests everything that just landed rather than reacting to something new.
Use the session to get your levels right ahead of Wednesday's CPI report, which will be the main event of the week. Core and headline figures both hit on Wednesday, and the market will be paying close attention given how sensitive rate expectations have been to inflation surprises. Monday's quiet tape can actually be valuable — if buyers or sellers step in with conviction on no news, that tells you something meaningful about where sentiment really sits.
Market Sentiment and Key Levels
The directional bias today leans modestly bearish, though the damage was contained enough that the bulls haven't completely lost the plot. SPY shed 0.20% on below-average volume of 25.38 million shares, which is a double-edged sword — the selling wasn't aggressive, but the lack of buyers willing to step in and defend the tape isn't exactly inspiring confidence either. The Nasdaq's -0.28% and the Dow's matching -0.20% decline show broad-based softness across large-cap growth and blue chips alike, while the Russell 2000's 0.53% gain stands out as the lone bright spot, hinting that some rotation into smaller, more domestically focused names may be quietly developing beneath the surface. The one genuinely encouraging data point in today's sentiment picture is the VIX, which dropped 3.01% to 14.19 — that level signals the options market isn't pricing in fear, and a VIX that low while price drifts lower is not the signature of a market preparing to break down hard.
Key resistance sits at $778.80, today's intraday high, which was touched briefly near the open but couldn't hold. A convincing move back above that level on volume that reclaims the average would shift the short-term structure back to neutral and open the door toward the $781 to $782 zone. On the downside, $775.43 — today's session low — is the first line in the sand. A clean break below that print on expanding volume would be a meaningful warning sign, putting the $772 area in focus as the next support test. Gold's strong 1.57% advance to $4,432 and crude oil's push higher add a mild inflationary undercurrent to the macro backdrop that the Fed won't be thrilled about, and the 10-year yield's 1.19% move to 4.700% keeps rate pressure present. Bitcoin's soft session adds a touch of risk-off flavor at the margins. The bears have a slight edge in the short term, but the low VIX and small-cap resilience suggest this is more consolidation than distribution — follow-through in either direction will be the tell.
Expected Price Action
Monday's session brings actionable intelligence generated by our AI model, with SPY projected to trade within a range defined by $770 on the downside and $787 as the max upside target. That seventeen-point window well clears the consolidation threshold, meaning Monday is set up for directional movement rather than choppy sideways action. With Friday's close at $776.32 sitting in the lower half of the projected range, bears hold a slight structural edge heading into the session, though the VIX dropping 3.01% to 14.19 signals the market isn't pricing in panic — just caution.
The $780 level is the defining ceiling to watch — that's the immediate gate bulls need to clear to keep any upside momentum going. Getting through $780 with conviction opens $781 first, then $782 where heavy interest sits and price should want to stall. Above that, $784 caps the expected move top, and $787 stands as max upside. On the downside, $778 is the first level to defend and sits right under where Friday closed — losing it cleanly hands the session back to sellers in a hurry. Below $778, $775 is the most critical battleground of the session and where the heaviest fight should occur. A clean break of $775 could accelerate quickly, with $774 serving as the last real floor at the bottom of the expected move. Losing $774 leaves little cushion until $770, where buyers should step in with force as max downside support. Bias leans bearish given where Friday's close fell within the projected range, but the key test is whether bulls can reclaim $780 and sustain it, or whether sellers push through $778 early and force a real confrontation at $775. Watch those two levels — they decide Monday's direction.
Trading Strategy
The VIX dropping 3.01% to 14.19 is a constructive signal for the bulls, reflecting a further compression in fear even as the broader tape finished modestly lower. At 14.19, volatility is sitting in deeply subdued territory, which historically keeps the odds tilted toward upside resolution over time. That said, low VIX readings can also lull traders into oversizing — don't let the calm fool you into ignoring your risk parameters. Keep position sizing in the 80-90% range and hold stop-losses in the 1.0-1.25% range from entry. Confirmation matters more than anticipation at these levels, so let price lead before you commit size.
In a falling market scenario, the immediate line in the sand is $775.43, today's session low. A clean break below that level on a pickup in selling pressure opens the door to a short entry targeting $772-773, with stops placed above $778 to limit exposure on a failed breakdown. If sellers follow through below $772 with meaningful momentum, the next support zone comes in around $768-769, where a secondary profit target is worth having on the board for traders running a trailing stop. The VIX at 14.19 is not pricing in serious fear, which means shorts need to be disciplined — the market can reverse quickly at these volatility levels, and overstaying a short without flush-level confirmation is a fast way to give back gains.
In a rising market scenario, bulls first need to reclaim and hold $776.32 as an intraday base, then push convincingly through $778.80 to signal that buyers are back in control. A shallow pullback toward $775-776 that finds visible buying interest is the cleaner long entry, targeting $779-780 as the first profit zone and $782-783 on continued follow-through. Stops on longs belong below $773 to protect against a deeper leg lower. With the VIX at 14.19 and compressing further, the broader trend remains friendly to the upside — but wait for price to confirm at defined levels and let participation pick up before adding to winners.
Model’s Projected Range
SPY's projected maximum range for Monday is $772 to $781, with the Call side dominating in an expanding band that suggests trending price action with intermittent chop. Monday brings no economic news due out so the market will trade on technicals. SPY closed at $776.32, down 0.20%, after opening at $778.54, tagging a high of $778.80, and dipping to a low of $775.43 before fading into the close on below-average volume — a relatively contained session that didn't commit to a direction. SPY is trading near our model's first support at $775, keeping price in a zone where buyers and sellers are actively testing each other. If $780 breaks to the upside, the next target becomes $781, while a break below $775 opens the door toward $772, and if that level fails, there is little to keep price from falling toward $770. The long-term bull trend remains intact above $640 with SPY well above structural support. As long as price holds above key structural levels, this remains a broader dip-buying environment. Absent a catalyst, resistance sits at $780, $781, $784, $785, while support rests at $775, $772, $770, $765. We favor buying dips at $775 given SPY closed just above that model support with the Call side still dominant. Bitcoin slipped 0.73% to close above $62,939 while MAG stocks were mostly red on the day, led lower by Amazon down 0.94%, though Tesla bucked the trend with a gain of 0.68% — sustained weakness across both leadership groups would be required to signal a deeper pullback. The VIX closed at 14.19, down 3.01%, suggesting a modest reduction in fear as the market continues to digest recent price action without meaningful panic. SPY closed near the lower end of its trend channel, with structural support holding just beneath current price around the $775 area.
Market State Indicator (MSI) Forecast
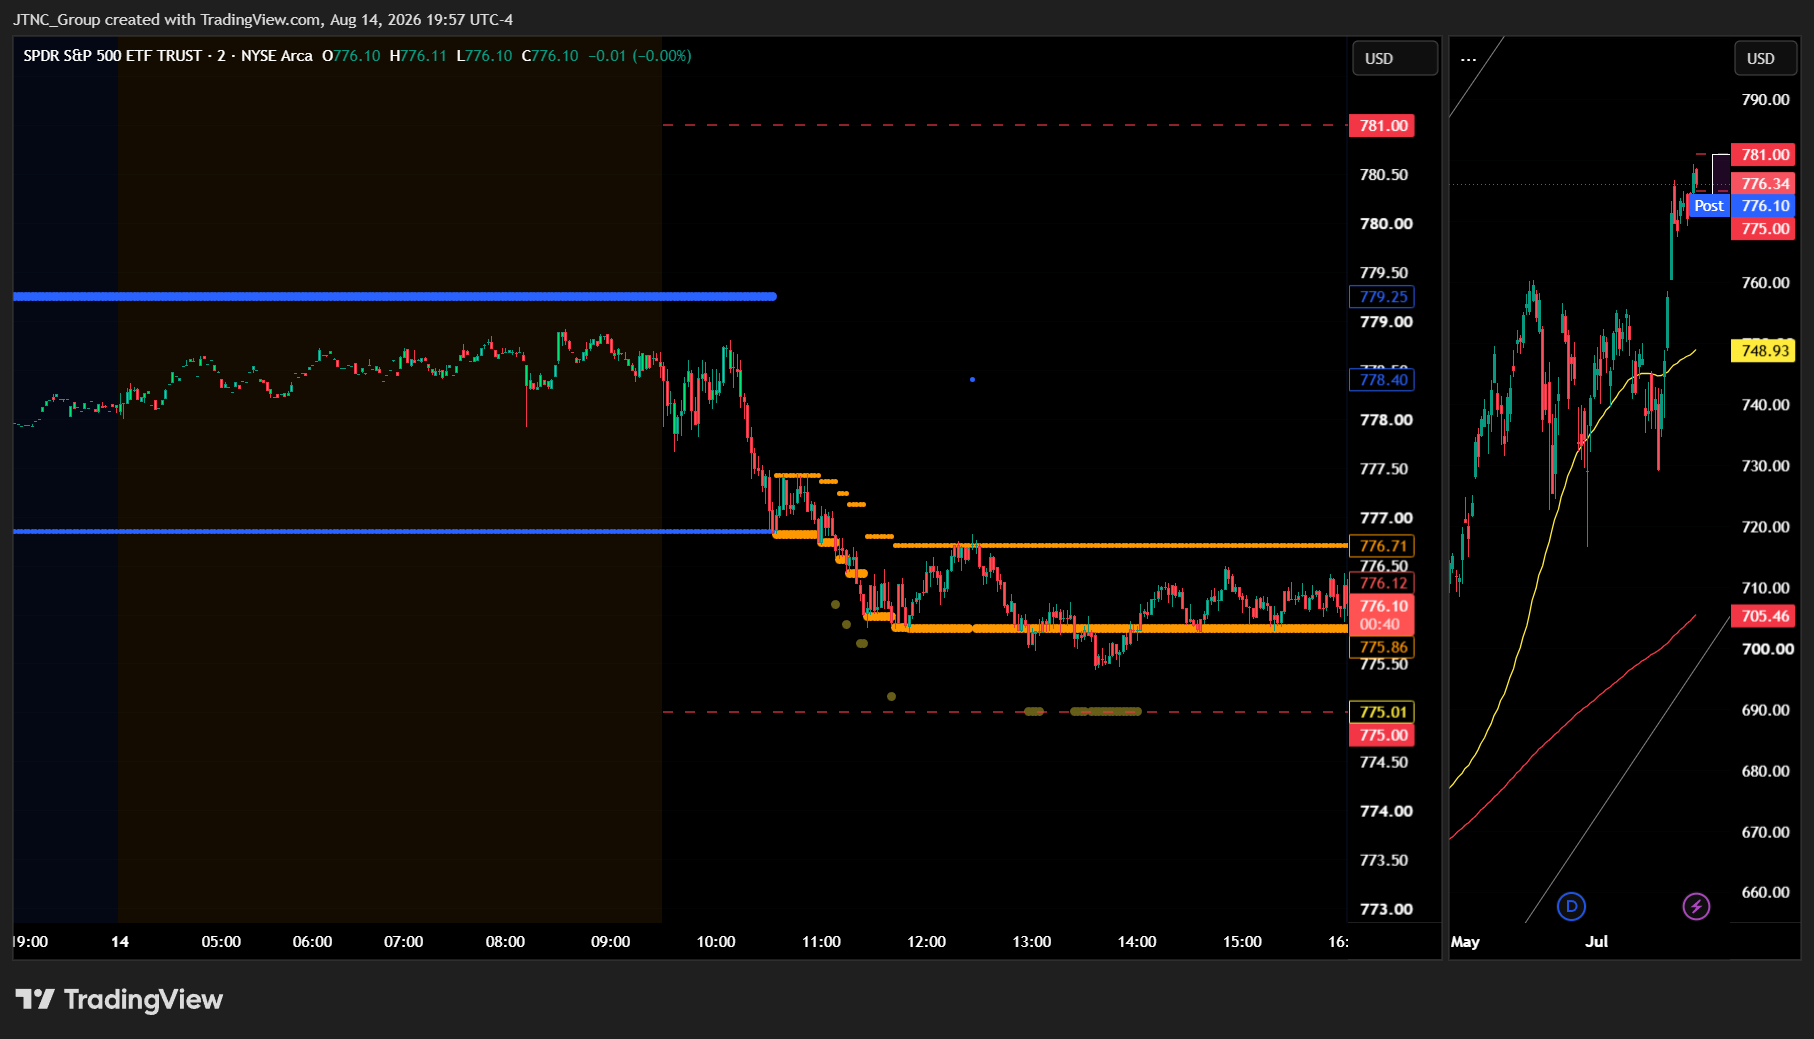
Current Market State Overview:
The MSI ended in a Bearish Trending Market State with SPY closing at $776.32. Since SPY closed inside the MSI range, support remains support and resistance remains resistance heading into Monday, with MSI support at $775.86 and MSI resistance at $776.71. Extended targets were not printing at the close, though they did print below during the AM session. The MSI did not rescale overnight and remained in a wide bullish state, but without any extended targets and with SPY sitting at major resistance just below $780, it was only a matter of time before profit taking kicked in and SPY pulled back slightly to close down 0.20%. The decline was minor and the MSI showed the way with a series of very narrow range rescalings lower in a Bearish Trending state. While extended targets did print below during the AM session, once they stopped, SPY managed to bounce off MSI support and close mid range. Without extended targets and a very tight range, the MSI is forecasting chop and a market that will likely continue to test both the highs and lows of the day's range. The MSI width is narrow at just a $0.85 spread, which reflects a market coiling rather than trending with conviction, and the narrow Bearish Trending state suggests consolidation is more probable than a sustained directional move. We stated yesterday that any test of the prior day's highs would fail on the next attempt and that is exactly what played out. The forecast for Monday is likely sideways to possibly up as the narrow bearish MSI suggests consolidation rather than strong trending. That said, the bears are likely to maintain pressure to the downside. Any failure of MSI support is likely to see SPY retest the day's lows. MSI support is $775.86 with resistance at $776.71.
Key Levels and Market Movements:
Thursday we stated, "Bulls want to see overnight price hold $776.86 as support and the MSI rescale higher with extended targets printing above," and added, "Bears want to see $776.86 fail and the MSI rescale lower with extended targets printing below. If that occurs, SPY is likely to retest Thursday's low at $774.11 and press toward lower levels beneath the session range," while also noting, "A Ranging state at the open is possible given the lack of extended targets at Thursday's close, and in that environment the highest-probability plays remain failed breakouts above $779.25 and failed breakdowns below $776.86. Let the MSI confirm its state before committing to either side." That framework played out with reasonable precision on Friday, though the bears ultimately carried the session rather than the bulls. The MSI held its wide bullish state overnight without rescaling, but with SPY pressing up against major resistance near $780 and extended targets absent, there was little fuel to sustain upside momentum into the open.
From the open, the session took on a distinctly bearish character. Price sold off sharply right out of the gate and the MSI transitioned into a Bearish Trending state, with multiple rapid rescalings lower during the AM session driving the narrative. Extended targets printed below during that stretch, giving traders a clear signal that the bears were in control and that selling rallies to MSI resistance was the dominant setup. As the AM session gave way to the PM session, the MSI remained in a Bearish Trending state, but once extended targets stopped printing, the aggressive downside momentum faded and SPY found its footing at MSI support. The rest of the session was characterized by tight, choppy action consistent with the narrow range. SPY opened at $778.54, traded a high of $778.80, a low of $775.43, and closed at $776.32, down 0.20% on volume of 25.38 million shares, which came in below average. The VIX dropped 3.01% to 14.19. The primary trade setups the MSI provided were selling rallies to MSI resistance during the AM session when extended targets were printing below and buying dips to MSI support once the downside momentum exhausted. At minimum it was a 3-for-3 session for traders following the framework. It was an easy day to read albeit not an easy day to trade given the tight choppy range. But substantial setups were present, all identified through proper context, patience, and flexibility while leveraging the MSI, premarket levels, and market structure rather than forcing trades. The MSI continues to prove its reliability as the cornerstone of our trading process.
Trading Strategy Based on MSI:
Monday has light economic news so the market is likely to move more sideways than trend given the Bearish Trending state at the close. But with such a narrow range it is also likely the MSI rescales overnight and a short squeeze ensues which will push price back to test higher levels. There are no high-impact catalysts on the calendar Monday, which means the MSI's behavior overnight and at the open will once again be the most important guide for how the session unfolds. The real fireworks on the economic calendar don't arrive until Wednesday with Core CPI and CPI data, so between now and then the market may simply be content to coil within its current range and digest the week's moves.
Given the narrow Bearish Trending close with no extended targets, Monday is likely to see continued pressure from the bears, but the lack of conviction in the MSI width makes a sustained directional move in either direction less probable than a choppy, back-and-forth session. The $0.85 spread is telling you the market is coiling, not trending, and the absence of extended targets at the close removes the fuel that would be needed to drive a clean continuation lower. That said, bears retain a modest edge heading into Monday and any failure of MSI support at $775.86 could see SPY retest Friday's low at $775.43 and press toward lower levels beneath the session range. Conversely, a short squeeze overnight or a bullish MSI rescale could flip the narrative quickly and put $776.71 and levels above back in play. Bulls want to see overnight price hold $775.86 as support and the MSI rescale higher with extended targets printing above. If that happens, the door opens for a push toward $776.71 and potentially higher toward Friday's open near $778.54. Bears want to see $775.86 fail and the MSI rescale lower with extended targets printing below. If that occurs, SPY is likely to retest Friday's low at $775.43 and press toward lower levels beneath the session range.
The most actionable setup in a narrow Bearish Trending MSI without extended targets is to sell rallies to MSI resistance at $776.71 if the Bearish Trending state persists and extended targets are not printing above, targeting $775.86 and the levels below. Alternatively, if the MSI rescales overnight into a bullish state, buying dips to $775.86 targeting $776.71 and higher becomes the preferred approach. A Ranging state at the open is entirely possible given the tight width at the close, and in that environment the highest-probability plays remain failed breakouts above $776.71 and failed breakdowns below $775.86. Do not anticipate the direction — let the MSI confirm its state before committing to either side.
The long-term bull trend remains intact above $640 and failed breakouts and failed breakdowns continue to offer the highest-probability setups. Remain flexible, avoid trading during Ranging Market States unless a clear failed breakout or breakdown presents itself, and ensure all trades are fully aligned with MSI signals. Providing real-time insights into market control, momentum shifts, and actionable levels, the MSI when integrated with our Pre-Market and Post-Market Reports continues to sharpen execution precision and elevate trade quality. If you haven't yet integrated MSI and our model levels into your process, now is the time. Contact your representative to get started as these tools are designed to support consistency and enhance performance.
Dealer Positioning Analysis
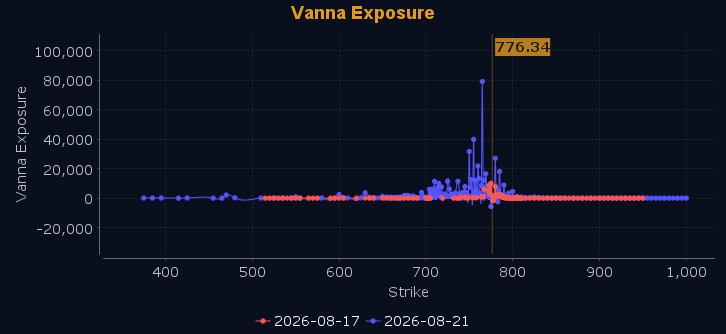
Dealers are selling SPY $779 to $800 and higher strike Calls while buying $777 to $778 Calls, indicating the Dealers' desire to participate in any rally on Monday. The ceiling for Monday appears to be $780. Notably, Dealers are no longer selling ATM Puts, which tells us they no longer have a defined floor in the market heading into Monday. That said, they are buying Calls near the money, positioning themselves to benefit from any continuation of the recent rally. To the downside, Dealers are buying $776 to $730 and lower strike Puts in a 2:1 ratio to the Calls they're selling, displaying moderate concern that prices could move lower. For Monday, below $777 is bearish and above $778 is bullish, with nothing but chop in between. There is heavy resistance at $780 and $785, while support at $775 will slow any decline. Dealer positioning is unchanged at bullish.
Looking Ahead to Next Friday:
Dealers are selling SPY $777 to $825 and higher strike Calls, indicating the Dealers' belief that prices may struggle to push meaningfully higher without a clear catalyst. The ceiling for next week appears to be $780. To the downside, Dealers are buying $776 to $700 and lower strike Puts in a 4:1 ratio to the Calls they're selling, displaying heightened concern that prices could move lower. Dealers remain hedged but have not increased their protection heading into the week. Earnings season is coming to a close and economic data points are now driving the market, with an external catalyst like an end to the war in the Middle East also capable of moving prices sharply. We recommend traders remain bullish above $776 but below $770 remain bearish, with heavy chop in between. There is major support at $770 with major resistance at $780 and $785, which will slow any ascent above these levels. For the week Dealer positioning is unchanged at bearish. We advise reviewing Dealer positioning daily for directional clues. These positions evolve quickly and tracking them is essential for staying ahead of shifting market sentiment.
Recommendation for Traders
Favor longs above $776 with stops tight below $775, and look to trim near $778–$779. A break below $775.43 flips short-term momentum bearish, so don't overstay positions if that level gives way. With the VIX dropping 3.01% to 14.19 and small caps outperforming, the tape isn't broken — but the -0.20% close on below-average volume says conviction is thin.
Keep size manageable and don't chase. Review the premarket analysis posted before 9 AM ET for any changes in the model's outlook and Dealer Positioning.
Good luck and good trading!
