
Market Insights: Tuesday, August 11th, 2026
Market Overview
US stocks slipped again Tuesday as the US-Iran standoff grew more tense, with both sides hardening their positions and dimming hopes for a Strait of Hormuz deal anytime soon. The Dow fell roughly 0.4%, the S&P 500 dropped 0.4%, and the Nasdaq slid about 0.6% as geopolitical pressure kept buyers cautious. President Trump pushed back on Iran's demand for war reparations, saying he'd let economic pressure do the work, while Iranian Foreign Minister Abbas Araghchi shut the door on talks entirely, saying there was "no possibility of restarting negotiations" under current conditions. Brent crude hovered around $88 per barrel despite a Pakistani defense minister suggesting the two sides were "close to some sort of arrangement."
All eyes are now on Wednesday's CPI report, especially after Friday's softer-than-expected jobs data shifted bets toward a Fed rate hike in September. Cleveland Fed President Beth Hammack told Yahoo Finance on Monday that it may take more than one rate hike to bring inflation to heel. The persistently elevated oil prices are only adding to that pressure. Big Tech was broadly in the red, with Alphabet, Apple, and Amazon all declining, while renewed scrutiny over capital-intensive AI spending weighed on sentiment. After the bell, earnings from CoreWeave and Super Micro Computer are expected to give markets a clearer read on the health of the AI hardware business.
SPY Performance
SPY opened at $774.53 and almost immediately ran into resistance, tagging a session high of $774.61 before sellers stepped in and pushed price steadily lower throughout the day. The low of $769.34 represented the bulk of the damage, and while SPY managed to close slightly off that low at $770.59, the recovery was modest at best. The tight spread between the open and the high tells you buyers had very little interest in pushing this thing higher — the high was essentially the open, which is not a great sign for the bulls.
SPY finished down 0.32% on the day, a modest decline in percentage terms but one that came with some technical damage given how cleanly price rejected the open and trended lower. Volume came in at 30.25 million shares, below average, so the selling pressure wasn't exactly a stampede — but when price drifts lower on quiet volume, it often reflects a lack of buyers rather than aggressive sellers, which carries its own kind of cautionary message. The VIX dropped 0.84% to close at 15.33, which is a bit of an odd companion to today's softness in price. Typically you'd expect volatility to tick up on a down day, so the fact that it eased slightly suggests the market isn't exactly panicking here. That said, two consecutive sessions of below-average volume and choppy price action without any meaningful upside follow-through keeps the near-term picture somewhat cautious. The path of least resistance hasn't definitively shifted, but the bulls are going to need to show up soon before this consolidation starts looking more like distribution.
Major Indices Performance
The Russell 2000 was the standout of the session, bucking the broader red tape with a gain of 0.37%. Small-caps flipping green while large-cap indices struggled is an interesting divergence — it can sometimes signal a brief rotation into riskier, more domestically focused names, though one day of outperformance from the Russell doesn't exactly constitute a trend. Still, after a string of sessions where small-caps were leading the pain train, any green close is worth noting.
The Dow slipped 0.34%, holding up slightly better than the Nasdaq but still unable to find any real footing. Blue-chip names couldn't shake the broader market unease, and while the decline wasn't dramatic, it was consistent with a tape that had no conviction behind it. The index didn't crater, but it didn't offer bulls anything to work with either.
The Nasdaq was the weakest of the major indices today, falling 0.60% in a session weighed down by meaningful pressure in some of the index's largest and most influential components. When heavyweight growth names drag, the Nasdaq tends to feel it more acutely than its peers, and that's exactly what played out here. The S&P 500 also finished in the red, adding to a picture of a market that couldn't find its footing across the board. With the Nasdaq underperforming and only small-caps managing to close higher, the session had a mixed and somewhat directionless feel — not the kind of tape that inspires confidence from either bulls or bears.
Notable Stock Movements
Alphabet took the crown as the worst performer in the Magnificent Seven today, and it wasn't particularly close — the stock cratered -3.84% in what was a genuinely ugly single-session drop that cast a long shadow over the entire cohort. A loss of that magnitude from one of the group's heavyweights has a way of poisoning the well, regardless of what else is happening around it. Alphabet carries significant weight in the AI narrative, the digital advertising story, and the broader mega-cap conversation, so when it slides that hard, traders across the growth complex take notice and start asking uncomfortable questions about whether the premium valuations in this space are still justified.
The rest of the Magnificent Seven leaned mostly red alongside Alphabet, which made for a difficult day across the group as a whole. The only names that managed to fight their way into positive territory were Meta and Tesla, and while it's worth acknowledging they kept their heads above water, two green names against a backdrop of broader weakness isn't the kind of participation that inspires confidence. When the majority of the Magnificent Seven are declining on the same day, the damage tends to ripple outward into the broader tech tape and reinforces a defensive tone across the market.
What makes today's performance particularly notable is that it wasn't an isolated pocket of weakness — it aligned cleanly with the Nasdaq's -0.6% session, which was the hardest hit of the major indices. The Magnificent Seven as a group essentially drove that underperformance. The Russell 2000 managing to finish green at the same time tells an interesting story about rotation — money wasn't fleeing the market entirely, it was just clearly moving away from the high-multiple growth names that dominate this cohort. With sentiment already running low-conviction and the VIX settling at 15.33, the market isn't panicking, but it's also not in any rush to pile back into the names that drove yesterday's losses either.
Commodity and Cryptocurrency Updates
Crude oil pushed higher again, adding another 1.58% to settle at $83.43, and the trend here is impossible to ignore. The commodity has now rallied well above recent expectations and continues to show no interest in pulling back. Supply dynamics and persistent demand are keeping a floor under prices, and with crude firmly entrenched in the low-to-mid $80s, energy costs are becoming a genuine headache for anyone hoping inflation cools quietly on its own. A sustained run at these levels could complicate the Fed's path forward if energy keeps adding fuel to the broader inflationary picture — and right now, there's little on the horizon suggesting that pressure is about to ease.
Gold added another 1.55% today, closing at $4,429, and the rally continues to impress. The metal is building on an already extraordinary run, and the fact that buyers keep showing up rather than locking in profits speaks to the depth of conviction behind this move. Uncertainty, central bank demand, and inflation concerns are all still very much in play, and the record-setting pace of this advance shows no signs of fatigue.
Bitcoin dipped 0.48% today, closing just above $63,605. After the volatility of recent sessions, a pullback of this size is relatively tame, and the $63,000 to $64,000 zone continues to serve as a meaningful support area. The market appears to be digesting rather than deteriorating, and as long as Bitcoin keeps finding buyers near this floor, the broader setup remains intact.
Treasury Yield Information
The 10-year Treasury yield offered a small but welcome concession today, slipping 0.32% to close at 4.680%. It's not a dramatic move, but in the current environment, any step back from the edge matters. After yesterday's climb pushed yields uncomfortably close to the 4.8% danger zone, today's pullback at least stops the bleeding and gives equity bulls something to point to — even if the overall picture remains tense.
At 4.680%, the yield is still sitting 18 basis points above the 4.5% threshold where equity pressure becomes a real factor. That means the underlying drag on stock valuations hasn't gone away — it's just eased slightly. The gap to 4.8% has widened back out to 12 basis points, which sounds modest but is a meaningful improvement from yesterday's razor-thin 10-basis-point cushion. The market is still walking a tightrope, just with slightly better footing today.
The broader pattern, though, hasn't changed. Yields dip a few basis points, the market exhales, and then the grind resumes. One day of modest relief doesn't erase the trend, and the 4.8% level continues to loom as the line in the sand. A closing breach there is what triggers more serious and broad-based selling under this framework. The 5% and 5.2% levels — where real damage and potential correction territory begin — remain the ultimate risk scenarios to keep on the radar. For now, watch whether today's pullback has any follow-through. A sustained move back toward 4.6% would meaningfully change the pressure on equities. Without it, the bond market stays in control.
Previous Day’s Forecast Analysis
Yesterday's forecast projected SPY trading within a defined range of $767 on the downside and $780 as the maximum upside target — a thirteen-point window wide enough to signal directional potential rather than a choppy consolidation session. The bias heading into Tuesday was cautiously bullish, with Monday's close at $773.05 sitting near the middle of the range and the call-dominated environment giving bulls a modest edge. The critical battleground identified was $775, flagged as the level that needed to be cleared with conviction to resume the uptrend. Above there, the model mapped a path through $776, then $777, with $779 leading into $780 as the expected move ceiling. On the downside, $773 was the first line of defense, with $772 and $771 as the next levels of concern. Below $771, $770 was highlighted as the most important round-number floor, and a clean break of that level would flip the tone decidedly bearish and put $767 in play.
The trading strategy called for trimmed position sizing in the 75-85% range given the VIX rising 3.49% to 15.42, which was characterized as a mild caution signal rather than a full alarm. Stop-losses were recommended in the 1.0-1.25% range from entry, with patience emphasized before committing size in either direction. On the short side, a failure to hold $771.89 on a retest was the trigger for a short targeting $768-769 with stops above $775, and a breakdown through $768 on volume opened a target of $763-764. On the long side, a clean breakout above $775.03 with improving participation targeted $778-779, while a more conservative entry looked for a pullback toward $770-771 that stabilized with visible buying, targeting $773 first and $775-776 on follow-through. Confirmation of volume at entry was stressed throughout, with the nudging VIX serving as a reminder not to front-run moves on a quiet tape.
Market Performance vs. Forecast
Tuesday's session opened at $774.53, stepping into the upper portion of the projected range and right into the territory the forecast identified as contested ground — the zone between $773 and $775 where the bulls needed to show up with conviction to extend the trend. The open held above $773, which the model flagged as the key line of defense for the upside thesis, and the early tape briefly tested that bias before sellers gradually took control. The intraday high of $774.61 confirmed that the $775 resistance level the forecast identified as the heaviest battleground continued to act as a ceiling, rejecting price just as the model projected and keeping the breakout scenario off the table without clean confirmation.
The close at $770.59 landed below the $771-$772 support zone the forecast outlined as the first area where weakness would be tested, representing a modest drift lower on below-average volume of 30.25 million shares. The falling market scenario specifically identified $771-$772 as the critical zone to watch on any early softness, and Tuesday's session ultimately confirmed that the downside architecture was the more relevant roadmap for the day. The $773 pivot the forecast designated as the line bulls needed to defend was tested and ultimately surrendered, which the framework explicitly noted would stall the reclaim attempt and bring lower levels into view — and that's exactly how it played out. The model does not account for unpredictable external catalysts that can tilt sessions decisively in one direction without warning, and those forces can produce price action that extends beyond the base case. Importantly, the recommended stop discipline — keeping stops in the 1.0-1.25% range from entry — meant risk management protocols protected capital as the tape faded. The VIX's mild pullback of 0.84% to 15.33 kept the volatility picture contained, consistent with the framework's read that 15-handle VIX environments don't typically generate panic-driven follow-through. The directional levels, the resistance at $775, and the support zones all remained operative throughout the session, and that structural precision is exactly what the framework is built to deliver.
Premarket Analysis Summary
The premarket analysis posted at market open identified SPY spot at $774.30 in a call-dominated tape, framing the session around a compressed expected move of just 5 points and warning that participants weren't positioned for a big swing — making it a tape where one side would have to force the issue. The critical gate above was set at $775, described as the heaviest concentration zone of the day and the level bulls needed to reclaim and hold to open the door to $776, $778, and eventually $779 as the top of the expected move. A push through $779 with conviction was required to reach the max upside target of $782. On the downside, $773 was identified as the first line of defense where buyers should step in, $772 was the line in the sand where selling could accelerate and the tape thin out quickly, $770 was the last meaningful cushion inside the range, $769 marked the bottom of the expected move, and $765 was the max downside target where major support would finally come in. The analysis made clear the session would come down to which side of $775 and $772 broke first.
The actual session resolved firmly to the downside. SPY opened at $774.53, briefly poked at $774.61 as the session high, and never made a serious run at the $775 gate — sellers took control early and the tape dropped straight through the $773 defense line and then the $772 line in the sand without much of a fight. The low of $769.34 pushed into the $769 bottom-of-range target, validating the downside roadmap almost exactly, and the session closed at $770.59 — a loss of 0.32% on below-average volume of 30.25 million shares. The premarket warning about $772 triggering acceleration proved accurate, as the tape thinned out on the break and didn't find real footing until the $769-to-$770 zone. The VIX dropping 0.84% to 15.33 is a mild disconnect from the selling pressure, suggesting the move was orderly rather than panicked, but the failure to defend either key level leaves the bulls in a difficult position heading into the next session.
Validation of the Analysis
Tuesday's session validated the premarket framework from the first tick to the closing bell, with SPY respecting the mapped levels in sequence and giving traders clear, actionable reads throughout the day. The premarket identified 775 as the gate and the heaviest concentration zone of the session — SPY opened at $774.53, tagged a high of just $774.61, and never once threatened to reclaim that level with any conviction. That ceiling held like a wall, confirming the analysis was right to frame 775 as the defining line bulls had to clear, and the failure there effectively handed the tape to sellers before the morning session had any time to develop.
From there, the downside levels took over exactly as the premarket described. The analysis warned that losing 773 cleanly would give sellers control, and that 772 was the line in the sand where selling could accelerate and the tape gets thin in a hurry — Tuesday's price action followed that script precisely. Once SPY sliced through 773 and 772 without meaningful defense, the selling didn't stop until the session low of $769.34 drove directly into the 769 level the premarket named as the point of last hope at the bottom of the expected move. That level caught the low almost to the tick, and the recovery from there carried SPY back to close at $770.59, right inside the support zone the analysis flagged. Traders who had 769 to 770 circled as a long entry with a stop below 765 had a clean, well-defined setup with a confirmed floor beneath them. The VIX dropping 0.84% to 15.33 into the close reflected the stabilization that came once SPY found its footing at those premarket-defined lows. From the rejection at 775 to the flush through 773 and 772 to the precise hold at 769, this session was another strong confirmation of the framework's value.
Looking Ahead
Wednesday brings the inflation data the market has been bracing for, with Core CPI month-over-month, Core CPI year-over-year, headline CPI month-over-month, and headline CPI year-over-year all dropping at once. This is the kind of release that can reprice everything in a hurry — rate expectations, bond yields, and equity valuations all hang in the balance when the inflation numbers hit the tape.
A hotter-than-expected print will likely reignite fears that the Fed has more work to do, putting pressure on equities and sending yields higher. A cooler read, on the other hand, could fuel a relief rally and give bulls the ammunition they need to push prices toward resistance. Either way, the market will have something concrete to trade off of, so make sure your levels are mapped out and your risk is defined before the data lands.
Market Sentiment and Key Levels
The directional bias today leans slightly bearish, though not alarmingly so. SPY slipped -0.32% and closed well off its opening print, spending most of the session below where it started — that's a mildly negative structure. Volume came in at 30.25 million shares, below average, meaning the selling lacked conviction but also lacked any meaningful buying interest to push back. The encouraging sign is the VIX, which actually dropped 0.84% to 15.33, suggesting the options market isn't pricing in panic. When price drifts lower but fear gauges pull back, it often points to controlled repositioning rather than outright distribution. Bears are nudging this tape, but they haven't taken the wheel just yet.
Key resistance sits at $774.61, today's intraday high, which was tested almost immediately at the open and rejected. A sustained reclaim of that level on better-than-average volume would shift momentum back toward the bulls and open a path toward the $777 to $779 zone, where overhead supply likely builds. That move would need to be confirmed by broader participation — small-caps showed some resilience today, gaining 0.37%, which is at least a partial green flag if it carries forward. On the downside, $769.34 is the session low and the immediate support level to watch. A decisive break below that on rising volume would be a warning sign, potentially opening the door to a test of the $766 to $767 area. Gold climbing 1.55% to $4,429 and crude oil firming up add a layer of inflationary noise that keeps the Fed narrative complicated and limits how aggressively bulls can lean in. Yields remain a factor worth watching. The path of least resistance is sideways to slightly lower until the bulls can show up with real volume behind them.
Expected Price Action
Wednesday's session brings actionable intelligence generated by our AI model, with SPY projected to trade within a range defined by $765 on the downside and $782 as the max upside target. That seventeen-point window clears the trending threshold comfortably, meaning Wednesday is set up for directional movement rather than sideways consolidation. With Tuesday's close at $770.59 sitting in the lower half of the projected range, the bears have a modest structural edge heading into the session, though the VIX dropping 0.84% to 15.33 suggests the market isn't pricing in serious fear just yet.
The $775 level is once again the defining battleground. The premarket model identified it as the gate and the heaviest concentration zone of the day — reclaiming it with conviction would shift the tone bullish in a hurry and open the door to $776, then $778 where the next meaningful stall is expected. Above $778, $779 marks the top of the expected move, and a clean break there with real momentum puts $782 in play as max upside. On the downside, $773 is the first level bulls need to defend — losing it cleanly hands control to the sellers and brings $772 into focus as the line in the sand where selling could accelerate quickly. Below $772, $770 becomes the next real floor and carries significant interest, followed by $769 as the point of last hope at the bottom of the expected move. A failure at $769 opens $765 as the max downside target where major support finally comes in. Bias is modestly bearish given where Tuesday closed within the range, but the bulls can flip the script quickly if $775 gets reclaimed and holds. Watch $772 and $775 as the two levels that decide Wednesday's direction.
Trading Strategy
The VIX dropping 0.84% to 15.33 is a mildly constructive signal heading into the next session, suggesting options traders aren't rushing to add protection despite the modest pullback across the major indices. A reading of 15.33 sits in comfortable low-volatility territory, which normally supports a relaxed risk environment — but with below-average volume accompanying today's softness, the lack of participation cuts both ways. Bulls shouldn't read the calm VIX as an all-clear to overload exposure, and bears shouldn't expect a panic-driven breakdown without a fresh catalyst. Keep position sizing in the 80-90% range, maintain stop-losses in the 1.0-1.25% range from entry, and wait for volume confirmation before adding size in either direction.
In a falling market scenario, the first level to watch is $769-770, which the session already tested and barely held. A clean breakdown below $769.34 on a retest with pickup in selling pressure opens a short entry targeting $765-766, with stops placed above $773 to protect against a bull recovery. If sellers push through $765 with conviction, the next meaningful support zone sits at $762-763, where a second profit target becomes available for traders who sized in earlier and are managing a trailing stop. Avoid pressing shorts aggressively at current levels without a momentum shift — at 15.33 the VIX is not signaling the kind of fear needed to sustain a sharp waterfall decline, and snap reversals are very much in play in this environment.
In a rising market scenario, bulls need to reclaim $773 early and hold it as a base before any push toward $775 becomes credible. A clean move back through $774.53 with improving participation targets $777-778 as the next profit zone, with $771 serving as the key intraday pivot that must hold on any dip. The more conservative long entry is a pullback toward $769-770 that stabilizes with visible buying pressure, targeting $773 as the first profit area and $775-776 on follow-through. Stops on longs belong below $767 to guard against a deeper slide. With the VIX at 15.33 and drifting lower, the tape is more likely to reward patience than aggression — wait for clean price action at your levels before committing, and let volume confirm the move before adding.
Model’s Projected Range
SPY's projected maximum range for Wednesday is $764 to $778, with the Put side dominating in an expanding band that suggests trending price action with intermittent chop. Wednesday brings Core CPI m/m, Core CPI y/y, CPI m/m, and CPI y/y data, all of which are high-impact inflation reads likely to produce significant volatility particularly in the first hour of trading. SPY closed at $770.59, down 0.32% on the session, opening at $774.53, tagging a high of $774.61 early before sellers pushed price down to a low of $769.34, with volume coming in lower than average. SPY is trading near our model's first support at $770, and inflation sensitivity remains elevated as markets continue to parse the Fed's next move against sticky price data. If the first resistance at $775 breaks, SPY targets $778 next, while a break of $770 support opens the door to $765, and if that level fails there is little to keep price from falling toward $760. The long-term bull trend remains intact above $640 with SPY well above structural support. As long as price holds above key structural levels, this remains a broader dip-buying environment. Absent a catalyst, resistance sits at $775, $778, $780, $785, while support rests at $770, $765, $764, $760. We favor buying dips at $770 given SPY closed right at that first support level and the range still has room to the upside. Bitcoin slipped 0.48% to close above $63,605 and MAG stocks were mostly red across the board led lower by Alphabet which dropped 3.84%, with Meta the lone bright spot rising 0.71%, and sustained weakness across both leadership groups would be required to signal a deeper pullback. The VIX closed at 15.33, down 0.84%, suggesting modest easing of near-term fear though Wednesday's CPI print could quickly reverse that calm. SPY closed near the lower line of the trend channel with structural support near $770, keeping the broader uptrend intact but requiring a hold here to avoid a deeper retest.
Market State Indicator (MSI) Forecast
Current Market State Overview:
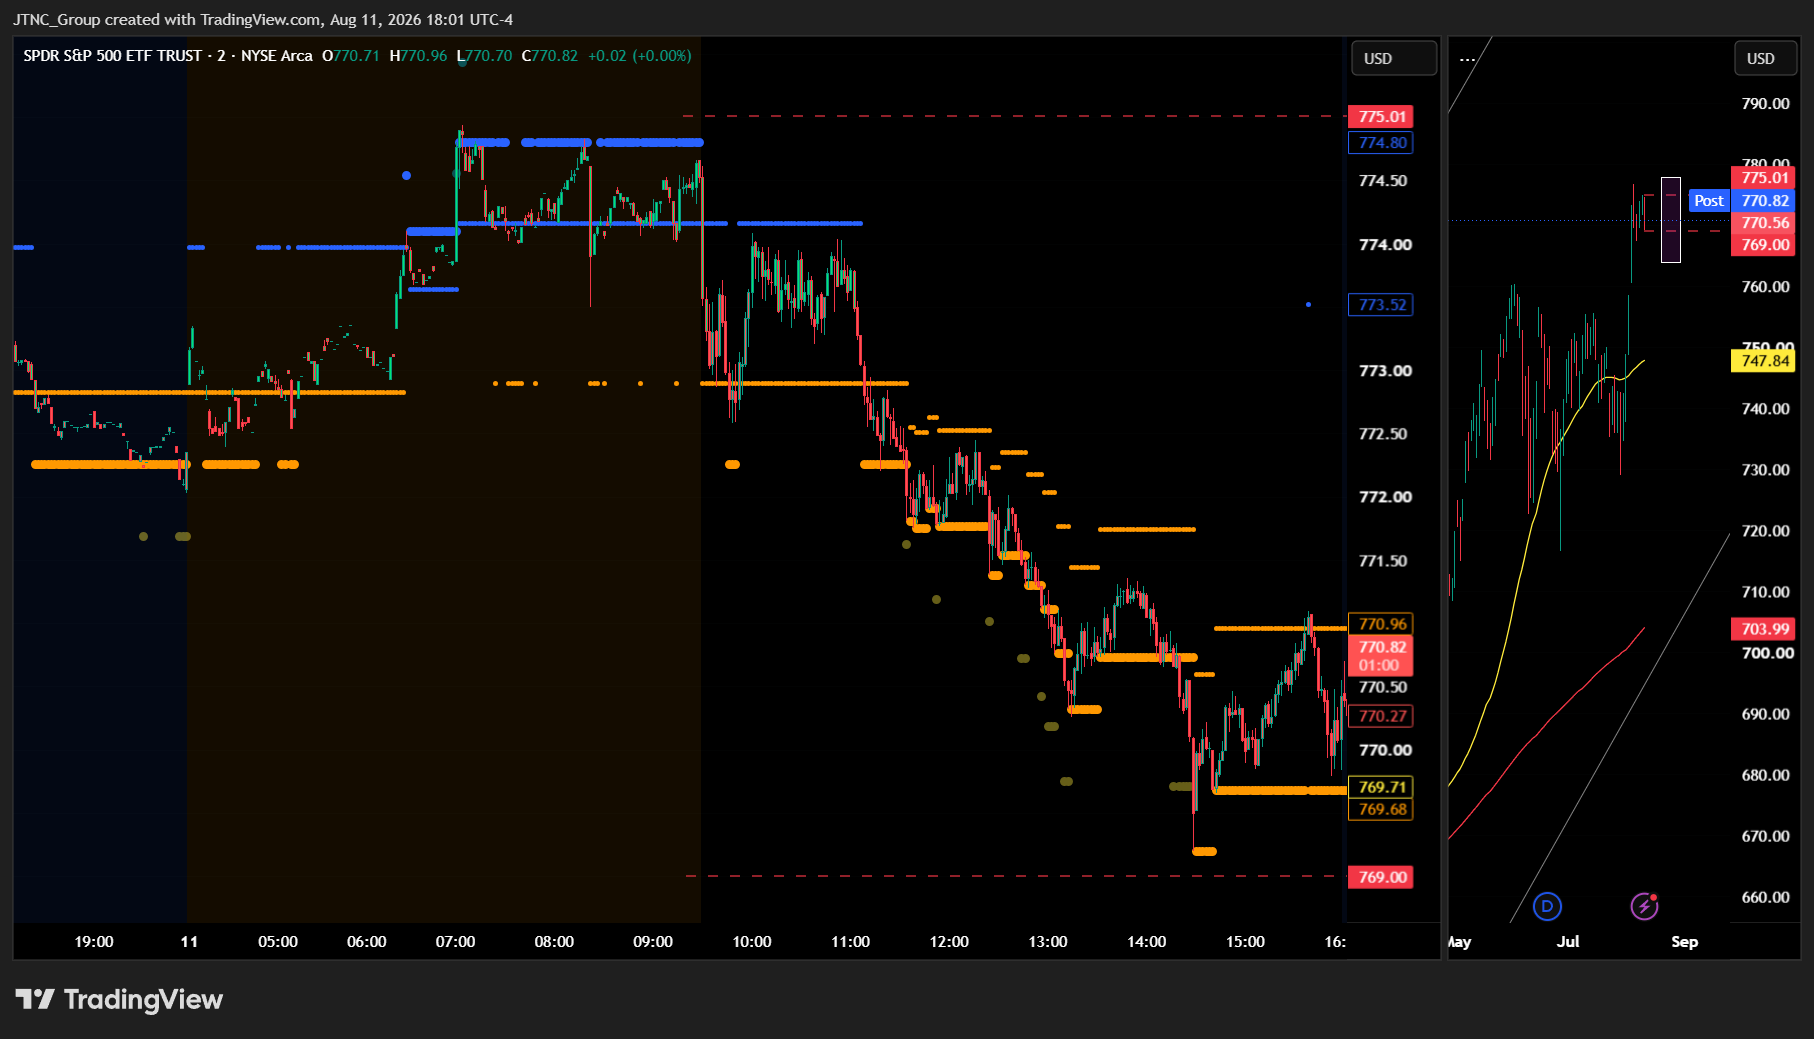
The MSI ended in a Bearish Trending Market State with SPY closing at $770.59. Since SPY closed inside the MSI range, support remains support and resistance remains resistance heading into Wednesday, with MSI support at $769.71 and MSI resistance at $770.96. Extended targets were not printing at the close, though they did print below during both the AM session and the PM session. In premarket, no extended targets were visible. The MSI rescaled higher overnight into a Ranging state, but continued to flip between a Bearish state and a Ranging state heading into the open. Just before the open the MSI rescaled higher into a very narrow Bullish Trending state, but without extended targets printing above there was little impetus to push price beyond major resistance at $775. That level held, and SPY fell through MSI support, sending the MSI rescaling lower to a Ranging state where price spent most of the morning. Eventually that too gave way and the MSI began a series of rescalings lower in narrow Bearish Trending states. Extended targets began printing below and SPY continued lower for the remainder of the session, finding a base near $769 when extended targets stopped printing. The MSI remained in a Bearish Trending state but rescaled slightly higher, signaling the move down had found a floor. Into the close SPY stayed mid-channel in a Bearish Trending state, which implies weakness heading into Wednesday but without extended targets it is equally likely SPY simply tests both the lows and highs of Tuesday's range. CPI data is due Wednesday premarket, which adds a meaningful catalyst that could force the MSI's hand in either direction, so following the MSI's lead at the open will be essential. The MSI range is narrow at a $1.25 spread, indicating tight consolidation and a market coiling for its next move. The forecast for Wednesday is likely sideways to possibly up as the narrow Bearish Trending MSI suggests consolidation rather than strong trending. That said, the bears are likely to maintain pressure to the downside. Any failure of MSI support is likely to see SPY retest the day's lows. MSI support is $769.71 with resistance at $770.96.
Key Levels and Market Movements:
Monday we stated, "Bulls want to see overnight price hold the flipped support at $772.83 and the MSI rescale into a Bullish Trending state with extended targets printing above," and added, "Bears want to see $772.83 fail and the MSI rescale lower with extended targets printing below. If that occurs, SPY is likely to retest Monday's low at $771.89 and press toward lower levels beneath the session range," while also noting, "Do not anticipate — let the MSI confirm the state at the open before committing to either side." That forecast held up well through Tuesday's session, and the bears ultimately delivered on the breakdown scenario with conviction. The bulls could not hold $772.83 overnight and the MSI rescaling into a narrow Bullish Trending state just before the open without extended targets above proved to be a false dawn. Major resistance at $775 capped the move immediately, and from there SPY rolled over and fell through MSI support, triggering the Ranging state that the MSI had been telegraphing with its overnight indecision. That setup alone gave disciplined traders a clean opportunity to sell the failed push at $775, targeting MSI support and the levels below.
Once the morning Ranging state gave way to the Bearish Trending state with extended targets printing below, the path of least resistance was clearly lower. The MSI rescaled lower several times in succession, each rescale confirming fresh bearish momentum and giving traders a framework to sell rallies to new MSI resistance levels and target the next support below. The low of the day came in at $769.34 when extended targets stopped printing, and the MSI rescaled slightly higher, identifying $769 as the base of the move. SPY opened at $774.53, traded a high of $774.61, a low of $769.34, and closed at $770.59, down 0.32% on volume of 30.25 million shares, which came in below average. The VIX dropped 0.84% to 15.33. At minimum it was a 3-for-3 session for traders following the framework. It was an easy day to read albeit not an easy day to trade given the tight choppy range. But substantial setups were present, all identified through proper context, patience, and flexibility while leveraging the MSI, premarket levels, and market structure rather than forcing trades. The MSI continues to prove its reliability as the cornerstone of our trading process.
Trading Strategy Based on MSI:
Wednesday has heavy economic data with Core CPI m/m, Core CPI y/y, CPI m/m, and CPI y/y which can introduce significant volatility, so traders should be ready to trade what they see rather than predict. This is not a session to front-run a directional thesis — the MSI will rescale in response to the data and its initial state at the open will set the tone for the day. A hot print could send extended targets printing below and accelerate the bearish pressure already evident in Tuesday's close, while a soft print could trigger a sharp squeeze that pushes the MSI into a Bullish Trending state with extended targets above and sends SPY back toward the highs of the prior session and beyond.
Given the narrow Bearish Trending close, Wednesday may continue the downward pressure but is equally likely to see a relief rally or an overnight rescale higher given how compressed the $1.25 spread remains. Neither side has a strong edge heading in without knowing how the CPI data lands, which makes the MSI's first rescale of the session the most important signal of the day. Bulls want to see overnight price hold $769.71 as support and the MSI rescale into a Bullish Trending state with extended targets printing above. If that happens, the door opens for a retest of Tuesday's high at $774.61 and a push back toward $775 and beyond. Bears want to see $769.71 fail and the MSI rescale lower with extended targets printing below. If that occurs, SPY is likely to retest Tuesday's low at $769.34 and press toward lower levels beneath the session range.
The most actionable setup in a data-driven session with a narrow Bearish Trending MSI is to buy dips to $769.71 if it holds as support, targeting a move back toward $770.96 and higher, or to sell rallies to $770.96 if it holds as resistance, targeting $769.71 and the levels below. Do not anticipate — let the CPI reaction settle and wait for the MSI to confirm its state before committing to either side. A Ranging state at the open is entirely possible given Tuesday's close, and in that environment the highest-probability plays remain failed breakouts above $770.96 and failed breakdowns below $769.71. Trade the rejection, not the breakout, until the MSI gives a clear trending signal with extended targets to back it up.
The long-term bull trend remains intact above $640 and failed breakouts and failed breakdowns continue to offer the highest-probability setups. Remain flexible, avoid trading during Ranging Market States unless a clear failed breakout or breakdown presents itself, and ensure all trades are fully aligned with MSI signals. Providing real-time insights into market control, momentum shifts, and actionable levels, the MSI when integrated with our Pre-Market and Post-Market Reports continues to sharpen execution precision and elevate trade quality. If you haven't yet integrated MSI and our model levels into your process, now is the time. Contact your representative to get started as these tools are designed to support consistency and enhance performance.
Dealer Positioning Analysis
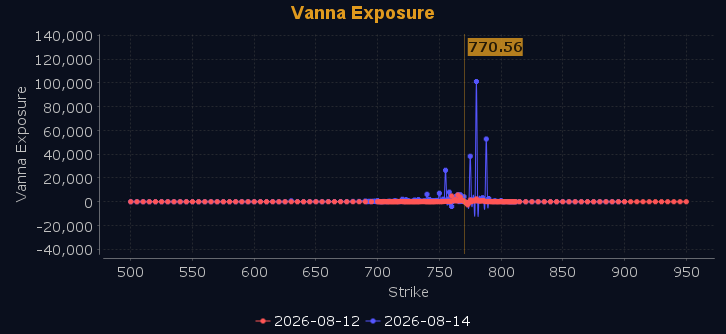
Dealers are selling SPY $775 to $810 and higher strike Calls while buying $771 to $774 Calls, indicating the Dealers' desire to participate in any rally on Wednesday. The ceiling for Wednesday appears to be $780. Notably, Dealers are not selling ATM Puts, which tells us they are not yet certain a rally will develop. They have not increased their hedges, implying a market that is relatively balanced and may need some time to consolidate before continuing higher, absent an external catalyst. To the downside, Dealers are buying $770 to $720 and lower strike Puts in a 3:1 ratio to the Calls they're selling, displaying moderate concern that prices could move lower. For Wednesday, below $774 is bearish and above $775 is bullish, with nothing but chop in between. There is heavy resistance at $777 and $780, while support at $771 will slow any decline. Dealer positioning is unchanged at neutral/slightly bullish.
Looking Ahead to Next Friday:
Dealers are selling SPY $771 to $820 and higher strike Calls, indicating the Dealers' belief that prices may struggle to push meaningfully higher without a clear catalyst. The ceiling for next week appears to be $780. To the downside, Dealers are buying $770 to $700 and lower strike Puts in a 4:1 ratio to the Calls they're selling, displaying heightened concern that prices could move lower. Dealers remained hedged but have not increased their protection heading into the week. With earnings season winding down, the next directional move will likely come from an economic data point or an external catalyst such as a resolution to the war in the Middle East. We recommend traders remain bullish above $775 but below $771 remain bearish, with chop in between. There is major support at $770 with major resistance at $780, which will slow any ascent above these levels. For the week Dealer positioning is unchanged at bearish. We advise reviewing Dealer positioning daily for directional clues. These positions evolve quickly and tracking them is essential for staying ahead of shifting market sentiment.
Recommendation for Traders
With SPY closing at $770.59 and the VIX easing to 15.33, the tape isn't screaming danger, but it isn't flashing green either. Favor longs on a hold above $769 with stops below that level, and look to trim near $774 if price struggles to reclaim Thursday's open. Small-caps showed relative strength, so keep that on your radar for rotation plays.
Size down given below-average volume and stay disciplined with stops — one headline can flip the script fast. Review the premarket analysis posted before 9 AM ET for any changes in the model's outlook and Dealer Positioning.
Good luck and good trading!
