Market Insights: Wednesday, July 9th, 2025
Market Overview
Stocks pushed higher Wednesday, fueled by a historic milestone from Nvidia and despite mounting trade concerns. Nvidia surged intraday to briefly surpass a $4 trillion market cap making it the first company ever to reach that threshold, before closing just below the level. The gains helped propel the Nasdaq to a fresh record close at 20,611.34. Nvidia finished up 1.6%, clinching a new all-time high and claiming the title of the most valuable publicly traded company in history. The broader market followed suit, with the S&P 500 up 0.6% and the Dow gaining nearly 0.5%.
These gains came even as President Trump escalated his tariff campaign, unveiling additional trade notices with 20%-30% levies aimed at countries including the Philippines, Libya, and Iraq. He reaffirmed that no extensions would be granted past the August 1 deadline. Markets absorbed the headlines with some volatility but showed resilience, with major indices rebounding into the close. Meanwhile, copper prices, which spiked the day prior on tariff news, cooled slightly. On the monetary policy front, the Fed’s June minutes revealed only a couple of officials favored rate cuts as soon as this month. While the broader tone suggested patience, markets held onto hopes for rate relief later this year.
SPY Performance
SPY advanced 0.59% on Wednesday to close at $623.99, reversing two days of slight declines. The ETF opened at $622.77 and traded between a low of $620.91 and a high of $624.72. Volume clocked in at 61.04 million shares, slightly above average. Despite intraday volatility sparked by renewed tariff chatter, buyers maintained control throughout the session, especially after an early dip was met with strong support near $621. The close just below key resistance signals renewed bullish momentum heading into Thursday.
Major Indices Performance
The Russell 2000 led the charge Wednesday with a 1.06% gain as small caps extended their rebound. The Nasdaq followed with a 0.95% climb, setting a new record driven by strength in Nvidia and other big tech names. The S&P 500 rose 0.6%, while the Dow added 0.49%, helped by a broad-based rally in equities. Sector action tilted positive, particularly in tech and discretionary names. Despite lingering trade tensions and policy uncertainty, investor appetite remained intact as optimism around AI and earnings season buoyed risk sentiment.
Notable Stock Movements
The Magnificent Seven saw a broadly green session, led by Nvidia’s 1.6% rally to new highs that helped propel the tech-heavy Nasdaq to record levels. Amazon, Apple, Meta, Alphabet, Microsoft, and Netflix all logged gains of more than 1%, reflecting widespread bullish sentiment across mega-cap tech. Tesla was the lone outlier, slipping 0.63% in an otherwise upbeat tape. The group’s collective strength highlights investor conviction in AI and big tech narratives, even as the macro landscape remains uncertain.
Commodity and Cryptocurrency Updates
Crude oil ended the day nearly flat, inching down just 0.01% to settle at $68.32. The price action continues to reflect broader macro uncertainty, though our model still forecasts a gradual move toward $60 in the coming months. Gold rebounded 0.20% to $3,323 after recent declines, holding firm amid steady yields. Bitcoin jumped 2.35%, closing above $111,200, as crypto markets extended gains and consolidated around critical long-term support levels. While headline risks persist, digital assets appear to be benefiting from a broader rotation back into risk.
Treasury Yield Information
The 10-year Treasury yield fell 1.72% to close at 4.340%, offering a mild reprieve to equity valuations after several sessions of steady increases. Yields remain below the critical 4.5% threshold, but any renewed rise toward 4.8% or 5% could pose real risks to the broader market. For now, yields are easing slightly, which is supportive for risk assets. However, continued monitoring is essential as yield levels remain a key macro pressure point for equities.
Previous Day’s Forecast Analysis
Tuesday’s forecast projected SPY to trade between $618 and $625, with a neutral to slightly bullish bias. The model emphasized long setups on clean holds above $618 and anticipated resistance near $625 and $627. It cautioned traders about upside stalls near resistance and downside risks if SPY lost $618. The strategy favored disciplined entries near support and rapid profit taking at initial upside targets due to vulnerability to headline risk. The VIX at 16.81 suggested moderate volatility, and traders were advised to keep sizing conservative heading into the FOMC minutes release.
Market Performance vs. Forecast
Wednesday’s market action closely mirrored the prior day’s forecast. SPY opened at $622.77, held above the critical $618 support, and climbed steadily to close at $623.99, well within the projected range of $618 to $625. Intraday, SPY tapped a high of $624.72 before pulling back modestly, reflecting the expected choppiness and vulnerability to external headlines. The forecast's key levels were highly respected: support at $620 held firm and resistance near $625 was approached but not breached. Traders who entered long near support and scaled out near resistance found solid setups, reinforcing the reliability of the model’s roadmap.
Premarket Analysis Summary
In Wednesday’s premarket analysis posted at 8:53 AM, SPY was trading at $622.23 with a bias level anchored at $621.25. The model projected initial upside targets at $625.25 and $627 and noted a fragile bullish tone with a preference for buying near support zones. Downside targets were set at $621.25, $619.75, $617.75, and $615 in case of weakness. The strategy emphasized cautious long entries with quick profit-taking and warned that failure to hold above the bias level could trigger a return to the 619–621 range or lower. Traders were also advised to watch for short setups if the market stalled at resistance.
Validation of the Analysis
Wednesday’s market followed the premarket roadmap with precision. SPY dipped shortly after the open but never lost the $621.25 bias level for long, and buyers stepped in near $621 and $620.91, the session low. From there, price surged toward the first upside target at $625.25, hitting an intraday high of $624.72, just shy of that level, before fading slightly into the close. The premarket’s forecast of a fragile but upward-biased session was spot on, and traders who followed the guidance had opportunities for both long and short setups depending on entry and timing. The analysis accurately identified key support and resistance levels, once again proving its value.
Looking Ahead
Thursday’s spotlight shifts to the latest Unemployment Claims report, the only scheduled economic release for the day. With earnings season kicking off next week and trade tensions simmering, market participants will dissect the jobless data for signs of labor market cooling that could influence Fed policy expectations. While Thursday is expected to be quieter on the news front, any surprises in the unemployment figures could stir volatility. Traders should be prepared for sharp, reactionary moves if the data deviates from expectations.
Market Sentiment and Key Levels
SPY closed at $623.99, trading just below key resistance at $625 while comfortably above support at $620. Market sentiment remains cautiously bullish, reinforced by the strong bounce and resilience against renewed tariff chatter. Resistance now sits at $625, $627, and $630. Support levels to watch include $622, $620, $617, and $613. A push through $625 could trigger a rally toward $630 and $635, but failure to hold $620 may reignite bearish pressure, putting $617 and $615 in play. The market remains in a tight channel, awaiting either a breakout or breakdown depending on news catalysts or economic surprises.
Expected Price Action
Our AI model projects SPY to trade between $620 and $626 on Thursday, a slightly wider range than Wednesday’s. The market bias remains slightly bullish, and the Call-dominated structure points to upward pressure. Longs are favored if SPY holds above $620, targeting resistance levels at $625 and $627. A breakout above $627 opens the door to $630. If SPY loses $620, look for a pullback toward $618 and $615, where buyers are expected to re-engage. This is actionable intelligence, and traders should prepare for either a breakout or renewed rangebound behavior depending on the response to jobless data and tariff headlines.
Trading Strategy
Thursday’s session should be approached with tactical flexibility. Long setups are favored on dips to $622 or $620 with profit targets at $625 and $627. If SPY breaks above $627, consider holding partials into $630. On the short side, watch for stalls or failed breakouts near $625 or $627, which could present strong risk/reward entries. If SPY slips below $620, short trades toward $618 and $615 become viable. The VIX dropped to 15.91, indicating a more comfortable risk-on tone, but that may not last if new tariff developments emerge. Keep stops tight in this environment and reduce sizing in case volatility rises unexpectedly.
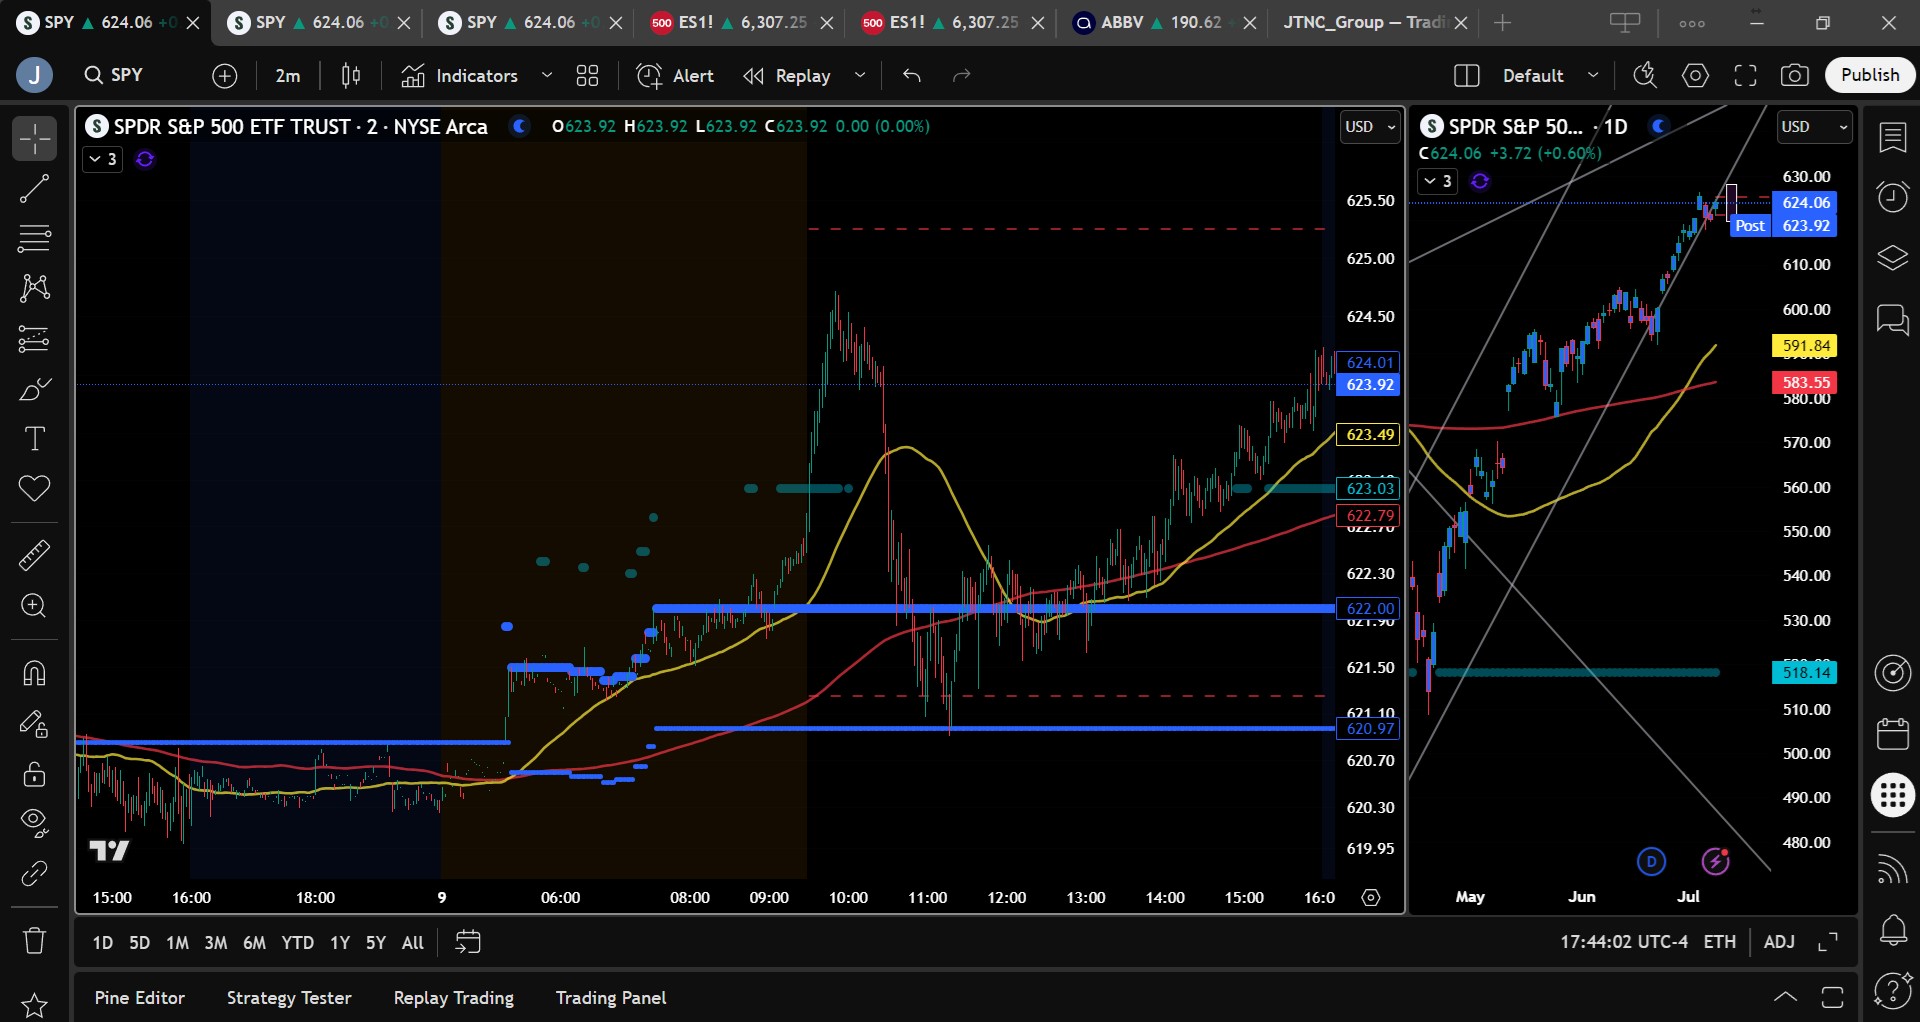
Model’s Projected Range
The model projects SPY’s maximum range for Thursday between $619.75 and $628.25 with the Call side dominating within a narrowing, 4-point range, suggesting choppy price action interspersed with occasional trending moves. Today’s session unfolded as expected, with buyers stepping in overnight near $620 and driving prices higher from the open until 9:50 a.m., when SPY sold off sharply on renewed tariff threats. However, those concerns were once again short-lived, and SPY rebounded off major support, rallying into the close. The ETF reversed much of the prior two days’ decline, positioning itself for potential further gains later this week. Volume was average, with SPY closing at $624.06. Despite ongoing tariff uncertainty, the broader uptrend remains intact as long as SPY holds above $585. Heading into Thursday, bulls will look to defend the $620 level to support another leg higher. A break below could trigger a pullback toward $618, with $615 also in play. SPY remains tightly coiled, awaiting a catalyst to drive a decisive move. Meaningful downside appears limited unless SPY breaches $600, which could quickly open the door to $585. While our model does not currently assign a high probability to that scenario, traders should stay nimble in case trade headlines destabilize sentiment. In the absence of a major catalyst, we expect dips toward $620 to be bought, with a gradual grind higher as the likely path. A failure at $620 sets the stage for a test of $618 and possibly $615, levels we are inclined to buy. Below $615, our stance turns bearish, targeting a move to $600. Resistance is noted at $625, $630, and $635, while support sits at $622, $620, $617, and $613. SPY is straddling the lower edge of the redrawn bull channel from the April lows, with strong resistance between $625 and $630 that may limit further gains. A break below $613 could suggest more meaningful downside risk. Broadly, the market remains highly sensitive to macroeconomic data, bond yields, inflation prints, tariffs, and fiscal developments. Meanwhile, the VIX fell 5.35% to 15.91, reflecting a risk-on tone, though caution remains warranted. At current levels, considering out-of-the-money calls with 90-day expirations may be prudent as traders prepare for potential volatility ahead.
Market State Indicator (MSI) Forecast
Current Market State Overview:
The MSI is currently in a narrow Bullish Trending Market State, with SPY closing well above MSI resistance turned support. Extended targets printed into the close and printed both in the am and afternoon sessions. The MSI rescaled higher overnight to its bullish state with a series of rapid rescalings higher just prior to the open. Long time readers of this newsletter know this implies a strong bull trend and with the addition of extended targets, traders should only buy until extended targets stop printing. Extended targets did in fact stop printing after SPY shot up toward $625 major resistance which saw SPY fall back to MSI support at $621. A less than perfect failed breakdown at this level and SPY took off once again, rallying virtually unstopped into the close. The current MSI implies more follow-through on Thursday with higher prices likely. Currently MSI support stands at $622 and lower at $620.97.
Key Levels and Market Movements:
On Tuesday, we wrote: “If bulls can hold $620, a push to $625 is possible Wednesday,” and added, “we expect buyers to continue supporting dips, barring unexpected negative headlines.” We also noted, “We continue to favor long setups above $615, while short opportunities may arise above $622.” With SPY opening above $622.50, well above MSI resistance turned support, we considered jumping into a long trade toward $625. But without a failed pattern to lean on, and only a breakout pattern (a bit more advanced than what we typically cover in these newsletters), we held off, despite our conviction that price would rally to $625. By 10 a.m., extended targets had stopped printing, and we identified the move as a textbook failed breakout at major resistance. We entered short at $624.25 with a stop just above $625. Our first target was MSI resistance turned support at $622, with T2 at $621.25, both aligning with premarket levels and MSI support. Both targets were hit quickly. On a classic failed breakdown at MSI support, we reversed long, favoring the bulls given their continued strength. We targeted $622 (MSI resistance) for T1 and aimed for $625.25 for T2. Realizing the morning rally failed to reach those highs, we took T2 off early at the extended target level of $623 and trailed the final 10% of the position. We exited at the close at $624. It was a two-for-two day with strong gains. Once again, success came from sticking to a disciplined daily plan, using MSI for directional clarity and timing, and integrating its levels into our broader model. MSI remains a cornerstone of our consistent trading process.
Trading Strategy Based on MSI:
Thursday brings the release of Unemployment Claims, which, unless significantly worse than forecast, are unlikely to move the market. The focus remains on tariff developments as investors await the upcoming earnings season, with banks and Netflix set to kick things off next week. For now, tariff-related uncertainty dominates the landscape, and with August 1st seen as the drop-dead date for negotiations, July could bring a deeper pullback if this overhang persists. That said, the market appears willing to overlook threats of new tariffs, and it’s likely we see a continuation of the recent parabolic rally, which paused briefly over the past two sessions. While some caution remains warranted, in the absence of a clear macro catalyst, we expect the market to grind higher in a slow and orderly fashion, as liquidity continues to fuel higher prices. Overnight, if bulls can hold $620, a push to $625 is possible Thursday; otherwise, SPY may again test $618, where buyers are expected to step in. A clean break below $618 could quickly send SPY to $615, and a decisive move below $615 would raise the odds of a deeper drop toward $600. Until then, we expect buyers to keep supporting dips barring unexpected negative headlines from the White House. If key levels hold, the market could resume its grind higher toward $635. Currently, MSI remains in a Bullish Trending Market State, with extended targets printing into the close, which implies higher prices ahead. While the market still seems to be awaiting a major catalyst, the broader uptrend remains intact, and bulls are likely to treat any pullback as a liquidity opportunity. Volume was average today, suggesting the market is likely to continue doing what it has been favoring buyers. For bears to gain traction, a break below $600 would be necessary, while a close above $625 would strengthen the case for a move toward $630 and potentially new highs. We continue to favor long setups above $615, while short opportunities may arise above $625 or on failed breakouts or breakdowns below $615 especially when MSI signals weakening conditions. As always, failed moves remain among the highest-probability setups. Stay nimble, avoid trades during Ranging Market States, and ensure full alignment with MSI. Providing real-time insights into market control, momentum shifts, and actionable levels, the MSI when integrated with our Pre-Market and Post-Market Reports continues to sharpen execution precision and elevate trade quality. If you haven’t yet integrated MSI and our model levels into your process, now is the time. Contact your representative to get started as these tools are designed to support consistency and enhance performance.
Dealer Positioning Analysis
Summary of Current Dealer Positioning:
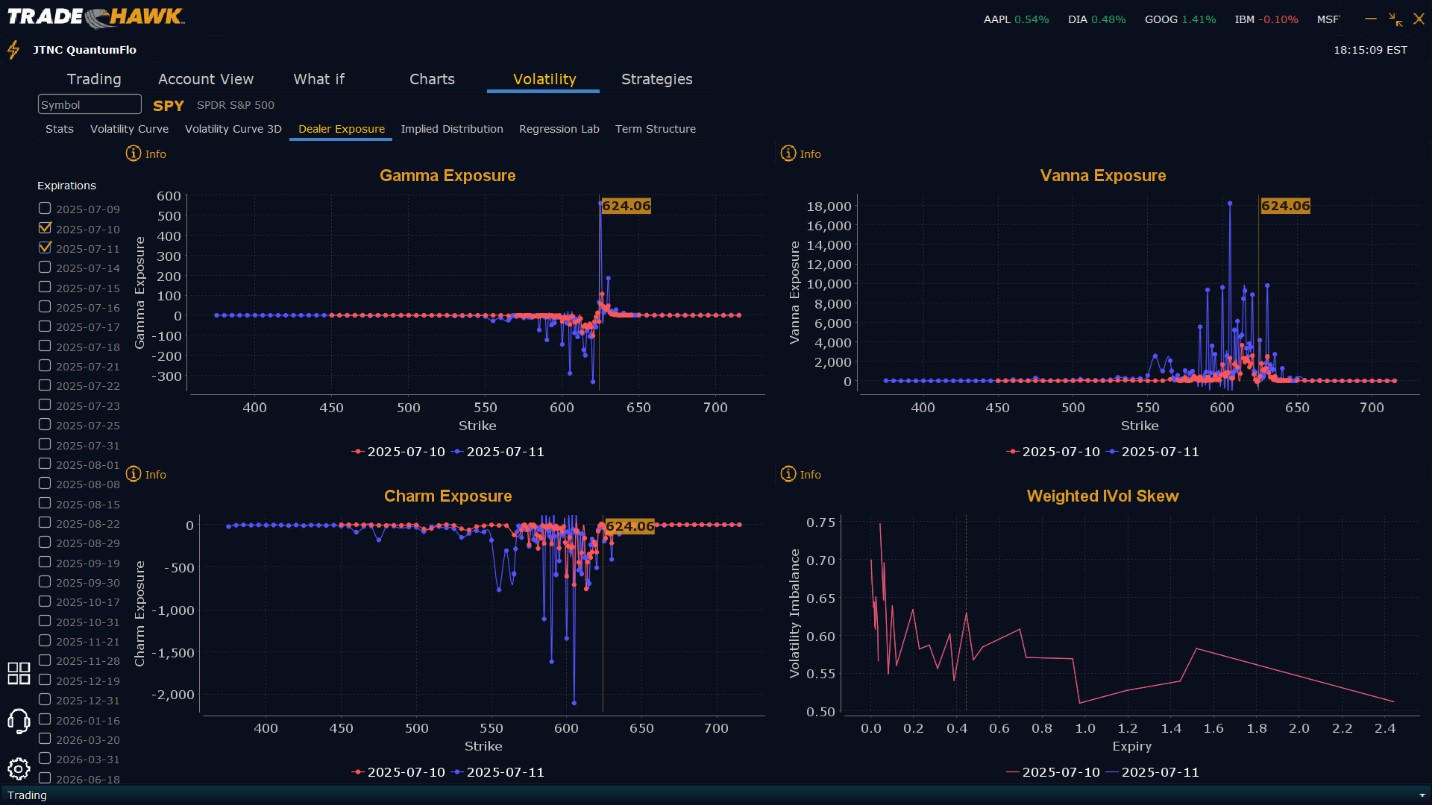
Dealers are selling SPY $625 to $640 and higher strike Calls implying the Dealers belief that prices may not move much higher tomorrow week and certainly not beyond $630. $626 looks to be major overhead resistance as well. Dealers are no longer selling close to the money Puts. To the downside, Dealers are buying $624 to $575 and lower strike Puts in a 2:1 ratio to the Calls they’re selling implying little concern that prices will move lower tomorrow. Dealer positioning is unchanged from neutral to neutral.
Looking Ahead to Friday:
Dealers are selling SPY $625 to $640 and higher strike Calls implying the Dealers belief that prices may not move beyond $630 by week’s end. To the downside, Dealers are buying $624 to $555 and lower strike Puts in a 2:1 ratio to the Calls they’re selling, reflecting a neutral outlook for the week. Dealer positioning has changed from slightly bearish to neutral. We advise reviewing Dealer positioning daily for directional clues. These positions evolve quickly and tracking them is essential for staying ahead of shifting market sentiment.
Recommendation for Traders
With SPY pressing against resistance at $625, traders should watch closely for signs of momentum continuation or exhaustion. Long entries near $622 or $620 remain attractive as long as price stabilizes and shows constructive setups. Upside targets remain at $625, $627, and $630. Short entries are viable on failed rallies at $625 or $627, especially if volume fades and momentum stalls. Keep stops tight near these inflection points. The VIX at 15.91 reflects a calmer environment, but headline risk remains high. Reduce size, stay flexible, and trade around the key levels our model has identified. As always, review the premarket analysis posted before 9 AM ET to account for any changes in the model’s outlook and in Dealer Positioning.
Good luck and good trading!
