
Market Insights: Wednesday, July 8th, 2026
Market Overview
Wednesday's session ended mixed as escalating US-Iran tensions rattled markets and sent oil prices sharply higher. After American forces carried out strikes against Iran late Tuesday in response to attacks on commercial vessels in the Strait of Hormuz, President Trump declared the US-Iran ceasefire agreement "over" while speaking in Ankara ahead of a NATO summit. He later walked back the severity somewhat, saying he didn't expect a full-scale war to restart — but also suggested the US would "probably hit them hard again tonight." The Dow dropped roughly 1%, or more than 500 points, while the S&P 500 slid 0.2% and the Nasdaq managed to trim its losses and eke out a 0.2% gain.
Energy markets took center stage as crude surged about 5%, extending Tuesday's oil rally into a second straight session of meaningful gains. Adding fuel to the fire, the Treasury revoked a license that had previously allowed Iran to export oil globally, stoking supply disruption fears. Separately, investors combed through the Fed's June meeting minutes for direction after the central bank held rates steady at its first meeting under new Chairman Kevin Warsh. The minutes showed a divided committee — a few officials argued a rate hike could be warranted — but policymakers ultimately agreed to stay on hold for now.
SPY Performance
SPY opened at $743.16 and struggled to find any real traction right out of the gate. The tone from the jump was cautious, with buyers making a modest push toward the high of $746.14 before sellers reasserted themselves and kept a firm lid on any meaningful recovery attempt. That early ceiling held, and once it was established, the rest of the session became a slow grind toward the low of $739.51 — a level that laid bare just how little firepower the bulls had on the day.
SPY closed at $745.32, down 0.32%, which marks back-to-back losing sessions and keeps the pressure squarely on the bull camp. Volume came in at 38.42 million shares, below average, so the selling wasn't exactly a stampede — but quiet tape with a downward drift still doesn't inspire confidence. The VIX climbed another 4.22% to 16.81, extending yesterday's fear spike and signaling that anxiety is building rather than fading. Two straight sessions of rising volatility alongside lower prices is the kind of combination that tends to keep dip buyers hesitant. The burden of proof now falls on the bulls to reclaim lost ground quickly, because the longer this tape drifts lower with volatility ticking up, the harder it becomes to shake the feeling that something more than a short-term pullback may be unfolding.
Major Indices Performance
The Nasdaq managed to eke out the best performance of the session, gaining 0.2% in a day where positive returns were hard to come by. The move was modest and far from convincing, but it does show that tech and growth names found at least some footing after the prior session's sharp selloff. Whether that represents a genuine stabilization or just a brief pause before the next leg lower remains the key question — one day of mild green doesn't erase the technical damage done recently.
The Dow and Russell 2000 both finished in the red and essentially tied for the most pain on the day. The Russell 2000 led the losses at -1.13%, which is a troubling sign for market breadth. Small-caps had been struggling to sustain any meaningful rally participation, and another session like this reinforces just how fragile sentiment is beneath the surface. These names are highly sensitive to macro conditions, and with yields still elevated, the headwinds for smaller companies aren't going away.
The Dow wasn't far behind at -1.09%, a meaningful drop that shows the blue-chip, value-oriented names that held up relatively well in the prior session couldn't maintain that resilience. When both the Dow and small-caps are selling off together while the Nasdaq barely hangs on to a fractional gain, the broader market tone is clearly defensive. The S&P 500 also finished slightly in the red on the session, confirming that today's weakness was widespread and not isolated to any single corner of the market. The rotation picture remains messy — there's no clean leadership story to hang your hat on right now.
Notable Stock Movements
Tesla grabbed the unwanted spotlight today, falling as much as 2.23% to lead the Magnificent Seven to the downside in what was mostly a red session for the group. That kind of reversal from Tesla isn't entirely surprising given how momentum-driven the name is — when broader market sentiment softens, Tesla tends to feel it first and feel it hardest. It's a reminder that the stock runs on narrative and risk appetite as much as fundamentals, and when either one wavers, the selling can come quickly.
The broader Magnificent Seven picture leaned red on the day, though NVIDIA and Apple managed to buck the trend and finish in positive territory. That's a notable flip from recent sessions — Apple, which had been sitting in the red, found its footing, while Tesla took the hit it had previously been passing along to others. The group's mixed internals reflect the same selective positioning that's been defining mega-cap tech lately, where investors are willing to stay engaged but are clearly rotating around within the cohort rather than embracing it wholesale.
With the Nasdaq managing a modest 0.2% gain while the Dow and Russell 2000 both dropped over 1%, the Mag Seven's mostly red performance carries an interesting signal — mega-cap tech wasn't the driver of what little green existed in the market today. The divergence between Tesla's slide and NVIDIA's resilience tells you that the market is still rewarding AI-adjacent growth stories while trimming the higher-beta, sentiment-driven names. With the VIX climbing 4.22% to close at 16.81, caution is quietly creeping back in, and that kind of environment tends to narrow the leadership within the group rather than lift it broadly.
Commodity and Cryptocurrency Updates
Crude oil is on a tear, surging another 5.12% today to close at $74.05 and pushing even further into territory that was supposed to be a ceiling not long ago. The rally above $70 is no longer a one-day story — this is starting to look like a sustained bid, and that changes the conversation at the macro level. Geopolitical tensions and tight supply dynamics continue to drive the move, and with crude holding comfortably above $70, the Fed has a new headache on its hands. Energy prices at these levels feed directly into inflation data, and if crude doesn't pull back soon, it hands policymakers a credible reason to stay restrictive longer than anyone wants.
Gold gave back a bit more ground today, slipping 1.29% to close at $4,092. Two consecutive down sessions after the kind of historic run gold put together is still well within the range of normal consolidation behavior. The macro backdrop that drove gold to record territory — geopolitical uncertainty, central bank demand, and a murky monetary policy outlook — hasn't disappeared. Dip buyers have shown up consistently throughout this rally and there's little reason to think that changes now. The long-term setup remains constructive.
Bitcoin had a rougher session than the prior day, dropping 1.73% but still closing above $62,201 and maintaining a healthy cushion above the key $60,000 psychological level. The selling pressure is more visible today than it's been recently, but the bulls haven't surrendered that floor. As long as Bitcoin continues to close above $60,000 with meaningful room, the intermediate-term outlook holds.
Treasury Yield Information
The 10-year Treasury yield closed at 4.570% today, rising another 0.88% on the session and extending its stay above that critical 4.5% threshold. Yesterday's move back above the line was concerning enough — today's follow-through confirms this isn't a one-day blip. The bond market is sending a clear message, and equity investors would be wise to listen. When yields hold above 4.5%, stocks face a persistent headwind, and the continued pressure across most of the major indices today reflects exactly that dynamic playing out in real time.
Zooming out on the framework, we're now sitting at 4.570%, which keeps us comfortably below the more dangerous levels but trending in the wrong direction. The next line in the sand is 4.8%, where selling pressure historically becomes more serious and sustained. A push above 5% shifts the risk environment in a meaningful way across asset classes, and at 5.2%, the historical record strongly suggests correction territory of 20% or more. None of those thresholds are imminent from here, but two consecutive sessions of yield increases above 4.5% is not something to dismiss lightly.
What to watch now is whether this grind higher in yields has more runway. If economic data continues to run hot or Fed speakers maintain their patient tone on rate cuts, the path toward 4.6% and eventually 4.7% becomes more plausible. Bulls need yields to reverse and settle convincingly back below 4.5% to ease the pressure on equities. Until that reversal materializes, the bond market remains a headwind, and any equity strength should be viewed with healthy skepticism.
Previous Day’s Forecast Analysis
Wednesday's forecast called for SPY to trade within a fourteen-point range bounded by $744 on the downside and $758 as the max upside target, with Tuesday's close at $747.62 sitting in the lower half of that window and tilting the bias modestly bearish heading into the session. The model identified $751 as the defining pivot — a clean reclaim of that level was needed to flip the structure bullish and open the door toward the primary magnet at $753, where the heaviest call concentration was expected to act as the day's battleground. Above there, $755 marked the expected move top, $757 was the next resistance layer, and $758 capped the upside. On the downside, $749 was the first warning level, with a break of $748 flagged as the trigger for accelerated selling given its heavy negative gamma. Below that, $746 and $745 were the next decision points, with $745 serving as the gamma flip and last line of defense before $744, the model's ultimate floor.
The trading strategy leaned on slightly reduced position sizing of 75-80% of normal given the VIX's climb to 16.20, emphasizing confirmation before entry rather than anticipating moves. Long setups were identified in the $745-747 zone with initial targets at $750-751 and a secondary leg toward $753-754 on expanding volume, with stops placed below $744. A push back above $750.96 on strong internals was highlighted as a momentum add opportunity targeting $753 first and $756-757 on follow-through, with trailing stops moved up to $748 as the trade developed. On the short side, the $750-751 zone was the area to watch for failed re-tests, with downside targets at $746-747 initially and $743-744 on acceleration. A sustained close below $745.21 was the signal for fresh short entries targeting $742, stops above $748. The overall message was disciplined patience — wait for the level, respect the 1.5-2% stop range, and stay alert to sharp snapbacks in a rising volatility environment.
Market Performance vs. Forecast
Wednesday's session opened below the model's projected range entirely, as SPY gapped down to $743.16 at the open — already beneath the $744 floor the forecast had identified as the ultimate downside boundary. That kind of gap-down open reflects external selling pressure that preceded the session itself, the type of pre-market catalysts the model's base case scenario doesn't account for. What matters is how the framework performed once price was in motion, and the answer is that several key structural elements held up with precision.
The model had flagged $745 as the gamma flip level and the last line of defense for bulls, warning explicitly that a failure there would put $744 in play as the session floor. Wednesday's low came in at $739.51, which pushed through that floor — but the close at $745.32 told a more nuanced story. Price recovered back above the $745 structural level into the close, meaning that level reasserted itself as meaningful support even after the intraday breach. That's not a coincidence — it's the options structure doing exactly what the model described, absorbing downside pressure and providing a gravitational anchor for price into the final hour.
The directional bias heading into Wednesday had leaned modestly bearish, and that proved entirely correct. The forecast had noted that a break of $748 was where selling could truly accelerate, identifying it as a key battleground carrying heavy negative gamma — and Wednesday's tape confirmed that dynamic, as price never reclaimed $748 throughout the session. Risk management protocols on any long entries from the $745-747 zone outlined in the strategy protected capital as the intraday flush extended lower, and the VIX climbing another 4.22% to 16.81 reinforced the heightened hedging demand the prior session had already flagged as a reason to keep sizing at 75-80% of normal. The framework identified the right structural levels, the right directional lean, and the right volatility posture — and as extraordinary events introduce outsized moves, the model's ability to define key zones in advance is precisely what allows traders to adapt quickly and stay on the right side of price action.
Premarket Analysis Summary
The premarket analysis posted at market open identified SPY spot at $742.21 sitting in a put-dominated environment with heavy negative gamma stacked around current price after slipping from recent highs. The expected move was flagged at 10 points, signaling a wider-than-normal range was anticipated. The immediate gate above was set at $744 — described as the level where broken structure could begin to repair — with $746 as the first target above that where selling could ease, $748 as the gamma flip into constructive territory, $750 as the critical round-number pivot and major call wall, and $752 capping the expected move top as max upside. The analysis was clear that until $748 was reclaimed and held, sellers maintained the edge. On the downside, $741 was flagged as the first level to watch just below spot, with $740 identified as the heaviest negative gamma strike and key put wall battleground. Below there, $738 was the next decision point, $735 the point of last hope, and $732 the max downside at the bottom of the expected move. The analysis warned that put-dominated conditions could cascade quickly if $741 failed to hold early.
The actual session delivered a mixed but ultimately constructive resolution relative to those levels. SPY opened at $743.16, clearing the immediate $741 and $740 danger zones from the open, and pushed higher to tap $746.14 — breaking through the $744 gate and reaching the first upside target almost precisely. However, price couldn't sustain the push and pulled back to a session low of $739.51, briefly undercutting the $740 put wall before recovering. The close at $745.32 landed above the gate, salvaging a partial bullish resolution despite the $739.51 undercut threatening the downside framework mid-session. The modest loss of 0.32% and VIX rising 4.22% to 16.81 reflected the ongoing tension between the two sides, consistent with the wide, volatile range the analysis had warned about in negative gamma conditions.
Validation of the Analysis
Today's session delivered another clean validation of the premarket framework, with SPY navigating the named levels in a way that gave prepared traders multiple high-quality opportunities throughout the day. The analysis opened with spot at 742.21 and immediately drew the battle lines — 744 was identified as the defining gate above, the level where broken structure could begin to repair, while 741 was the first danger zone below with the heaviest negative gamma concentration stacked around 740. SPY opened at $743.16, right in the middle of that tension zone, and the early price action was decisive. Price pushed higher off the open, cleared the 744 gate, and drove straight into the 746 target — hitting a session high of $746.14, almost exactly at the level the analysis flagged as the point where selling could ease. That was the ceiling. The premarket was explicit that 748 was required to flip conditions constructive, and price never got there — stalling just pennies past 746 and reversing course.
The downside then played out against the exact roadmap the analysis laid out before the open. The premarket warned that 741 was a heavy negative gamma zone and that losing it cleanly would open the door for acceleration toward 740. SPY obliged, selling off from the 746 rejection and pushing through 741 on its way to a session low of $739.51 — breaching the critical 740 put wall the analysis specifically flagged as the "heaviest negative gamma strike and key battleground." That break below 740 was the acceleration event the premarket warned about, and traders who had that level circled had a clear, actionable signal the moment price gave way. The session ultimately closed at $745.32, settling back inside the defined range between 744 and 746 — the exact decision corridor the framework mapped. The VIX climbing 4.22% to 16.81 confirmed the negative gamma environment the analysis described. From the gate rejection at 746 to the flush through 740 and back, today's entire range was defined before the open bell rang.
Looking Ahead
Thursday's economic calendar comes up empty on high-impact releases, which actually hands traders a bit of breathing room after digesting the FOMC Minutes. With no major data drops to navigate, the session becomes less about reacting and more about repositioning — giving the market time to settle into whatever direction Wednesday's Minutes pointed it toward.
Use Thursday as a consolidation day. Watch how price holds or breaks from any post-Minutes levels, and pay attention to whether the moves from Wednesday carry conviction or start to fade. Quiet calendars don't mean quiet tape, especially when the market is still working through a fresh Fed narrative, so stay disciplined with your levels and let price action be your guide.
Market Sentiment and Key Levels
The directional picture today leans bearish, though not decisively so. SPY closed down 0.32% and finished well below its intraday high, which tells you bulls made a run at it but couldn't hold the gains into the close. The VIX rising 4.22% to 16.81 is a meaningful signal — fear is quietly building, not exploding, but the steady climb in volatility suggests traders are adding hedges rather than buying dips with conviction. Below-average volume of 38.42M keeps this from being a clean distribution day, but the price action carries a cautious undertone that favors the bears in the near term. The Dow dropping 1.09% and the Russell 2000 falling 1.13% reinforce that weakness is spreading beyond just a few names — this isn't isolated sector noise.
Key resistance sits at $746.14, today's intraday high that was touched and then faded. A convincing reclaim of that level on expanding volume would give the bulls something to work with and could ignite a push toward the $750 area. On the downside, $739.51 — today's session low — is the line in the sand. If SPY breaks below that level with follow-through, the bears take full control and the door opens to a more significant leg lower. Gold sliding 1.29% to $4,092 removes a key defensive tailwind, and Bitcoin closing just above $62,201 after a 1.73% drop signals that risk appetite is cooling across asset classes. The 10-year yield holding at 4.570 keeps the pressure on equity valuations simmering in the background, and crude oil surging 5.12% to $74.05 adds an inflationary wildcard the market absolutely doesn't need right now. The bears have the short-term edge — $739.51 is the level that determines whether this stays manageable or gets messy.
Expected Price Action
Thursday's session presents actionable intelligence generated by our AI model, with SPY projected to trade within a range anchored by $732 on the downside and $752 as the max upside target. That twenty-point window signals the market will trend rather than consolidate, and with Wednesday's close at $745.32 sitting in the middle of the expected move, the bias leans modestly bearish given the put-dominated environment and the heavy negative gamma stacked around current price levels.
The defining level heading into Thursday is $748, which the model identifies as the gamma flip into constructive territory. A clean reclaim of $748 shifts the structure firmly bullish and opens the door toward $750, the critical round-number pivot and major call wall that serves as the day's magnet and ultimate battleground. Above there, $752 caps the range as the max upside and expected move top. On the downside, $741 is the first level to watch — that heavy negative gamma zone sits just below current price, and losing it cleanly opens the door for acceleration. A break of $740 is where selling could truly pick up speed, as that strike holds the heaviest negative gamma and serves as a key battleground for both sides. Below $740, $738 becomes the next decision point, followed by $735 as the point of last hope where substantial support sits. A failure at $735 puts $732 in play as the model's ultimate floor. With VIX now elevated at 16.81 and the market operating in a put-dominated setup, the burden remains squarely on the bulls — until $748 is reclaimed and held with conviction, sellers maintain the edge and any early failure at $741 should be treated as a warning sign that the lower end of this wide projected range will be tested.
Trading Strategy
The VIX rising 4.22% to 16.81 represents a continued build in near-term uncertainty, pushing the gauge further off the complacent lows and reinforcing that options markets are pricing in more downside risk. At 16.81, we're still not in panic mode, but the trend is clear — hedging demand is growing, and that backdrop argues for keeping position sizing around 75-80% of normal until the VIX shows signs of reversing. The below-average volume on the session is a slight offset, suggesting the weakness wasn't a full capitulation event, but the combination of a higher VIX close and broad market softness means the bulls still have something to prove before you commit size aggressively on the long side.
Long setups become interesting in the $743-745 zone, where the intraday low and the closing price are tightly clustered and represent the area buyers stepped in to defend during the session. Entries in that range carry an initial profit target of $748-749, with a secondary leg toward $751-752 if market breadth improves and volume expands with real conviction. Stops on longs belong below $742 — a break there removes the near-term support structure and opens the door to more meaningful selling. In a rising market scenario, a clean reclaim of $747-748 on strong internals sets up a momentum add, with targets at $751 on the first leg and $754-755 if fresh buying carries through. Trail stops up to $745.32 as the trade develops to protect gains and avoid giving back hard-earned progress.
Short setups are worth watching near the $746-747 zone, where the session high acted as a ceiling sellers defended without much effort. A failed re-test of that area on weak internals or deteriorating advance-decline numbers sets up a clean fade, with initial downside targets at $742-743 and a deeper move toward $739-740 if selling pressure accelerates. In a declining market scenario, a sustained break below $743 reopens short entries with targets at $740, stops placed above $746. With the VIX at 16.81 and trending higher, keep stop-loss parameters in the 1.5-2% range from entry, avoid pressing shorts that are already extended intraday, and stay alert to sharp snapbacks — rising volatility cuts both ways, and the edge belongs to the trader who waits for the level rather than the one chasing the move.
Model’s Projected Range
SPY's projected maximum range for Thursday is $740 to $752, with the Put side dominating in an expanding band that suggests trending price action with intermittent chop. Thursday brings no economic news due out so the market will trade on technicals. SPY closed at $745.32, down 0.32%, with an intraday range from $739.51 to $746.14 off an open of $743.16 — a relatively contained session that saw price recover off the lows but struggle to hold meaningful gains into the close. SPY is trading near our model's first support at $745, and the tape continues to process a backdrop of ongoing macro uncertainty as markets weigh geopolitical tensions and shifting rate expectations. If SPY can push through first resistance at $750, it opens the door toward $752, while a break of first support at $745 puts $740 in play as the next downside target. The long-term bull trend remains intact above $640 with SPY well above structural support. As long as price holds above key structural levels, this remains a broader dip-buying environment. Absent a catalyst, resistance sits at $750, $752, $753, $755, while support rests at $745, $740, $735. Given that SPY closed near the lower end of the projected range, we favor buying dips at $745 on any early weakness Thursday. Bitcoin slid 1.73% to close above $62,201, adding a note of caution to risk appetite, while MAG stocks were mostly red led by Tesla falling 2.23%, though NVIDIA bucked the trend in a big way gaining 3.65% — that kind of divergence within leadership means sustained weakness across both groups would be required to signal a deeper pullback. The VIX closed at 16.81, up 4.22%, suggesting elevated fear given the soft close and mild selling pressure heading into Thursday's session. SPY closed just above the lower line of the trend channel, with structural support near $745 keeping the broader uptrend structure intact for now.
Market State Indicator (MSI) Forecast
Current Market State Overview:
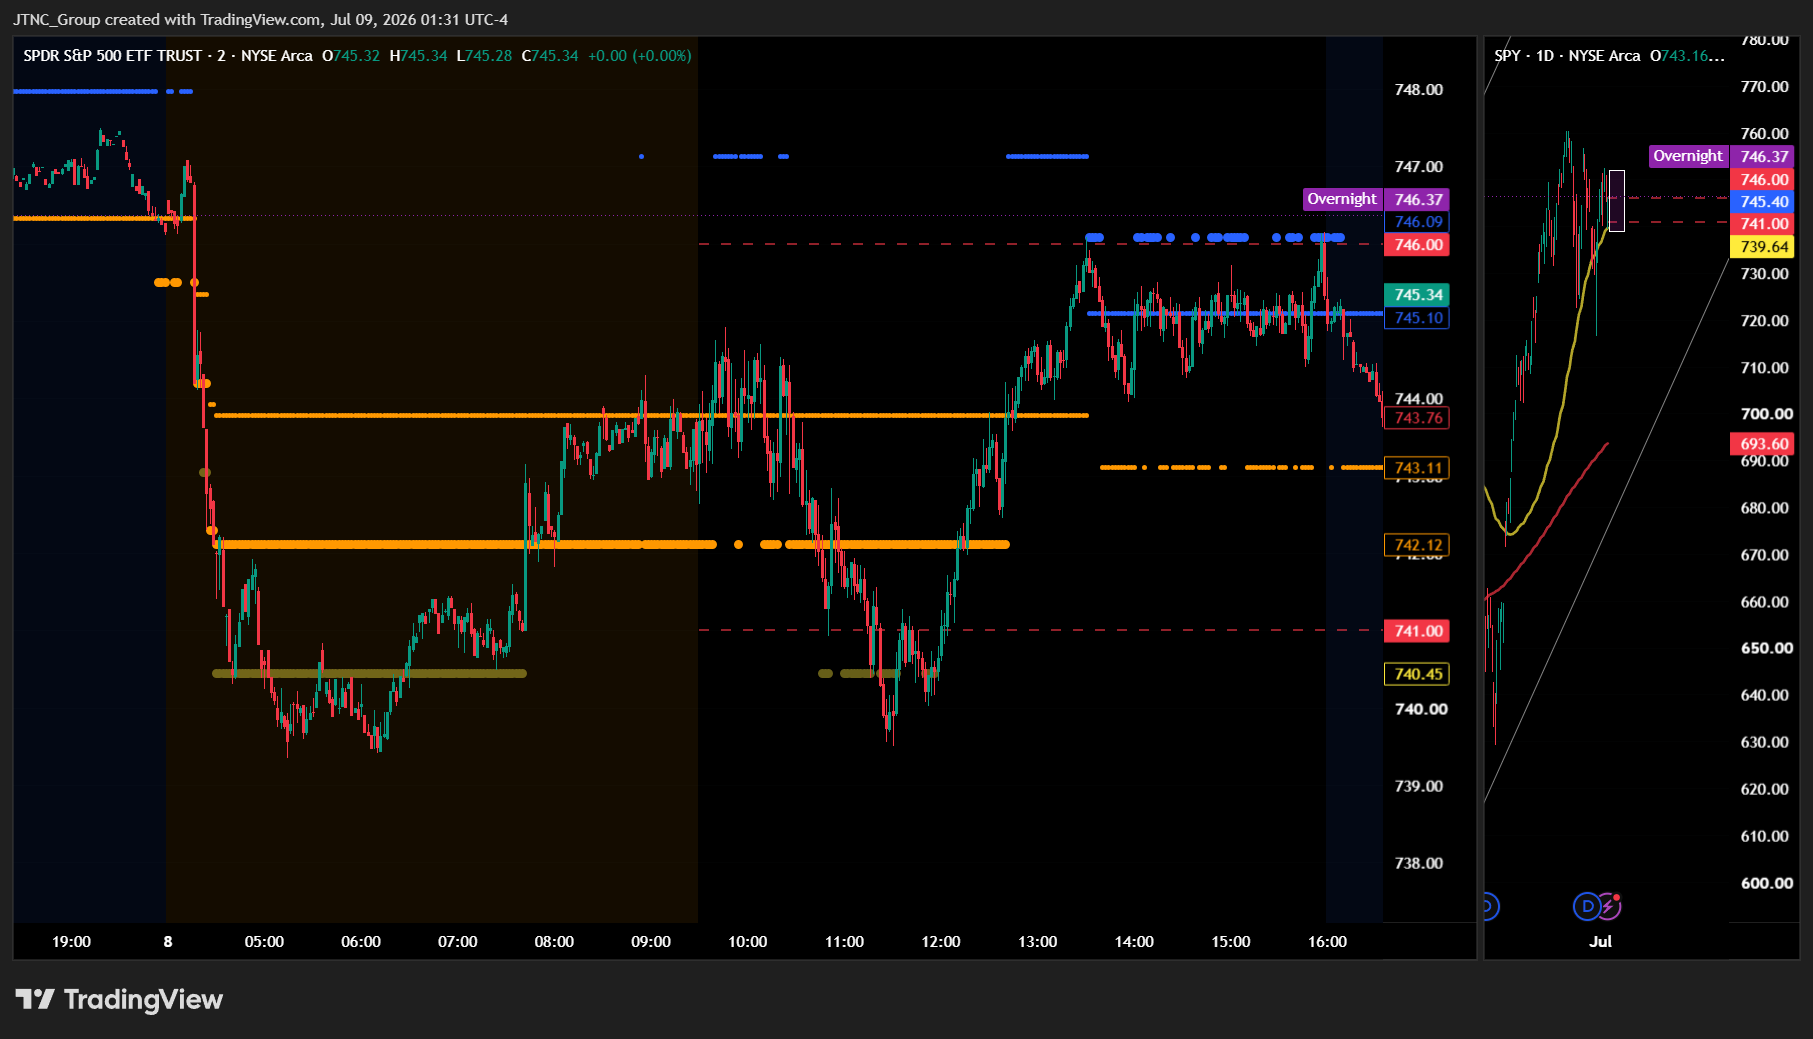
The MSI ended in a Ranging Market State with SPY closing at $745.32. Since SPY closed inside the MSI range, support remains at $743.11 and resistance remains at $745.10 heading into Wednesday. Extended targets were not printing at the close, confirming that while Tuesday's session saw significant directional movement intraday, the conviction to sustain a trend had faded by end of day. Extended targets were active during the AM session, printing below as price dropped sharply from $746 to $739 in premarket, and again above during the PM session as the recovery gained momentum. The MSI rescaled lower overnight opening the day in a wide bearish state with extended targets below pushing price sharply from $746 down to $739 in the early premarket hours. The MSI then began rescaling higher with price recovering back toward $744 through the morning session before reversing again at the open with another leg lower to $739. As soon as extended targets stopped printing SPY reversed sharply and the MSI began rescaling higher with a series of rapid rescalings lifting price back above $745 by early afternoon. The MSI settled into a narrow ranging state into the close with price unable to sustain a bullish state. Without extended targets at the close the MSI is forecasting sideways consolidation for Wednesday with the narrow $1.99 spread suggesting price will likely remain between $743 and $746 absent any new catalyst. MSI support is $743.11 with resistance at $745.10.
Key Levels and Market Movements:
Monday we stated the MSI was forecasting sideways consolidation and that price would likely remain range bound between $746 and $749 absent any new catalyst. Tuesday's session broke lower from that range with SPY opening at $743.16, well below Monday's MSI support. The premarket selloff was swift and decisive, with the MSI in a wide bearish state and extended targets below driving price from $746 down to a session low of $739.51. That move offered a clean short setup for traders following the framework. The reversal was equally sharp — once extended targets stopped printing below, the MSI began a series of rapid rescalings higher as buyers stepped in aggressively, lifting SPY from $739.51 all the way back to $745.32 by the close. That V-shaped recovery provided a second clean setup, this time on the long side, as the MSI confirmed the momentum shift in real time. SPY closed at $745.32 after touching a high of $746.14 and a low of $739.51. The VIX rose to 16.81, reflecting the intraday volatility. At minimum it was a three-for-three session for traders following the framework. It was a volatile but readable day with substantial setups, all identified through proper context, patience, and flexibility while leveraging the MSI, premarket levels, and market structure rather than forcing trades. The MSI continues to prove its reliability as the cornerstone of our trading process.
Trading Strategy Based on MSI:
Wednesday brings Fed Chair Warsh's testimony before Congress which can introduce significant volatility, so traders should be ready to trade what they see rather than predict. The narrow $1.99 MSI spread at the close suggests sideways consolidation for Wednesday with price likely to remain between $743 and $746 absent any new catalyst. But with such a narrow range it is also likely the MSI rescales overnight and a short squeeze ensues which will push price back to test higher levels.
Bulls want to see overnight price hold above $743.11 MSI support and use that level as a launching pad to press SPY back toward $745.10 resistance and beyond. If bulls can defend $743.11 with conviction and the MSI rescales into a Bullish Trending state with extended targets printing above, the sideways thesis gets shelved quickly. Bears want to see $745.10 resistance hold and press price back toward $743.11 MSI support below. If $743.11 gives way and the MSI rescales lower into a Bearish Trending state with extended targets printing below, Tuesday's impressive recovery would come into question and price could revisit $740 and lower levels. Given the narrow Ranging state, failed breakouts and failed breakdowns at either boundary are the highest-probability setups.
The long-term bull trend remains intact above $640 and failed breakouts and failed breakdowns continue to offer the highest-probability setups. Remain flexible, avoid trading during Ranging Market States unless a clear failed breakout or breakdown presents itself, and ensure all trades are fully aligned with MSI signals. Providing real-time insights into market control, momentum shifts, and actionable levels, the MSI when integrated with our Pre-Market and Post-Market Reports continues to sharpen execution precision and elevate trade quality. If you haven't yet integrated MSI and our model levels into your process, now is the time. Contact your representative to get started as these tools are designed to support consistency and enhance performance.
Dealer Positioning Analysis
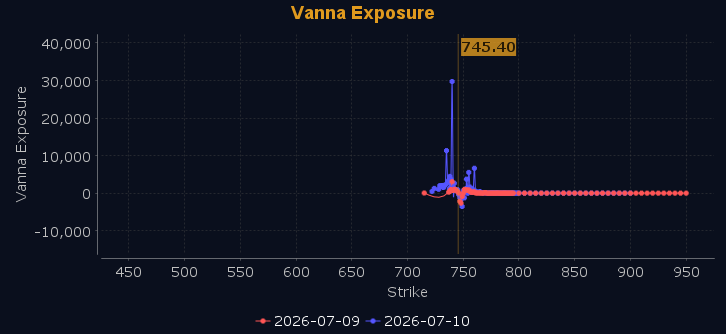
Dealers are selling SPY $747 to $761 and higher strike Calls, indicating the Dealers see a ceiling above for Wednesday. The ceiling for Wednesday appears to be $749. To the downside, Dealers are buying $743 to $680 and lower strike Puts in a 4:1 ratio to the Calls they're selling, displaying heightened concern that prices could move lower. Dealers are no longer selling ATM Puts, indicating limited conviction on direction for Wednesday. Below $743 is bearish and above $745 is bullish. Should SPY fail to hold $743, the zone from $737 to $743 will be choppy and full of traps. Dealer positioning is unchanged at bearish.
Looking Ahead to Next Friday:
Dealers are selling SPY $747 to $766 and higher strike Calls for the week ahead. The ceiling for the week appears to be $751. To the downside, Dealers are buying $741 to $636 and lower strike Puts in a 4:1 ratio to the Calls they're selling, displaying heightened concern that prices could move lower. Dealers are selling ATM Puts broadly at $742 to $746 into July 10, indicating strong conviction that prices will continue to rise. Dealers do not sell ATM Puts unless they believe there is a floor in the market at $742. There is a clear floor at $742 with major resistance at $747 to $751. Remain bullish above $742 but below $740 and especially $736 we are bearish. Dealers are positioned for a continuation of the rally anticipating further upside into mid-July. For the week Dealer positioning has improved from bearish to neutral/bullish. We advise reviewing Dealer positioning daily for directional clues. These positions evolve quickly and tracking them is essential for staying ahead of shifting market sentiment.
Recommendation for Traders
With SPY closing at $745.32 and VIX jumping 4.22% to 16.81, watch $739.51 as your key downside level — a break there opens the door to further selling and favors shorts. Longs can work on a hold above $745, but keep stops tight with volatility on the rise.
Don't oversize here with the 10-year yield at 4.570 and breadth deteriorating across small caps and the Dow. Review the premarket analysis posted before 9 AM ET for any changes in the model's outlook and Dealer Positioning.
Good luck and good trading!
