Market Insights: Thursday, July 2nd, 2026
Market Overview
Stocks went their separate ways Thursday as investors chewed over a June jobs report that muddied the rate outlook and the chip sector continued its slide. The Dow surged more than 1.1% toward a new record high, while the S&P 500 barely moved and the Nasdaq dropped 0.8% as tech selling carried over from Wednesday's chip-driven pullback. The June nonfarm payrolls report came in well below expectations, with only 57,000 jobs added against the 113,000 forecast, though the unemployment rate actually beat estimates at 4.2% versus the 4.3% expected. The cooler jobs reading snapped a three-month hot streak and gives the Fed more reason to hold rates steady — consistent with Chair Kevin Warsh's message that Wall Street should look to the data, not the central bank, for rate guidance.
Tesla shares tumbled 7% despite posting second-quarter delivery numbers that easily topped estimates — a classic "sell the news" reaction. The tech pressure was compounded by a brutal session overseas, where South Korean chipmakers got hammered and dragged the Kospi down 7.9%. SK Hynix and Samsung, both of which recently announced massive AI investment plans, shed more than 14% and 9%, respectively. On the geopolitical front, oil prices slipped even as Qatar reported that US-Iran talks this week were positive, though no breakthrough was reached.
SPY Performance
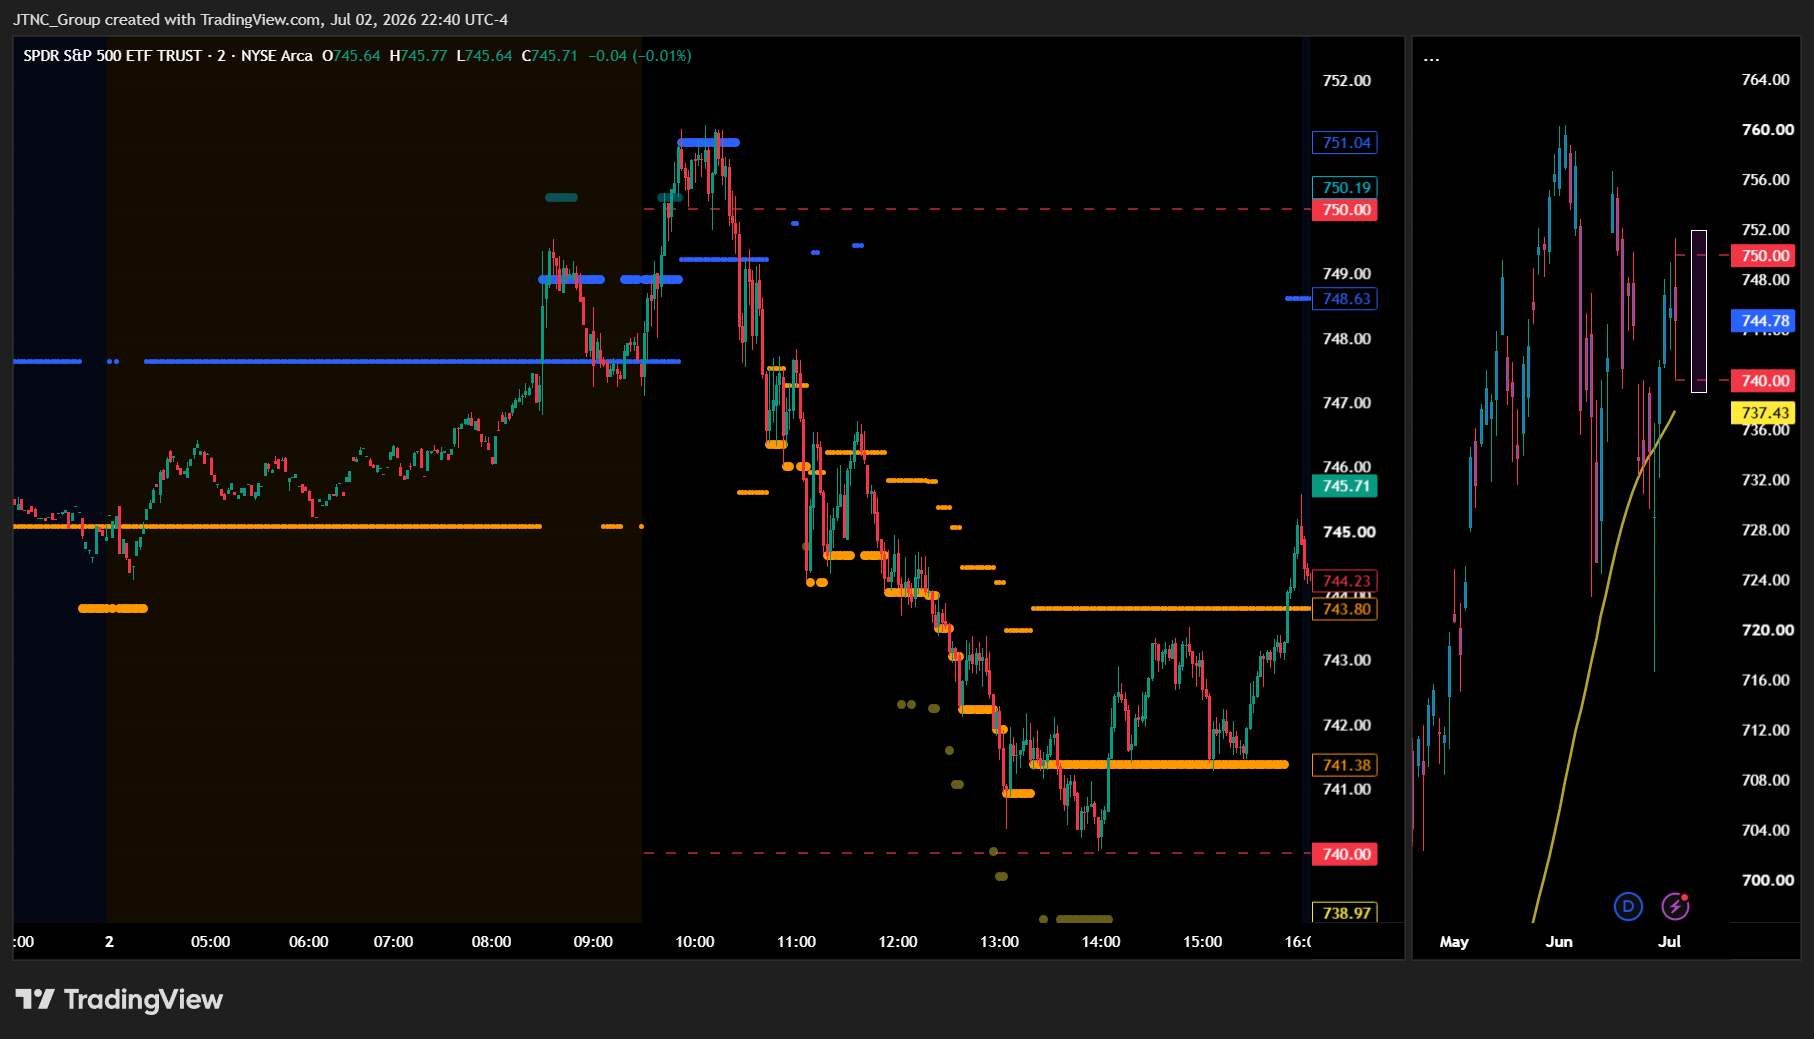
SPY opened at $747.40 and immediately faced some turbulence, with the session dragging price down to a low of $740.03 before buyers stepped back in and pushed the action higher. The high of $751.31 was reached, but like the session before, the market couldn't hold those gains — sellers were waiting at the top end of the range, and the tape reflected that push-and-pull dynamic throughout the day. The wide intraday swing from low to high tells you there was real two-sided action here, not just a sleepy drift. Bulls and bears both had their moments, but neither side landed a decisive punch.
SPY closed at $744.80, a decline of just 0.13%, which is essentially unchanged on the day and mirrors the kind of non-committal finish we saw in the prior session. Two consecutive days of fractional losses after a strong run isn't alarming — in fact, the market holding this level under that kind of back-and-forth pressure is quietly impressive. Volume came in at 46.82 million shares, near average, which means there was genuine participation behind today's moves. This wasn't a low-conviction drift — there was activity, just no clear winner by the close. The VIX dropped 1.51% to close at 16.34, essentially flat with the prior close but the direction matters. Volatility continuing to compress while the market absorbs selling pressure near recent highs suggests the underlying tone hasn't shifted. The bulls may be grinding, but they haven't let go of the wheel.
Major Indices Performance
The Dow was the clear standout on the session, posting a solid 1.14% gain that put it in a league of its own compared to the rest of the major indices. That kind of outperformance from a blue-chip, value-heavy index tells you a lot about where money was flowing on the day — investors were rotating toward the steadier, more defensive names and away from the high-growth, high-beta side of the market. When the Dow leads by this kind of margin, it's a rotation story more than a broad market rally, and that's exactly what played out here.
The Russell 2000 was on the opposite end of the spectrum, falling -1.04% and reminding everyone just how vulnerable small-caps can be when risk appetite starts to shift. Small-caps need confidence in the economic outlook and a favorable rate environment to really run, and neither of those conditions felt fully in place today. The selling in small-caps wasn't panic-level, but a drop of that size while the Dow is ripping higher is a pretty clear signal that investors were trading up in quality rather than taking on additional risk.
The Nasdaq dropped -0.8%, dragged lower by weakness in the growth and tech space. That's back-to-back sessions of underperformance for the Nasdaq, and the trend of growth names struggling while value and blue-chips hold up continues to define the tape right now. The S&P 500 finished essentially flat on the session, which makes sense — the Dow's strength and the Nasdaq and Russell's weakness largely canceled each other out at the index level. When you see this kind of divergence between the Dow and Nasdaq, the market is telling you something about where conviction lives right now, and it's not in momentum names.
Notable Stock Movements
Tesla took center stage today for all the wrong reasons, cratering 7.49% to lead the Magnificent Seven lower in what was a mostly red session for the group. That's a punishing single-day drop for a name of Tesla's volatility profile, and it dragged sentiment across the cohort in a meaningful way. When the group's most momentum-driven name sells off that hard, it tends to color the overall narrative even when a few names manage to hold their ground.
Apple, Microsoft, and Amazon were the bright spots, each managing to finish in the green and provide some counterweight to the selling pressure elsewhere. That selective resilience is worth noting — these are the more defensively positioned names within the group, and their ability to stay positive on a rough tape suggests institutional money is still willing to anchor around the highest-quality large-cap tech names. The rest of the group leaned red, with Tesla's outsized decline doing most of the damage to the group's overall scorecard.
The broader market backdrop makes today's Magnificent Seven weakness a little more nuanced than it might appear. The Dow pushed up 1.14% while the Nasdaq dropped 0.8% and the Russell 2000 fell 1.04%, painting a picture of rotation out of growth and into more traditional value names. That kind of divergence puts the Magnificent Seven in a tricky spot — the group tends to anchor to Nasdaq leadership, and when the tech-heavy index is underperforming, it creates a headwind for the mega-cap growth trade. The VIX dropped 1.51% to 16.34, so fear isn't spiking, but Tesla's ugly session is a reminder that even in a relatively calm volatility environment, individual names can still take serious hits when the selling finds them.
Commodity and Cryptocurrency Updates
Crude oil drifted slightly lower today, slipping 0.19% to close at $68.45 and continuing to hover in that indecisive range below $70. The bears aren't running away with it, but the bulls haven't been able to reclaim that key level either. Our model has been forecasting crude moving toward $60 for several months, and while it's possible crude continues lower from here, if black gold can hold above $56, a rally back toward $70 remains very much in play. The energy sector is stuck in a wait-and-see mode until there's a clearer catalyst to break this drift in either direction.
Gold put in another strong session, rallying 1.65% to close at $4,136 and pushing further into record territory. The yellow metal is simply not showing any signs of fatigue — dip buyers remain active and the macro environment continues to hand gold every reason to stay elevated. Institutional demand looks firm, and the broader backdrop of uncertainty and inflation concern isn't going away anytime soon. The long-term setup here continues to look as constructive as ever.
Bitcoin had a good day, posting a 2.27% gain and closing above $61,366, finally punching through that key $60,000 psychological level that had been acting as a ceiling. That's a meaningful development for crypto bulls who have been waiting for this reclaim. The real test now is whether Bitcoin can hold above that level in the sessions ahead — breaking through is one thing, but staying there is what will determine whether this is a genuine shift in momentum or just another head fake.
Treasury Yield Information
The 10-year Treasury yield climbed another 2.58% on the day, closing at 4.480%. That move punches the yield right up against the critical 4.5% threshold — now sitting just 2 basis points below the line where yields begin to actively pressure equity valuations. Combined with yesterday's 2.36% surge to 4.470%, we've now seen three consecutive sessions of rising yields, and the momentum is unmistakably pointing higher. The bond market is sending a clear message, and equity investors need to be paying close attention.
The framework is straightforward but the implications are serious. At 4.480%, we are essentially knocking on the door of 4.5% — the level where institutional money begins rotating defensively and growth stocks feel the squeeze first. A sustained close above that line flips the script for equities, eroding the momentum that bulls have been relying on. The next danger zone at 4.8% is where selling pressure historically accelerates and risk assets get repriced in earnest. Above 5%, the equity environment deteriorates significantly, and at 5.2% the data supports corrections of 20% or more. None of those levels are immediately in play, but the speed at which we've traveled from 4.420% earlier this week to 4.480% today is what demands attention.
What's particularly concerning is that the equity market hasn't fully priced in what a definitive break above 4.5% would mean. Today's mixed session — with the Dow managing gains while the Nasdaq and Russell 2000 fell — hints at the kind of internal rotation you see when rate sensitivity starts to bite. Any catalyst that adds fuel to this yield move, whether it's a hotter inflation print, stronger-than-expected economic data, or a shift in Fed tone, could be the trigger that finally closes those last 2 basis points and puts the market in a more precarious position. That 4.5% line remains the most important number in the market right now, and it has never been closer to breaking.
Previous Day’s Forecast Analysis
Thursday's forecast called for SPY to trade within a thirteen-point range, with $739 defining the max downside and $752 serving as the max upside target. Wednesday's close at $745.72 sat nearly in the center of that projected window, leaving the bias essentially neutral heading into the session. The model identified $747 as the critical upside gate where positive gamma firms up and the structure turns constructive, while $744 was flagged as the immediate downside trigger — losing it cleanly was expected to open the door lower in a hurry. Above $747, the model pointed to $748 as the next resistance decision point carrying the heaviest call concentration, $750 as the major round-number call wall requiring serious buyer commitment to clear, and $751 and $752 as the final battlegrounds toward max upside. On the downside, $743 was identified as an acceleration zone below $744, followed by $742 as the next decision point, $740 as round-number support with significant put interest, and $739 as the absolute line in the sand. The VIX easing to 16.33 painted a calm backdrop, but the negative gamma pocket between $744 and $747 was expected to produce choppy two-way action near the open.
The recommended trading approach called for position sizing at around 80-85% of normal given the low-volume, low-conviction backdrop, with an emphasis on letting price come to defined levels rather than chasing extended moves. Long setups were favored near the $742-743 zone with initial targets at $746-747, a secondary push toward $749 if buying picked up, and stops below $741. A sustained reclaim of $747 on improving volume was the signal to add exposure, targeting $749-750 on the first leg and $752 if fresh buyers joined in, with stops trailed up to $745. Short setups were identified in the $749-750 zone as a fade against prior resistance, with downside targets at $745-746 and a deeper move toward $742-743 if selling gained traction. A firm break below $744 also opened short entries targeting $741-742 with stops above $746. Stop-loss parameters were kept in the 1.5-2% range from entry to respect the low-volatility environment.
Market Performance vs. Forecast
Thursday's session delivered a wide-ranging, two-sided tape that tested the model's full structural map from top to bottom — and the framework held up with impressive precision across multiple key decision points. SPY opened at $747.40, right at the upside gate the forecast had identified as the immediate tell for directional commitment, and bulls initially responded, pushing price to a session high of $751.31 that nearly kissed the $752 max upside target the model had outlined as the ceiling of the expected move. That opening surge confirmed the $747 reclaim thesis and validated the long scenario the forecast had mapped out in detail, with the run through $750 and toward $752 playing out almost exactly as the upside roadmap described.
What makes Thursday's tape particularly instructive is how the downside structure performed just as well. After tagging the top of the range, price reversed and worked methodically through every support level the model had flagged — $744 gave way, $743 accelerated selling as the framework predicted, $742 served as a decision point, and $740 acted as the round-number support with significant put interest before ultimately yielding. The session low of $740.03 landed within three cents of the model's $739 max downside line in the sand, a level of structural precision that speaks directly to the quality of the options-driven framework. Risk management protocols on long entries with stops below $741 protected capital as price breached that zone, which is exactly the function disciplined stop placement is designed to serve. SPY ultimately settled at $744.80, closing right at the lower end of the neutral zone the forecast had identified as the pivot between bull and bear control. The model does not account for unpredictable intraday catalysts that can compress a full expected range into a single session, but the architecture it built around Thursday was precise from max upside to max downside. The VIX dropping 1.51% to 16.34 added a constructive footnote, and the framework's ability to map both sides of a volatile session with this level of accuracy reinforces its continued value as price action heads into the next setup.
Premarket Analysis Summary
The premarket analysis posted at market open identified SPY spot at $746.66 sitting in a call-dominated environment with constructive footing above the gamma flip. The defining gate was set at $748, flagged as the level where positive gamma would build decisively and unlock the pull toward the day's primary magnet at $750, which was identified as the single heaviest concentration zone and major call wall. Targets above mapped out $752 as the next decision point, $753 as the expected move top, and $754 as max upside. On the downside, $745 was identified as the immediate trigger and heaviest negative gamma strike — a clean loss of that level was flagged as the door-opener to lower prices, with $744 as the zone where selling could accelerate, $743 as the next decision point, $741 as key support, and $740 marking the bottom of the expected move as max downside. The analysis characterized $748 as the upside tell and $745 as the immediate downside trigger, warning that a slip below $746 and clean break of $745 could produce a swift move toward $744 given the negative gamma pocket sitting right below.
The actual session respected the framework but ultimately resolved to the downside. SPY opened at $747.40, briefly pressing higher to a session high of $751.31 — clearing $748, tagging $750, and extending into the $751 decision point zone the analysis had mapped above. However, price could not sustain those gains, reversed hard, and sliced through the $745 trigger and $744 acceleration zone before bottoming at $740.03, which matched the max downside target almost to the tick. The close at $744.80 landed back inside the damage zone, confirming the bears had control by end of session. VIX dropping 1.51% to 16.34 was a modest disconnect from the price action, but the session ultimately validated both the upside level and the full downside map the analysis had laid out.
Validation of the Analysis
Today's session delivered a textbook example of why the premarket framework matters — the full range of price action played out almost entirely within the levels mapped before the open, giving traders a clear roadmap from the first tick. SPY opened at $747.40, right inside the 746-748 zone the premarket flagged as the pivotal range, briefly flirting with the upside before running into the 748 gate. The analysis was explicit: 748 needed to be cleared and held to unlock the pull toward 750, and the market tested that thesis directly — SPY pushed to a high of $751.31, slicing through 748, tagging 750 right at the heavy call concentration zone, and pressing all the way to 751 before sellers stepped in. That move rewarded any trader who used the 748 reclaim as a long trigger, with 750 serving as the exact magnet the premarket described.
What happened next was equally well-mapped. The premarket named 745 as the immediate downside trigger and warned that losing it cleanly would open the door lower, with 744 as the acceleration point and 741 as key support before 740 came in as the line in the sand. SPY reversed hard off the 751 high, sliced through 745, accelerated through 744 and 743 exactly as the analysis called, and drove all the way to a session low of $740.03 — stopping just at the 740 max downside target, the very bottom of the expected move. The precision is hard to ignore: the framework defined 740 as the floor before a single trade was placed, and the session low printed $740.03. Traders who watched the 745 break as their downside trigger had a clean entry with a target sitting right at 740. The close at $744.80 settled back into the negative gamma pocket between 744 and 745, consistent with the choppy character the premarket associated with that zone. From the $751 high to the $740.03 low, every major inflection point was on the chart before the open.
Looking Ahead
Friday's economic calendar is clean — no high-impact releases are scheduled, which means the market gets a chance to digest Thursday's jobs report without any fresh data noise getting in the way. After the volatility that NFP, Average Hourly Earnings, and the Unemployment Rate can inject into price action, a quiet Friday session is actually useful. Traders will have the full picture from the labor market in hand and can spend the session repositioning around whatever that data revealed.
That makes Friday less about reacting and more about reading. Watch how the market follows through — or fails to — on Thursday's move. If the jobs data sparked a strong directional push, Friday will tell you whether institutions are leaning into that trade or fading it into the weekend. With no catalysts to create new surprises, price action will be driven by conviction, not confusion, and that clarity can set up some of the cleaner trades of the week.
Market Sentiment and Key Levels
The directional picture today leans slightly bearish, but like yesterday, this reads more as consolidation than a true breakdown. SPY slipped just 0.13% on the session, closing at $744.80 after testing both ends of a fairly wide intraday range. The inability to hold above the open and close near the lower half of the day's range gives the edge to bears in the short term, but the margin is thin. The VIX dropping 1.51% to 16.34 is a meaningful counterpoint — fear is actually receding even as price drifts, which suggests this isn't a market in panic mode. Near-average volume at 46.82M tells a similar story — sellers weren't exactly flooding the exits with conviction.
Key resistance sits at $751.31, today's intraday high. That level was tagged and rejected, leaving it as the ceiling bulls need to clear to shift the near-term tone. A decisive push above $751.31 on stronger volume would be a constructive signal and could open the door to a more sustained move higher. On the downside, $740.03 is the support number that matters — that's where today's low held, and it needs to hold on any subsequent test. A breakdown below $740.03 with heavy selling would be a more serious warning and could accelerate pressure toward lower levels. From a cross-asset standpoint, gold surging 1.65% to $4,136 adds a notably defensive tone to the session, while Bitcoin climbing 2.27% to close above $61,366 keeps some risk appetite alive. Yields drifting closer to the 4.5% zone remain a background concern worth monitoring. Bulls still have structural footing as long as $740.03 holds, but they need volume and a clean break above resistance to reclaim the initiative.
Expected Price Action
Friday's session presents actionable intelligence generated by our AI model, with SPY projected to trade within a range defined by $740 on the downside and $754 as the max upside target. That fourteen-point window signals the market will trend rather than consolidate, and with Thursday's close at $744.80 sitting in the lower half of the expected move, the bias leans modestly bearish heading into Friday — with the key question being whether bulls can reclaim the $748 gate or bears press the advantage below $745.
The defining level heading into Friday is $748, which the model identifies as the immediate upside gate where positive gamma builds decisively and the structure turns constructive. A clean reclaim and hold of $748 opens the door toward $750, where the single heaviest call concentration of the session sits and serves as the primary magnet for price. That $750 level is the battleground — bulls need to clear it with conviction to keep the trend intact. Above there, $752 is the next decision point, $753 marks the expected move top, and $754 caps the range as max upside. On the downside, $745 is the first level to watch and the heaviest negative gamma strike sitting just above Thursday's close — losing it cleanly opens the door lower in a hurry. Below $745, selling could accelerate toward $744, which is the next decision point where momentum can shift from orderly to fast. A break of $744 puts $743 in play, followed by $741 as a key support level with significant put interest. Below $741, $740 is the model's line in the sand as max downside and the point of last defense for bulls. With VIX settling at 16.34 and fear remaining subdued, the negative gamma pocket sitting just below current prices sets up a binary open — $748 is the upside tell and $745 is the immediate downside trigger that will define Friday's directional commitment.
Trading Strategy
The VIX dropping 1.51% to 16.34 keeps the fear gauge firmly in low-volatility territory, essentially unchanged from the prior session's reading and confirming that options markets continue to price in a calm near-term environment. At 16.34, there's no elevated hedging demand signaling institutional concern, which is constructive for defined setups — but the mixed tape across major indices, with small caps and tech absorbing noticeable pressure while the Dow held its own, argues for keeping position sizing measured. Around 80-85% of normal size is appropriate here until a cleaner directional consensus emerges across the broader market. In a session where SPY barely moved on near-average volume, discipline on entries and stop placement matters more than ever — false breakouts and breakdowns are common in low-range, choppy conditions, and undisciplined traders get shaken out before the real move begins.
Long setups are worth building around the $740-741 zone, which aligns with the session low and represents the first line of defense for bulls on any early weakness. Entries in that area carry an initial profit target of $744-745, with a secondary leg targeting $748-749 if buying volume picks up meaningfully. Stops on longs belong below $739 to stay clean against a more decisive breakdown. In a rising market scenario, a sustained move above $748 on improving breadth opens room to add exposure, with targets at $750-751 on the first leg and a push toward $754 if fresh buyers step in, trailing stops up to $746 to protect gains as the trade develops.
Short setups look attractive near the $750-751 zone, where the session high of $751.31 establishes a clear resistance ceiling that sellers already defended once. A failed re-test of that level without a strong catalyst makes for a compelling fade, with initial downside targets at $746-747 and a deeper move toward $743-744 if selling builds momentum. In a declining market scenario, a firm break and close below $742 reopens short entries targeting $740, with stops placed above $744. With the VIX at 16.34, keep stop-loss parameters in the 1.5-2% range from entry, resist the temptation to chase extended moves in either direction, and let price come to your level — the cleanest trades in a low-volatility, mixed-signal environment come from patience, not aggression.
Model’s Projected Range
SPY's projected maximum range for Friday is $739 to $752, with the Call side dominating in an expanding band that suggests trending price action with intermittent chop. Friday brings no economic news due out so the market will trade on technicals. SPY closed at $744.80, down 0.13%, in what was essentially a choppy session that saw the price swing from a high of $751.31 down to a low of $740.03 before settling near the middle of the day's range, with an open of $747.40 suggesting early selling pressure that never fully resolved. SPY remains in the $743 to $745 range that has defined recent trading, with broader macro sentiment continuing to weigh on price action as trade policy uncertainty keeps institutional players cautious. Our model shows the first resistance sitting at $745, and a clean break above that level targets $750 next, while the first support rests at $743 and a failure there puts $742 in play — if the lowest support at $739 gives way, there is little to keep price from falling toward $735. The long-term bull trend remains intact above $640 with SPY well above structural support. As long as price holds above key structural levels, this remains a broader dip-buying environment. Absent a catalyst, resistance sits at $745, $750, $752, $753, while support rests at $743, $742, $740, $739. Given the close at $744.80 just below the first resistance, we favor shorting rallies near $745 until the level is convincingly reclaimed. Bitcoin posted a solid gain of 2.27% closing above $61,366, showing some risk-on appetite in the crypto space, while the MAG stocks were mostly red with Tesla leading the losses down 7.49%, though Apple bucked the trend with a strong 4.84% gain — the divergence between crypto strength and equity leadership weakness is worth watching heading into Friday's session. The VIX closed at 16.34, down 1.51%, suggesting a modest reduction in fear that is consistent with a market digesting recent volatility rather than pricing in fresh risk, though the subdued drop doesn't give bulls a strong green light just yet. SPY closed just above the lower line of its near-term trend channel, with structural support near $743 keeping the broader uptrend structure intact for now.
Market State Indicator (MSI) Forecast
Current Market State Overview:
The MSI ended in a Ranging Market State with SPY closing at $744.80. Since SPY closed inside the MSI range, $743.8 remains support and $748.63 remains resistance heading into Friday. Extended targets were not printing at the close, a signal that while the session saw significant directional movement intraday, the conviction to sustain a trend in either direction had faded by the end of the day. Extended targets were active during the AM session, printing above as price pushed higher off the open, and then printed below during the PM session as sellers took control, but neither set of targets was present into the close. The MSI rescaled to a ranging state overnight and held there through much of the evening before rescaling higher just before the open into a Bullish Trending state with extended targets printing above, which accurately forecast the morning pop. That bullish structure gave way once extended targets stopped printing, and the MSI rescaled lower several times through the remainder of the session in a Bearish Trending state with extended targets printing below, confirming the herd was driving the selloff. SPY found a base near $740 right around the time extended targets below stopped printing, bounced, and ultimately reversed through the bearish structure to close in a very wide Ranging state with a spread of $4.83. That wide range signals more sideways to possibly higher price action on Friday with SPY likely testing both sides of the MSI range. The MSI is forecasting a sideways to slightly lower session for Friday as a continuation of today's action, though without extended targets at the close the move may be modest and is likely to find support at key levels below. MSI support is $743.8 with resistance at $748.63.
Key Levels and Market Movements:
Wednesday we stated, "Bulls want to see overnight price hold above $745.08 MSI support and use that level as a base to push back toward $747.63 resistance and attempt to flip the MSI out of its Bearish Trending state," and added, "Any rally that stalls and reverses near $747.63 resistance is a potential shorting opportunity targeting $745.08 support and the levels below it, while any dip that stabilizes and bounces cleanly at $745.08 is a reasonable long entry targeting $747.63 resistance, though traders should require more confirmation in a Bearish Trending state before leaning long," while also noting, "If the jobs data shifts sentiment sharply and the MSI rescales higher out of its Bearish Trending state, traders must follow that signal without hesitation and adjust their bias to match what the framework is telling them rather than anchoring to the bearish overnight structure."
Thursday delivered exactly what the MSI framework was set up to handle — a session with sharp, clearly defined moves in both directions that gave disciplined traders multiple opportunities on both sides of the tape. Premarket showed no extended targets, offering an early signal that the session could be more complex than a straight continuation of Wednesday's bearish close. SPY opened at $747.40 and the MSI was in a Bullish Trending state with extended targets printing above, which immediately gave bulls a green light and price pushed toward the session high of $751.31. That was the morning's primary long setup, and traders following the MSI had a clear entry near MSI support in the $747 to $748 area with extended targets above guiding price higher. The tell that the AM move was running out of fuel was the MSI itself — once extended targets stopped printing above, the rally stalled near $751 and began to roll over.
What followed was a sharp and sustained reversal. The MSI rescaled lower several times through the remainder of the session in a Bearish Trending state with extended targets printing below, confirming this was not just a routine pullback but a genuine trending move lower with the herd participating. Each rescale lower gave bears a fresh resistance level to sell into and a new target below, and traders who followed those signals were rewarded as SPY dropped from the $751 area all the way to a session low of $740.03. Right near that low, extended targets below stopped printing, SPY found its footing, bounced, and ultimately reversed through the Bearish Trending state to close at $744.80 in a wide Ranging state. That reversal off $740 and the subsequent close near $744.80 set up a clean long off the low as well, rounding out what was a full session of setups in both directions. SPY fell just 0.13% on the day despite an intraday range of more than $11, with trading volume of 46.82 million shares near average. The VIX dropped 1.51% to 16.34, a modest compression in fear that aligns with the mixed and ultimately indecisive close. At minimum it was a 6-for-6 session for traders following the framework. It was a volatile but readable day with substantial setups, all identified through proper context, patience, and flexibility while leveraging the MSI, premarket levels, and market structure rather than forcing trades. The MSI continues to prove its reliability as the cornerstone of our trading process.
Trading Strategy Based on MSI:
Friday has light economic news so the market is likely to move more sideways to down than trend given the Ranging state at the close. That said, the wide $4.83 spread of the current MSI Ranging state gives price meaningful room to work within, and traders should be prepared for SPY to test both boundaries of the range before finding a direction. The absence of extended targets at the close and the Ranging structure both point toward a continuation of today's indecisive tone, with any directional move likely modest and prone to finding support at key levels below rather than breaking down aggressively. The week's heavy economic calendar concludes before Friday, so without a fresh catalyst the path of least resistance is sideways to slightly lower.
Bulls want to see overnight price hold above $743.8 MSI support and use that level as a launching pad to press SPY back toward $748.63 resistance. If bulls can reclaim $748.63 with conviction and the MSI rescales into a Bullish Trending state with extended targets printing above, the sideways to lower thesis gets shelved quickly and the prior session's morning structure could reassert itself. Bears want to see $743.8 fail to hold as support and press price toward the premarket levels below. If that level gives way and the MSI rescales lower into a Bearish Trending state with extended targets printing below, the late session bounce off $740 would come into question and price could revisit those lows. Any rally that stalls and reverses near $748.63 resistance is a potential shorting opportunity targeting $743.8 support and the premarket levels below, while any dip that stabilizes and bounces cleanly at $743.8 is a reasonable long entry targeting $748.63 resistance. Given the Ranging state, failed breakouts and failed breakdowns at either boundary are the highest-probability setups, and traders should wait for confirmation at either level rather than anticipating the move.
Given the wide Ranging state and no extended targets at the close, the setup for Friday favors selling rallies toward $748.63 MSI resistance and buying dips to $743.8 MSI support, with a modest bearish lean if price stalls in the middle of the range and drifts lower. Neither bulls nor bears have clear control coming into Friday, and that ambiguity is precisely what a wide Ranging state reflects. Traders who remain patient and let price come to them at either boundary, then wait for the MSI to confirm the setup, will be best positioned for whatever Friday brings. If a catalyst emerges that shifts sentiment and the MSI rescales out of its Ranging state in either direction, follow that signal without hesitation and do not anchor to the overnight structure.
The long-term bull trend remains intact above $640 and failed breakouts and failed breakdowns continue to offer the highest-probability setups. Remain flexible, avoid trading during Ranging Market States unless a clear failed breakout or breakdown presents itself, and ensure all trades are fully aligned with MSI signals. Providing real-time insights into market control, momentum shifts, and actionable levels, the MSI when integrated with our Pre-Market and Post-Market Reports continues to sharpen execution precision and elevate trade quality. If you haven't yet integrated MSI and our model levels into your process, now is the time. Contact your representative to get started as these tools are designed to support consistency and enhance performance.
Dealer Positioning Analysis
Dealers are selling SPY $750 to $776 and higher strike Calls while buying $745 to $749 Calls, indicating the Dealers' desire to participate in any rally on Friday. The ceiling for Friday appears to be $750. To the downside, Dealers are buying $744 to $670 and lower strike Puts in a 3:1 ratio to the Calls they're selling, displaying moderate concern that prices could move lower. There is a heavy wall of resistance at $750 with little support below, making the zone between $743 and $747 a range of chop — below $743 is bearish and above $747 is bullish. Dealer positioning is unchanged at neutral/slightly bearish.
Looking Ahead to Next Friday:
Dealers are selling SPY $750 to $780 and higher strike Calls while buying $745 to $749 Calls, indicating the Dealers' desire to participate in any rally next week. The ceiling for the week appears to be $753 and $760. To the downside, Dealers are buying $744 to $660 and lower strike Puts in a 3:1 ratio to the Calls they're selling, displaying moderate concern that prices could move lower. Dealers continue to flip flop their hedges at various levels, signaling real uncertainty about what may follow next week — they appear hedged for any outcome, and we recommend traders do the same. We remain bullish above $748 but bearish below $746. For the week Dealer positioning is unchanged at neutral/slightly bearish. We advise reviewing Dealer positioning daily for directional clues. These positions evolve quickly and tracking them is essential for staying ahead of shifting market sentiment.
Recommendation for Traders
With SPY closing at $744.80 and VIX cooling to 16.34, the market remains in a cautious, range-bound posture. Watch $740 as key intraday support — a hold there keeps modest long setups on the table, while a breakdown invites short exposure. Favor longs only on confirmed bounces and keep stops tight.
Don't oversize positions in a mixed-signal tape like this. Manage risk carefully and stay disciplined. Review the premarket analysis posted before 9 AM ET for any changes in the model's outlook and Dealer Positioning.
Good luck and good trading!
