
Market Insights: Wednesday, July 29th, 2026
Market Overview
US stocks took a hard hit Wednesday as a perfect storm of Fed uncertainty, chip stock weakness, and renewed Middle East tensions slammed the major indices. The Dow plunged more than 1,100 points, or 2.2%, while the S&P 500 dropped 1.5% and the Nasdaq sank about 1.7% as the chip selloff continued to deepen. The Fed voted to hold rates steady, but three FOMC members dissented in favor of a hike — a rare split that rattled bond markets and sent long-dated Treasury yields climbing, reminding investors that inflation is still running well above the 2% target.
The chip trade got hit again after SK Hynix posted surging second quarter profits that still came in below Wall Street's expectations, reigniting fears that AI momentum may be losing steam. Oil prices also jumped back into the mix, with Brent crude surging more than 7% back above $90 per barrel after Iran launched what US Central Command called an "attempted surprise attack" on Tuesday — a sharp reversal from last week's brief pause in hostilities. After the bell, all eyes shifted to Microsoft and Meta for their quarterly results, which could prove make-or-break for tech after Alphabet's capex guidance spooked markets last week. Starbucks, Chipotle, Qualcomm, and Arm Holdings were also on deck to report.
SPY Performance
SPY opened at $739.97 and spent the early part of the session trying to build on recent progress, tagging a high of $742.67 before the bottom fell out. From that peak, sellers took control and drove price all the way down to a low of $729.10 — a drop of more than thirteen points from the intraday high — and the close at $729.52 made it clear there was no late-day rescue coming. That kind of top-to-bottom reversal isn't just a bad day; it's a statement. The bulls couldn't hold a single gain, and the bears made sure everyone knew it.
SPY closed down 1.53%, erasing the cautious progress that had been building and then some. Volume came in at 59.97 million shares, near average, which means this wasn't a low-conviction drift lower — real sellers showed up and did real damage. The VIX confirmed the shift in mood, surging 9.34% to close at 19.91, a sharp jump that signals fear is creeping back into the equation after just starting to fade. The pattern that had been frustrating bulls — open strong, fade mid-session — just got a whole lot worse. Today wasn't a fade; it was a full reversal with follow-through to the downside. Until SPY can stop putting in lower highs and closing near session lows, the path of least resistance remains down, and any bounce attempt needs to be treated with serious skepticism.
Major Indices Performance
The Dow was the biggest decliner on the day, which flips the recent script in a notable way — the blue-chip index that had been holding up the best suddenly became the hardest hit, dropping 2.19%. That's a significant shift in character. When the Dow leads to the downside with that kind of margin, it signals that the selling wasn't just concentrated in high-beta growth names — it was broad, it was real, and it had weight behind it. The rotation trade that had been propping up value and cyclicals clearly hit a wall today.
The Nasdaq fell 1.74%, which actually made it a relative outperformer compared to the Dow — a sentence that wouldn't have made sense earlier this week. Growth names still got hit, but the fact that the Dow fell harder tells you this was a macro-driven selloff more than a tech-specific one. The S&P 500 also closed deeply in the red, and the across-the-board nature of the losses paints a picture of a market reacting to pressure from multiple directions at once rather than a targeted rotation.
The Russell 2000 dropped 1.6%, landing in the middle of the pack. Small-caps didn't escape the carnage, but they also didn't lead it — which is a modest distinction without much comfort attached to it. The message from today's tape is straightforward: there was nowhere to hide. Every major index finished solidly in the red, the pecking order from recent sessions got scrambled, and the selling pressure was distributed broadly enough to suggest this wasn't just sector rotation — it was risk coming off the table.
Notable Stock Movements
NVIDIA grabbed the spotlight for all the wrong reasons today, leading the Magnificent Seven lower with a -3.55% drop that set the tone for what turned out to be a rough session across the group. A loss of that size from the cohort's most momentum-driven name carries real weight — when NVIDIA sells off with conviction, it tends to pull risk appetite down with it, and that's exactly what happened today.
The rest of the Magnificent Seven fell mostly in line with NVIDIA's bearish lead, with the group posting a predominantly red session. Alphabet was the lone holdout, managing to finish green and standing as the only name bucking the broader selloff. That kind of isolated green finish from one stock doesn't exactly scream broad-based buying interest — it's more of an outlier than a signal that the group is finding support. The contrast between today and yesterday is sharp. What was a constructive, mostly green session for these names has flipped back into net negative territory, and NVIDIA's outsized decline was the engine behind that reversal.
For broader market sentiment, a Magnificent Seven that's mostly red and led lower by its highest-beta name is a meaningful warning sign. These stocks carry enormous index weight, and when they're selling off in unison, the damage to growth-oriented portfolios compounds quickly. The fact that the Dow, Nasdaq, and Russell 2000 all fell in tandem today confirms this wasn't just a rotation story — it was broad-based selling pressure, and the Magnificent Seven both reflected and amplified it. Until NVIDIA and its peers stabilize, the growth trade remains on shaky ground.
Commodity and Cryptocurrency Updates
Crude oil surged 7.18% today, closing at $84.95, a sharp move higher that puts the commodity firmly in territory that demands attention. This kind of rally well above $70 signals that the energy market is responding to something bigger than just day-to-day fluctuations — geopolitical tensions and supply dynamics are clearly doing the heavy lifting here. At $84.95, crude is running hot, and a sustained stay at these levels keeps inflationary pressure very much alive. That's a headache for the Fed, which needs energy costs to cool down, not rip higher. If crude digs in above $70 and continues pushing toward the mid-to-upper eighties, the path to any meaningful policy shift gets even narrower.
Gold had a strong session, climbing 2.08% to close at $4,120, bouncing decisively off the area near $4,000 that was flagged as the key floor to watch. That's a convincing response. The metal is back above its recent consolidation zone and the bulls have reasserted control. The same fundamental drivers that have been supporting gold — global uncertainty, central bank demand, and an unresolved rate environment — are clearly still in play, and today's move reinforces the view that the longer-term uptrend remains intact.
Bitcoin slipped 0.65% today, closing just above $63,455, a modest pullback that keeps the broader structure in a holding pattern. It's not a damaging move, but crypto hasn't found the spark it needs to push decisively higher. Holding above $63,000 matters here — that level has served as a reference point for bulls, and losing it would invite more selling pressure. For now, the structure is intact, but Bitcoin needs a stronger catalyst to shift the tape in its favor.
Treasury Yield Information
The 10-year Treasury yield reversed course today, climbing 0.39% to close at 4.620%. After three consecutive sessions of easing, that pullback momentum has officially stalled — and the timing couldn't be worse given the broad equity selling already underway. The yield is now pushing further into the pressure zone above 4.5%, and the modest relief that had been building over the prior sessions has been effectively erased in one move.
Inside the framework, the situation remains uncomfortable. At 4.620%, equities are dealing with a structural headwind that isn't going anywhere. The 4.8% level — where broad market selling tends to accelerate — sits about 18 basis points away, which is still some distance, but that gap narrows faster than most investors expect when yield momentum turns higher. Today's uptick is a reminder that the three-day pullback may have been exactly what it looked like — the bond market catching its breath before the next leg higher, not a genuine shift in direction.
The key level to watch remains 4.5%. Yields never broke convincingly below it during the pullback, and now they're moving away from it again rather than toward it. As long as we're sitting at 4.620% and trending the wrong way, the equity headwind is real and present. A continued push toward 4.8% would put the market on high alert, and with today's broad selling already rattling sentiment, additional yield pressure would be particularly damaging. Bulls need yields to reverse and make a serious run below 4.5% — right now, that scenario feels further away than it did 24 hours ago. Stay alert.
Previous Day’s Forecast Analysis
Wednesday's forecast called for SPY to trade within a fourteen-point range, with $732 marking the downside floor and $746 serving as the maximum upside target. The bias heading into the session was effectively neutral, with Tuesday's close at $740.76 sitting right in the middle of the projected window and neither bulls nor bears holding a clear structural edge. The options landscape was put-dominated, which kept the burden squarely on buyers to prove themselves rather than simply hold ground.
The key level to watch was $740 — the round-number gate where gamma flips positive and buyers regain a meaningful tailwind. A reclaim of that level opened $742 and $743 as upside targets, with $745 as the major call wall and $746 capping the move entirely. On the downside, $738 was the first line to respect, with $737 identified as the critical battleground where the heaviest put wall sits and selling could accelerate quickly. Below there, $736 and $735 were the last defenses before $732 came into play, with $730 lurking as the ultimate put wall floor.
The recommended trading strategy leaned on patience and confirmation over urgency. Position sizing was suggested in the 70-75% of normal exposure range given VIX cooling to 18.22, with stop-losses in the 1.5-1.75% range from entry. In a falling scenario, a failure to hold $739-740 set up a short targeting $736-737 initially, with stops above $743. In a rising scenario, a clean push above $742.79 with improving breadth was the long trigger targeting $745-746 and then $748-749, while the more conservative entry was a confirmed bounce off $736-737 support targeting $740-741. The overall message was to let the tape confirm direction before adding size.
Market Performance vs. Forecast
Wednesday's session delivered a sharper selloff than the base case projected, with external pressure driving price action below the model's expected range floor. The forecast had established $732 as the downside boundary of the expected move, with $730 flagged as the ultimate put wall floor — yet price broke through both levels and closed at $729.52, with an intraday low of $729.10 that pushed beneath that structural floor. The model does not account for unpredictable external catalysts, and when those forces hit with enough conviction, they can overwhelm even well-constructed gamma frameworks. Geopolitical developments and surprise macro inputs introduced volatility that exceeded the model's base case scenario — that's the honest read on Wednesday's tape.
That said, the forecast got meaningful pieces of the directional picture right. The analysis had explicitly flagged that a failure to hold $739-$740 on the open would set up the bearish scenario — and Wednesday's open at $739.97 followed by an inability to reclaim that $740 gamma flip level triggered exactly the downside sequence the model described. The forecast warned that losing $738 cleanly would open a negative gamma pocket where downside could accelerate quickly, and that's precisely what unfolded. The structural map was correct — the market just kept going. The short setup targeting $736-$737 initially would have captured real movement before the deeper extension took hold, and traders who honored stops above $743 had well-defined risk from the outset. Risk management protocols protected capital as the tape moved beyond the projected range. VIX surging 9.34% to 19.91 confirms the volatility expansion the model's negative gamma warnings had flagged as a real risk below key support. The framework identified the right structural tensions — Wednesday simply delivered an outsized resolution of them, and that's the kind of session where discipline and defined risk matter most. The model adapts, the level architecture remains valuable, and the next session brings fresh opportunity.
Premarket Analysis Summary
The premarket analysis posted at market open identified SPY spot at $740.55 in a barely call-dominated environment described as fragile and tentative following a recent slide. The expected move was framed with $750 as the maximum upside cap and $731 as the maximum downside floor. The defining gate above was set at $742 — the heaviest positive gamma strike where clearing it with conviction would flip the structure constructive. Above that, $744 was the first target where positive gamma builds, $746 marked the next decision point, and $748 held the major call wall before $750 capped the move. The bias leaned cautiously bullish but with the thinnest of call-dominance margins, and the analysis was explicit that $742 needed to be reclaimed and held with conviction — until then, any bounce was to be treated as tentative. On the downside, $740 was flagged as the immediate round-number pivot where gamma turns negative, with a clean break there expected to open the door quickly to $739 and accelerate selling through the negative gamma pocket toward $737. Below that, $735 was identified as the critical battleground holding a significant put wall and deep negative gamma, with $731 as the max downside target at the bottom of the expected move.
The actual session delivered a swift and decisive answer to the downside. SPY opened at $739.97, immediately below the $740 pivot and never once mounted a credible challenge at the $742 gate. Price briefly nudged to a high of $742.67 — technically tagging the target — before sellers took full control. The slide accelerated exactly as warned once $740 gave way cleanly, slicing through $739, $737, and $735 before collapsing all the way to a session low of $729.10, blowing past the $731 max downside target and extending well beyond the expected range. SPY closed at $729.52, deep in negative gamma territory and far outside the framework, with the VIX surging 9.34% to 19.91 — confirming the kind of fear-driven breakdown the downside structure had flagged as a real risk if $735 failed to hold.
Validation of the Analysis
Wednesday's session validated the premarket framework in a decisive and painful way, with SPY following the downside roadmap with striking precision from the opening bell. The open at $739.97 landed right on top of the 740 round-number pivot the analysis flagged as the first critical level to watch — and within the first moments of trading, price slipped just below it, triggering exactly the warning the premarket issued. The analysis was explicit: losing 740 cleanly opens the door lower, and that's exactly what the market delivered. Traders who had that level circled knew immediately what the tape was communicating.
The premarket laid out a clear chain reaction on the downside — 740 breaks, 739 accelerates the selling, and a breach of 739 puts 737 in play through the negative gamma pocket before arriving at 735 as the point of last hope. That script played out in full. SPY sliced through 739, accelerated lower through the 737 negative gamma zone, and blew past the 735 put wall the analysis described as a critical battleground. The session low of $729.10 confirmed that 735 ultimately failed to hold, which the premarket had acknowledged as the path to the 731 max downside level and beyond. The close at $729.52 settled just below that 731 floor, showing the market extended the move but never deviated from the directional structure the analysis outlined. The VIX surging 9.34% to 19.91 confirmed the sentiment deterioration the downside framework warned about. The intraday high of $742.67 also validated the analysis — price briefly tagged the 742 gate before being firmly rejected, underscoring that level's role as the key upside tell. Every major price event on Wednesday had a corresponding level in the premarket roadmap, making this an exceptionally actionable and accurate guide for the session.
Looking Ahead
Thursday brings a one-two punch of high-impact data that could easily match the volatility of the FOMC decision. Advance GDP for the second quarter drops first, giving traders their first real read on how the economy performed over the past three months. This number carries serious weight the morning after the Fed delivered its rate decision, because a strong or weak GDP print will immediately be filtered through whatever Powell said at the press conference — either validating or complicating the Fed's current posture. A soft GDP reading could reignite recession fears and push rate-cut expectations forward, while a beat could shift the narrative toward a stronger-for-longer economy.
Core PCE Price Index lands alongside it, and that one matters just as much. Core PCE is the Fed's preferred inflation gauge, so getting it the day after an FOMC meeting creates a unique setup where the market can immediately judge whether the Fed's tone was justified. If Core PCE comes in hotter than expected, expect the bond market to react fast and equities to feel the pressure. If it cools, it gives the Fed cover and could support a continuation of whatever move Wednesday's decision triggered. Come in Thursday with your levels set — the combination of GDP and Core PCE in the same session creates real potential for sharp, decisive price action right out of the gate.
Market Sentiment and Key Levels
The directional bias today tilts firmly bearish, and the session's price action leaves little room for debate about who's in control. SPY opened near $740, briefly pushed to a high of $742.67, and then spent the rest of the day getting sold down to a close of $729.52 — a loss of 1.53% that wiped out recent progress and left the index sitting near its lows of the day. The VIX surging 9.34% to 19.91 is a clear warning sign that fear is creeping back into the market, and broad-based weakness across all major indices with the Dow getting hit hardest confirms this wasn't just sector rotation — it was distribution. Volume came in at 59.97 million shares, near average, which means the selling wasn't panicked but it was consistent and purposeful. When the market drops more than 1.5% on steady, methodical volume, that's not noise — that's intent.
Key resistance now sits at $742.67, today's intraday high, which the market tagged at the open before rejecting hard. A reclaim of that level with conviction would be encouraging for bulls and put the $745 to $747 zone back in play. But the more immediate story is on the support side. The $729.10 session low is the line in the sand, and a decisive close below it opens the door to $725 and potentially $722 if sellers maintain pressure. Gold's 2.08% surge to $4,120 tells you safe-haven demand is alive and well, and that's not typically the kind of environment where equities bounce cleanly. Bitcoin's mild decline and crude oil's sharp 7.18% jump to $84.95 add energy-driven inflation concerns to the mix, which could keep pressure on risk assets if that theme persists. With the VIX now approaching 20, the bulls need a strong catalyst and a reclaim of $742.67 to shift the narrative — until then, the bears have the upper hand.
Expected Price Action
Thursday's session presents actionable intelligence generated by our AI model, with SPY projected to trade within a range defined by $731 on the downside and $750 as the max upside target. That nineteen-point window is well above the trending threshold, meaning Thursday is set up to move with conviction in one direction rather than grind sideways. With Wednesday's close at $729.52 sitting below the bottom of the expected move, the bias leans bearish heading into Thursday, and the burden falls squarely on the bulls to reclaim lost ground quickly or risk further deterioration.
The defining level to watch Thursday is $742 — that's the gamma gate above current spot where the structure turns constructive, and bulls need to clear it with conviction to flip the tone from defensive to offensive. First target above $742 is $744 where positive gamma builds, then $746 marks the next meaningful decision point. Above there, $748 serves as the major call wall with $750 capping the expected move as the absolute upside ceiling. On the downside, $740 is the first level to respect — losing it cleanly opens the door for acceleration lower through a negative gamma pocket. Below $740, $739 is where selling could pick up real speed, and a clean break of that level puts $737 in play, followed by $735 as the critical battleground where the heaviest put wall sits and bulls make their last stand. A failure at $735 clears a fast path toward $731, the bottom of the expected move. With VIX elevated above 19 after Wednesday's sharp spike, the negative gamma environment below means downside moves can still accelerate with little cushion — if $740 fails early Thursday, expect minimal support until $735, and the broader recovery narrative doesn't gain credibility until $742 is reclaimed and held.
Trading Strategy
The VIX rising 9.34% to 19.91 is a notable step higher in fear that traders need to respect. We're not in panic territory, but 19.91 is getting close to the 20 threshold that tends to mark a shift in market psychology — where hedging activity picks up and institutional players start reducing exposure more aggressively. At this level, position sizing should be trimmed toward the 50-60% of normal exposure range. The elevated reading reflects genuine uncertainty, and that means stop-losses need to be tighter than usual — keep them in the 1.25-1.5% range from entry. Don't let a volatile tape chew through capital while you wait for a setup to develop. Let price confirm direction before adding size, and lean defensive until VIX shows signs of rolling back below 19.
The session left behind a clear breakdown structure to work with heading into the next session. In a falling market scenario, a failure to reclaim $732-733 on the open sets up a short entry targeting $727-728 initially, with a clean break below $729.10 confirming that the prior session low is giving way and opening a path toward $725-726 as the next meaningful support. Stops on short trades belong above $735 to keep risk contained against any sharp intraday reversal. The near-average volume accompanying the session's heavy selling doesn't suggest exhaustion just yet — no climactic flush, no clear capitulation spike — meaning further downside is a real possibility if bulls can't reclaim ground quickly.
In a rising market scenario, the first test is whether SPY can reclaim $732-733 and hold it with conviction. A clean push back above that zone with broad market participation is the long trigger, targeting $736-737 first and then $740 on sustained follow-through. The more conservative long entry is a confirmed bounce off the $725-726 support zone with visible buying volume stepping in, targeting $729-730 as the first profit zone and $732 on continuation. Stops on longs belong below $724 to guard against a failed bounce turning into a deeper leg lower. With VIX at 19.91 and the tape under pressure, patience is the most valuable tool — wait for your level, confirm the move, and prioritize capital preservation over trying to catch every swing.
Model’s Projected Range
SPY's projected maximum range for Thursday is $718 to $740, with the Put side dominating in an expanding band that suggests trending price action with intermittent chop. Thursday brings Advance GDP q/q and Core PCE Price Index m/m, both high-impact releases likely to produce significant volatility particularly in the first hour of trading. Wednesday's session was a rough one, with SPY opening at $739.97, tagging a high of $742.67, then selling off hard to a low of $729.10 before closing at $729.52, down 1.53% on the day as sellers clearly took control into the close. SPY remains in the $725 to $730 range that has defined recent trading, with ongoing trade policy uncertainty continuing to weigh on sentiment and keeping buyers cautious near recent highs. Our model shows the first resistance at $730 — a clean break above that level puts $735 in play — while the first support sits at $725, and a breach there opens the door toward $720, and if that gives way there is little to keep price from falling toward $715. The long-term bull trend remains intact above $640 with SPY well above structural support. As long as price holds above key structural levels, this remains a broader dip-buying environment. Absent a catalyst, resistance sits at $730, $735, $740, $743, while support rests at $725, $720, $718, $715. Given the close near the lower end of the range, we favor buying dips at $725 rather than chasing strength into resistance. Bitcoin slipped 0.65% to close above $63,455 while MAG stocks were mostly red across the board, led lower by NVIDIA dropping 3.55%, with Alphabet the lone bright spot gaining 0.90% — sustained weakness across both leadership groups would be required to signal a deeper pullback. The VIX closed at 19.91, up 9.34%, suggesting elevated fear given the sharp intraday reversal and the weight of Thursday's major economic releases looming overhead. SPY closed near the lower line of its trend channel, with structural support nearby at $725, and a failure to hold that level would signal potential for further downside in the sessions ahead.
Market State Indicator (MSI) Forecast
Current Market State Overview:
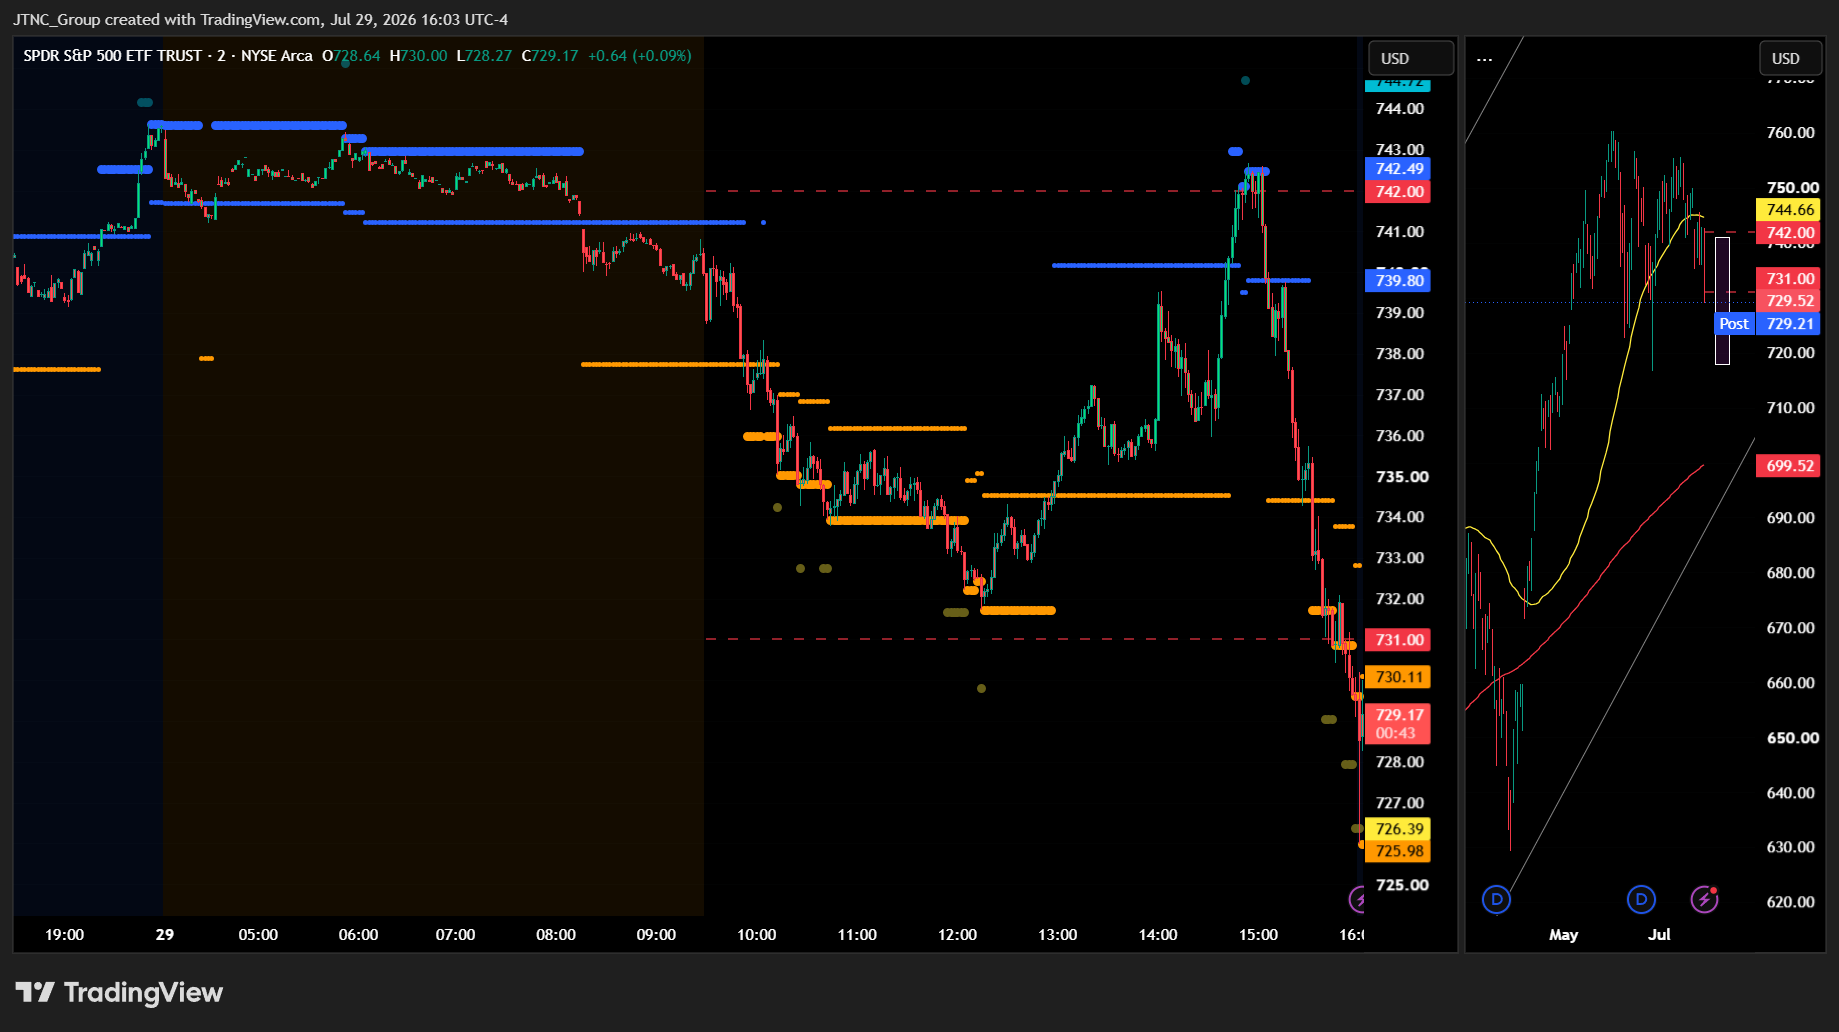
The MSI ended in a Bearish Trending Market State with SPY closing at $729.52. MSI resistance is $730.11 and support is $725.98 heading into Thursday. Extended targets were not printing at the close. Extended targets were active during the AM session printing below as the early selloff drove price lower, and again during the PM session as the market collapsed following news that the White House would resume bombing Iran. No extended targets were visible in premarket. The MSI rescaled higher overnight without extended targets into a narrow bullish state, but by the open had moved back to a ranging state before quickly transitioning to a bearish state with extended targets below. SPY fell hard toward the $731 area where extended targets stopped printing and the market briefly reversed. The largest move higher came after FOMC held rates steady with the MSI rescaling to a bullish state, but without meaningful extended targets above, SPY stalled and began to fade. When the Iran news hit, the MSI rescaled lower rapidly in a wide bearish state with extended targets below, driving SPY to lows not seen all week or the week prior. The wide $4.13 spread reflects real directional conviction from the bears and leaves meaningful room for price to move. We said yesterday the MSI was forecasting that SPY would test both the day's highs and lows while any external catalyst could change the market's direction, and today played out true to form. For Thursday the MSI is forecasting a slow grind lower, though without extended targets at the close the downside may be limited and is likely to find support at key levels below. MSI support is $725.98 with resistance at $730.11.
Key Levels and Market Movements:
Tuesday we stated, "the MSI is likely to range until the announcement and perhaps test both today's highs and lows," and added, "any catalyst from the Fed may change the market's direction and set up a longer term trend," while also noting, "post-FOMC, follow the MSI signal and trade with the trend that emerges." Wednesday delivered all of that and more. SPY opened at $739.97 in a bullish state overnight before fading into the open as the MSI transitioned to a ranging state and then quickly to a bearish state with extended targets below. That shift gave traders the first short setup of the day as the MSI signaled a directional change with conviction. Price fell toward the $731 area where extended targets stopped printing and the market reversed, giving traders a clean long entry as the MSI confirmed the stall. That bounce was the second setup of the day and it carried price higher into the FOMC announcement. When the Fed held rates steady the MSI rescaled to a bullish state and SPY pushed toward the session high of $742.67, offering another long opportunity on the continuation. That was setup number three. But without extended targets above, the rally lacked follow-through and SPY began to drift lower. Then the White House announced it would resume bombing Iran and the MSI rescaled lower rapidly in a wide bearish state with extended targets below. That decisive rescaling gave traders a high-conviction short entry and setup number four as SPY fell hard to the session low of $729.10. As extended targets continued printing below, price tracked lower and eventually closed at $729.52, which was setup number five for those trading the continuation into the close. SPY fell 1.53% on the day with volume coming in at 59.97 million shares, near average. The VIX surged 9.34% to 19.91 as fear spiked on the geopolitical headline. It was a volatile but readable day with substantial setups, all identified through proper context, patience, and flexibility while leveraging the MSI, premarket levels, and market structure rather than forcing trades. At minimum it was a five-for-five session for traders following the framework. The MSI continues to prove its reliability as the cornerstone of our trading process.
Trading Strategy Based on MSI:
Thursday has heavy economic data with Advance GDP quarter over quarter and Core PCE Price Index month over month which can introduce significant volatility, so traders should be ready to trade what they see rather than predict. The MSI is forecasting a slow grind lower heading into Thursday, though without extended targets printing at the close the downside may be limited and price is likely to find support at key levels below. The wide $4.13 Bearish Trending spread confirms bears have control and any rally toward MSI resistance is a potential shorting opportunity as long as the state holds. That said, the absence of extended targets at the close means the move lower may be modest rather than aggressive, and support levels below deserve respect.
Bulls want to see overnight price stabilize and push back above $730.11 MSI resistance with conviction. If price can reclaim that level and hold it heading into the GDP and PCE data, the MSI may rescale higher and open the door toward $735 and beyond. If the economic data surprises to the upside and the MSI rescales higher with extended targets printing above, the relief rally could accelerate quickly and give longs a meaningful setup off the $730.11 level.
Bears want to see $725.98 MSI support fail. If price breaks below that level and extended targets begin printing below, the next leg lower could push SPY toward levels not yet tested this week. Any rally toward $730.11 that stalls and fails is the highest-probability short setup for Thursday. Bears remain in control as long as the MSI holds in a Bearish Trending state and price stays below resistance. The GDP and PCE data could serve as a catalyst in either direction, so patience before the data drops and discipline in following the MSI signal after it prints will be key. Failed breakouts near $730.11 and failed breakdowns near $725.98 remain the cleanest setups regardless of direction.
The long-term bull trend remains intact above $640 and failed breakouts and failed breakdowns continue to offer the highest-probability setups. Remain flexible, avoid trading during Ranging Market States unless a clear failed breakout or breakdown presents itself, and ensure all trades are fully aligned with MSI signals. Providing real-time insights into market control, momentum shifts, and actionable levels, the MSI when integrated with our Pre-Market and Post-Market Reports continues to sharpen execution precision and elevate trade quality. If you haven't yet integrated MSI and our model levels into your process, now is the time. Contact your representative to get started as these tools are designed to support consistency and enhance performance.
Dealer Positioning Analysis
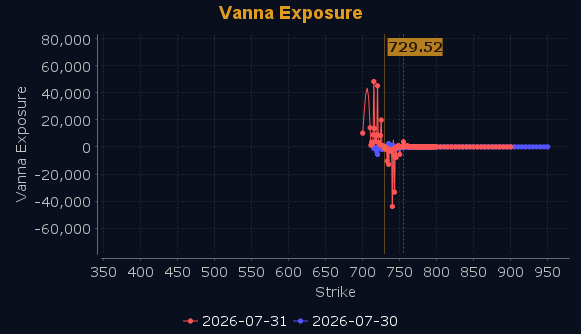
Dealers are selling SPY $751 to $775 and higher strike Calls while buying $730 to $751 Calls, indicating the Dealers' desire to participate in any rally on Thursday. The ceiling for Thursday appears to be $735. To the downside, Dealers are buying $729 to $676 and lower strike Puts in a 4:1 ratio to the Calls they're selling, displaying heightened concern that prices could move lower. Dealers are also selling Puts at $720 to $728, and Dealers do not sell ATM Puts unless they believe there is a floor in the market at $720. This is a risky move by the Dealers as they are anticipating a move higher on solid corporate earnings, buying small quantities of ATM Calls to capitalize on any potential rally while simultaneously selling ATM Puts in size. We are well below the 50 DMA and the 200 DMA is just $20 away, as is the long term bull trend line, and it would not surprise us in the least to see these levels challenged in the near term. Dealers remain heavily hedged but have not added to their positions, which means Dealers believe the market is fairly priced. For Thursday below $742 is bearish and above $743 is bullish with little resistance above $743, but support builds as prices fall toward $720 with $726 looking like a spot where the market may find buyers. Dealer positioning is unchanged at neutral/slightly bearish.
Looking Ahead to Next Friday:
Dealers are selling SPY $751 to $782 and higher strike Calls while buying $730 to $750 Calls, indicating the Dealers' desire to participate in any rally this week. The ceiling for the week appears to be $755. To the downside, Dealers are buying $729 to $680 and lower strike Puts in a 4:1 ratio to the Calls they're selling, displaying heightened concern that prices could move lower. Dealers are still heavily hedged heading into earnings season but have not increased their protection meaningfully. Dealers are buying large quantities of ATM Calls looking to participate in any rally this week. We advise traders to remain bullish above $746 but below $743 stay bearish. There is support at $725 and $720 with resistance at $733 and $735 which will slow any ascent. For the week Dealer positioning is unchanged at bearish. We advise reviewing Dealer positioning daily for directional clues. These positions evolve quickly and tracking them is essential for staying ahead of shifting market sentiment.
Recommendation for Traders
With SPY closing at $729.52 and VIX surging 9.34% to 19.91, the tape is flashing caution — favor shorts on any failed bounces near $733–$735 resistance and keep longs off the table until buyers show real conviction. Tight stops are non-negotiable in this environment.
Risk management is everything right now — size down, define your stops before entry, and don't force trades into volatile conditions. Review the premarket analysis posted before 9 AM ET for any changes in the model's outlook and Dealer Positioning.
Good luck and good trading!
