Market Insights: Tuesday, July 29th, 2025
Market Overview
Stocks slipped Tuesday, snapping a six-day winning streak for the S&P 500, as investors juggled a torrent of earnings and fresh economic data while preparing for Wednesday’s pivotal Federal Reserve decision. The S&P 500 lost about 0.3%, while the Nasdaq dipped 0.4% and the Dow dropped by nearly 200 points, or 0.4%. With the Fed's two-day policy meeting underway, traders are anticipating rates to hold steady but remain laser-focused on any signal that a September rate cut might be in play.
Economic data added to the uncertainty. June’s JOLTS report showed a decline in both job openings and hirings, potentially signaling softening in the labor market ahead of Friday’s critical nonfarm payrolls report. Meanwhile, consumer confidence edged higher in July, though anxiety over job availability persisted. Trade headlines also kept markets on edge. U.S. officials in Stockholm confirmed that President Trump would decide by Friday whether to extend the tariff truce with China. Treasury Secretary Scott Bessent floated another 90-day extension, citing only minor unresolved issues with Beijing.
Corporate earnings fueled further churn. Boeing beat expectations, lifting sentiment in pockets of the market, but misses from Spotify, Merck, and UnitedHealth weighed on broader sentiment. Starbucks added to the downbeat tone after reporting a sixth consecutive decline in U.S. same-store sales. A 4% drop in comparable transactions dragged domestic sales down 2%, matching the previous quarter but better than the expected 2.5% slide. Internationally, growth in China was underwhelming, and global same-store sales slipped 2%, missing estimates. Starbucks shares closed down 0.8% as investors questioned the pace of their turnaround.
SPY Performance
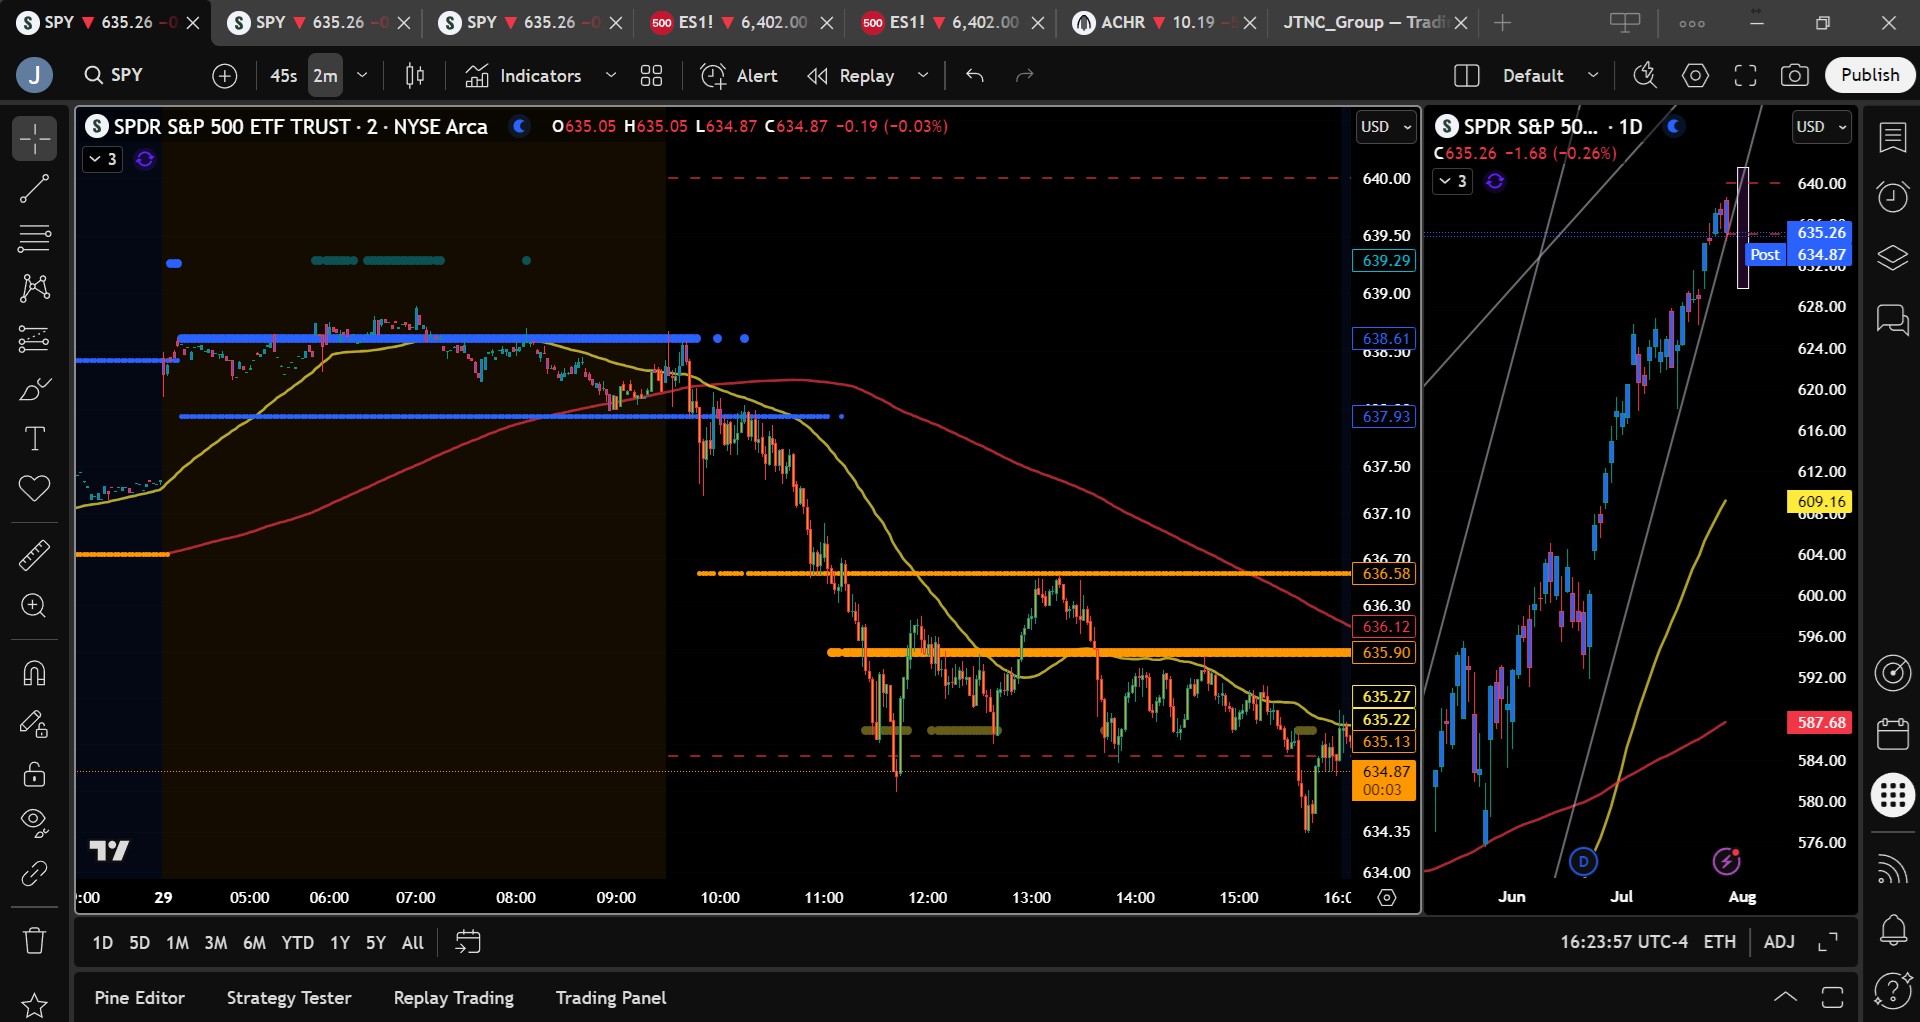
SPY ended Tuesday down 0.27% at $635.22, pulling back from an open at $638.34 after briefly hitting a high of $638.67 before dipping as low as $634.34. Volume was light at 57.41 million shares, below the average, and typical for sessions preceding major macro events. The decline marked a pause in the recent uptrend as SPY consolidated near key support, reinforcing the market’s cautious posture ahead of Wednesday’s rate decision.
Major Indices Performance
It was a broadly negative day across the major indices. The Nasdaq led the losses, falling 0.38%, followed by the Dow, which slipped 0.46%, and the Russell 2000, which dropped 0.55%. The S&P 500 dipped 0.27%, snapping its six-day streak of record closes. Investor caution prevailed amid soft job market data, trade uncertainty, and mounting anticipation over the Fed's next move. Sector performance was mixed, with tech and cyclicals fading while some defensives attempted to hold ground. Overall, earnings jitters and macro unease combined to cool recent momentum.
Notable Stock Movements
It was a mixed day for the Magnificent Seven. Alphabet and Microsoft bucked the trend with small gains, helping cushion broader tech weakness. However, the rest of the group fell, led by a 2.45% drop in Meta, which weighed heavily on sentiment. Tesla, Apple, Amazon, and Netflix also slipped into the red, reflecting a general retreat in growth names as traders turned cautious ahead of Big Tech earnings and the Fed’s statement. The divergence among the group underscores selective positioning in an increasingly data-sensitive market.
Commodity and Cryptocurrency Updates
Crude oil surged 4.15% to close at $69.48, continuing a sharp bounce that defies the model’s longer-term forecast of a move toward $60 later this year. The recent rally may reflect short-term supply risks and speculative trading ahead of inventory reports. Gold gained 0.43% to finish at $3,381, reversing its recent downtrend as investors showed a slight preference for safety amid market jitters. Bitcoin eased 0.32% but held above $117,700, remaining stuck in a tight consolidation pattern with little speculative enthusiasm for a breakout.
Treasury Yield Information
The 10-year Treasury yield dropped 2.70% to close at 4.322%, easing some of the upward pressure that has lingered over equity markets. While yields remain elevated, this decline likely helped cushion risk assets slightly. Traders remain acutely focused on the 4.5% threshold, with levels above 4.8% posing risk of a more aggressive market correction. For now, the retreat in yields provides some breathing room as investors await guidance from the Fed.
Previous Day’s Forecast Analysis
Monday’s forecast expected SPY to trade between $634 and $640 with a bullish bias above $635, projecting targets at $640 and $643. The strategy emphasized long trades near $635 and $632 with profit-taking near resistance and warned of fading momentum near key levels. A break below $635 was expected to bring tests of $632 or lower, while bulls were favored to control the market if SPY held above that level. The overall setup anticipated a choppy, sideways session with upside attempts fading into consolidation.
Market Performance vs. Forecast
Tuesday’s trading played out largely as forecasted. SPY opened at $638.34, touched a high of $638.67, and fell to a low of $634.34 before closing at $635.22, well within the projected $634 to $640 range. The key $635 support level was tested and briefly lost intraday, but it held on the close, validating the model’s view that bulls would defend the area. While SPY never tested the upper resistance near $640 or $643, the expected stall and fade materialized after the open, offering profitable short entries for traders watching for the projected tumble beneath the bias level. The intraday action reaffirmed the importance of playing within the model’s levels, especially as pre-FOMC uncertainty grew.
Premarket Analysis Summary
In Tuesday’s premarket analysis posted at 8:40 AM, SPY was trading at $638.33 with a defined bias level at 638. The outlook called for a fragile attempt at a rally, with targets above at $640 and $643 and downside support at $636.50 and $635. The model favored long trades only if momentum stayed strong above 638 but leaned toward short entries on a breakdown below the bias level. The analysis warned of a likely stall and slip toward support if SPY failed to sustain early strength, advising profit-taking near $635 and caution if the level failed to hold.
Validation of the Analysis
Tuesday’s market movement validated the premarket analysis closely. SPY failed to hold above the $638 bias level for long and quickly began to retreat, falling through the anticipated support zones to tag $634.34 before bouncing back into the close. The day’s stall and decline mirrored the projected setup, and those who followed the strategy had solid short trade opportunities as SPY moved toward the $635 level. Long entries were only briefly viable early in the session, just as the model suggested, reinforcing the accuracy of the day’s roadmap. The analysis was once again reliable and actionable for traders.
Looking Ahead
Wednesday brings the much-anticipated FOMC interest rate decision along with the ADP employment report. Both releases could dramatically impact market direction, with traders watching for any shift in the Fed’s tone that might suggest a rate cut is on the table for September. With PCE and jobless claims coming Thursday, and Friday’s monthly jobs report on deck, the midweek session is shaping up to be the most volatile of the week. Markets could move sharply on any surprise, so traders should remain nimble.
Market Sentiment and Key Levels
SPY heads into Wednesday’s session trading near $635.22, with the market showing signs of cautious optimism ahead of the Fed. Sentiment remains tentatively bullish, but the failed breakout above $638 and the late-day bounce off $634 suggest bulls are defending key ground while avoiding overcommitting. Resistance levels for Wednesday are at $637, $640, $643, and $646. Support lies at $635, followed by $630, $627, and $625. A break above $643 could trigger a test of $646, while a confirmed drop below $635 could bring $632 and $627 into play, especially if sentiment weakens following the Fed’s update.
Expected Price Action
Our AI model projects SPY to trade between $630 and $640 on Wednesday, a wider range that signals actionable intelligence pointing to a high-volatility session. Market direction will be heavily influenced by the Fed and ADP data. The model remains bullish above $635, with resistance at $640 and $643. A breakout above $643 could lead to $645 or even $647, though profit-taking is expected. Conversely, a break below $635 puts $632 and $630 in play. If $630 fails, look for a slide toward $627 or $625. Given the potential for rapid swings, traders should be flexible and prepare for trending price action throughout the session.
Trading Strategy
SPY continues to favor long trades near support at $635 and $632, with upside targets at $640, $643, and $645. If SPY clears $643 with strength, a run to $647 is possible, but traders should tighten stops as the market approaches dense resistance. Short trades may be viable on failed breakouts above $640 or breakdowns below $632. Downside targets include $630, $627, and $625, with deeper targets at $622 if volatility picks up. The VIX rose sharply to 15.69, reflecting building market tension ahead of Wednesday’s events. Given the elevated risk, smaller position sizes and tight risk controls are warranted around key levels.
Model’s Projected Range
The model projects SPY’s maximum range for Wednesday between $629.75 and $641.50 with the Put side dominating within a wide and expanding band suggesting trending price action on Wednesday due to FOMC. Overnight, the market gapped higher and opened at the key resistance level of $638. However, shortly after the open, SPY began to decline on news that Washington and Beijing were still engaged in trade talks, with no indication that China would be granted an extension to finalize a deal. The market sold off steadily throughout the day, ultimately finding major support at the critical $635 level. This support held through multiple tests, but each retest drained liquidity which increased the likelihood that future tests would see the level break. And that is precisely what happened late in the day as $635 failed but quickly recovered. Into the close, SPY managed a modest rally off the day’s lows, finishing just above $635 and setting the stage for an eventful Wednesday. Despite the intraday weakness, SPY still notched another all-time high, reinforcing bullish control. Dips to key support levels continue to be bought, and overall momentum remains strong as investors largely shrug off macroeconomic risks. That said, the landscape could shift quickly with Wednesday’s FOMC decision and a packed slate of economic data and earnings later in the week. While the rally is likely to continue in the absence of negative surprises, a healthy 5 to 10 percent pullback remains a reasonable expectation. Since reclaiming the $585 level, SPY has maintained a robust uptrend, and the close above $635 further confirms bullish momentum. This opens the door for a test of the $640 to $645 resistance zone, an area where meaningful selling and profit-taking are expected. Tariff-related headlines remain a key risk, but as that uncertainty fades, investor focus is likely to return to economic data, earnings, and valuations. Heading into Wednesday, notable resistance levels are at $637, $640, $643, and $646, with support at $635, $630, $627, and $625. Overnight action will likely hinge on whether bulls can defend the day’s lows. Given today’s pressure, we would not recommend initiating buys at this level unless SPY fails and quickly reclaims it. A confirmed break below $635 could trigger a move toward $632, where a successful hold would preserve the ultra-bullish setup. Should $632 fail, look for support at $630, $627, and $625. A breakdown below $625 would turn our model bearish, with a move under $600 significantly increasing the probability of a retest of the $585 level. Looking beyond the FOMC, the August to October window often brings seasonal volatility, which could give bears an opening. SPY remains just above the lower boundary of a redrawn bullish channel from the April lows, underscoring the strength of the trend. The $640 to $647 zone remains a dense resistance band likely to cap near-term upside, while the $635 to $630 range continues to offer solid support, suggesting more sideways action in the lead-up to the Fed’s decision. Markets remain highly sensitive to macroeconomic data, bond yields, inflation trends, tariff developments, and fiscal policy shifts. Meanwhile, the VIX rose 4.39% to 15.69. While the overall tone remains risk-on, the VIX term structure is showing its steepest contango in years is an early warning that volatility could increase significantly in the coming months. We continue to recommend maintaining hedges on long positions at these levels, particularly through 90-day out-of-the-money VIX calls, as we expect heightened volatility heading into year-end.
Market State Indicator (MSI) Forecast
Current Market State Overview:
The MSI is currently in a Bearish Trending Market State, with SPY closing below support turned resistance. Extended targets printed briefly during the afternoon session as price found the lows of the day. Into the close there were no extended targets printing and the MSI bearish range was narrow implying more sideways price action heading into Wednesday. Overnight the MSI rescaled higher to a narrow bullish state with extended targets above. This remained until the open, indicating a weak bull trend at major resistance, given extended targets stopped printing well before the open. As price fell the MSI rescaled to a ranging state then to the current narrow bearish state. A late day drop below $635 with extended targets saw this major level fail and recover after several tests which implies lower prices on Wednesday. MSI resistance is currently $635.90 and higher at $636.58.
Key Levels and Market Movements:
On Monday, we wrote that “We expect the recent pattern of grinding higher within a tightening range to continue, with $640 acting as a likely magnet above and $635 serving as key support below,” and added, “our forecast calls for sideways-to-up price action with limited volatility unless disrupted by an external macro event.” We further noted, “if $635 breaks and fails to recover quickly, a decline to $632 is likely.” With this plan in place and SPY opening above $638, mid-MSI range, we didn’t see enough upside to justify initiating longs at that level, so we waited for a setup. A test of MSI resistance at $638.61 failed quickly, reinforcing our caution. On a second test of MSI resistance, we initiated a short at $638.50 with an initial target at the premarket support level of $636.50. MSI support was less than $1 below our entry, and per our rules, we don’t take a first target on SPY if the range is under $1, so we held for a premarket level. SPY chopped around MSI support at $638, and we expected the trade to fail, particularly given its countertrend nature. To manage risk, we moved our stop to breakeven. Fortunately, negative news hit the wire and SPY dropped to $637.20, closing the overnight gap. We considered exiting there due to the imperfect nature of the breakdown, but with $637 not being a meaningful level for us, we left the stop at breakeven and continued to hold. SPY bounced back into the MSI and retested resistance. Just after 11 a.m. however, our first target was hit so we set our second at MSI support at $635.90, which triggered quickly as MSI flipped to a bearish state with extended downside targets. We held our remaining 10% trailer and when SPY reached $635 and printed a textbook failed breakdown, we decided to exit our final 10% without reversing long, as extended targets continued to appear below. Price briefly popped back into the MSI and retested $635 again, but the presence of extended downside targets and our already successful trade kept us on the sidelines. After 1 p.m., SPY returned to MSI resistance at $636.60 and appeared poised to reverse higher. After three failed attempts to break this level, we were tempted to reenter short but chose to follow our rule of protecting profits on a green day. While the setup played out and would have been a strong trade, we were content with our earlier win. In our book, green is a victory, and we decided to call it a day, one and done, keeping our powder dry for what is likely to be an exciting Wednesday. Our success came from having a clear plan, executing it with discipline, and trusting MSI’s directional cues, all in alignment with our broader market model and key levels, resulting in a solid outcome. The MSI remains a cornerstone of our consistent trading process.
Trading Strategy Based on MSI:
Wednesday brings both the ADP employment report and the FOMC decision. With Friday’s jobs report looming, we don’t expect ADP to significantly move the market. Instead, we anticipate price action to hover around the $635 level heading into the FOMC announcement, with a grind and tight range likely leading up to the statement. A retest of Tuesday’s lows may occur, but we expect that level to hold in the absence of an external catalyst. That said, with FOMC in play, anything can happen. And given the projected wide range, traders should expect heightened volatility. A common pattern around FOMC releases is an initial move that acts as a trap, followed by a reversal in the opposite direction. While this setup doesn’t play out every time, it occurs often enough to warrant attention. Traders should watch for failed patterns that fade the first move, as these often offer the highest probability setups. Barring an external shock which remains a distinct possibility given this week’s calendar, we expect the recent pattern of grinding higher within a tight range to persist, with $640 acting as a magnet above and $635 continuing to serve as key support below. As new information enters the market, traders should be prepared to adjust expectations and levels accordingly. While some market participants are calling for a 10% or greater decline, our model does not currently support that view. Although our model has provided us early warning signs over the past week, no actionable bearish signals have emerged. As always, we encourage readers to trade the market in front of them and respond to new developments as they arise. Heading into Wednesday, our overnight forecast calls for sideways-to-down price action with limited volatility, unless disrupted by macro news. The bulls will look to defend the $635 level; if it holds, a push toward $640 becomes more likely. If $635 fails and does not recover quickly, a move to $632 is likely, and a break below that level could open the door to a deeper pullback toward $625. A meaningful decline remains a low-probability outcome unless $625 breaks. As of now, we continue to favor dip buying at key support levels and failed breakdowns, as the broader trend remains in bullish control. With the MSI currently in a Bearish Trending Market State, we expect lower prices in the short term, including a likely retest of Tuesday’s lows. We continue to favor long setups above $632 while remaining open to tactical shorts near $638 or on failed breakouts and breakdowns below $632, especially if the MSI begins to show further weakness. As always, failed moves remain among the highest-probability setups. Stay nimble, avoid trades during Ranging Market States, and ensure full alignment with MSI. Providing real-time insights into market control, momentum shifts, and actionable levels, the MSI when integrated with our Pre-Market and Post-Market Reports continues to sharpen execution precision and elevate trade quality. If you haven’t yet integrated MSI and our model levels into your process, now is the time. Contact your representative to get started as these tools are designed to support consistency and enhance performance.
Dealer Positioning Analysis
Summary of Current Dealer Positioning:
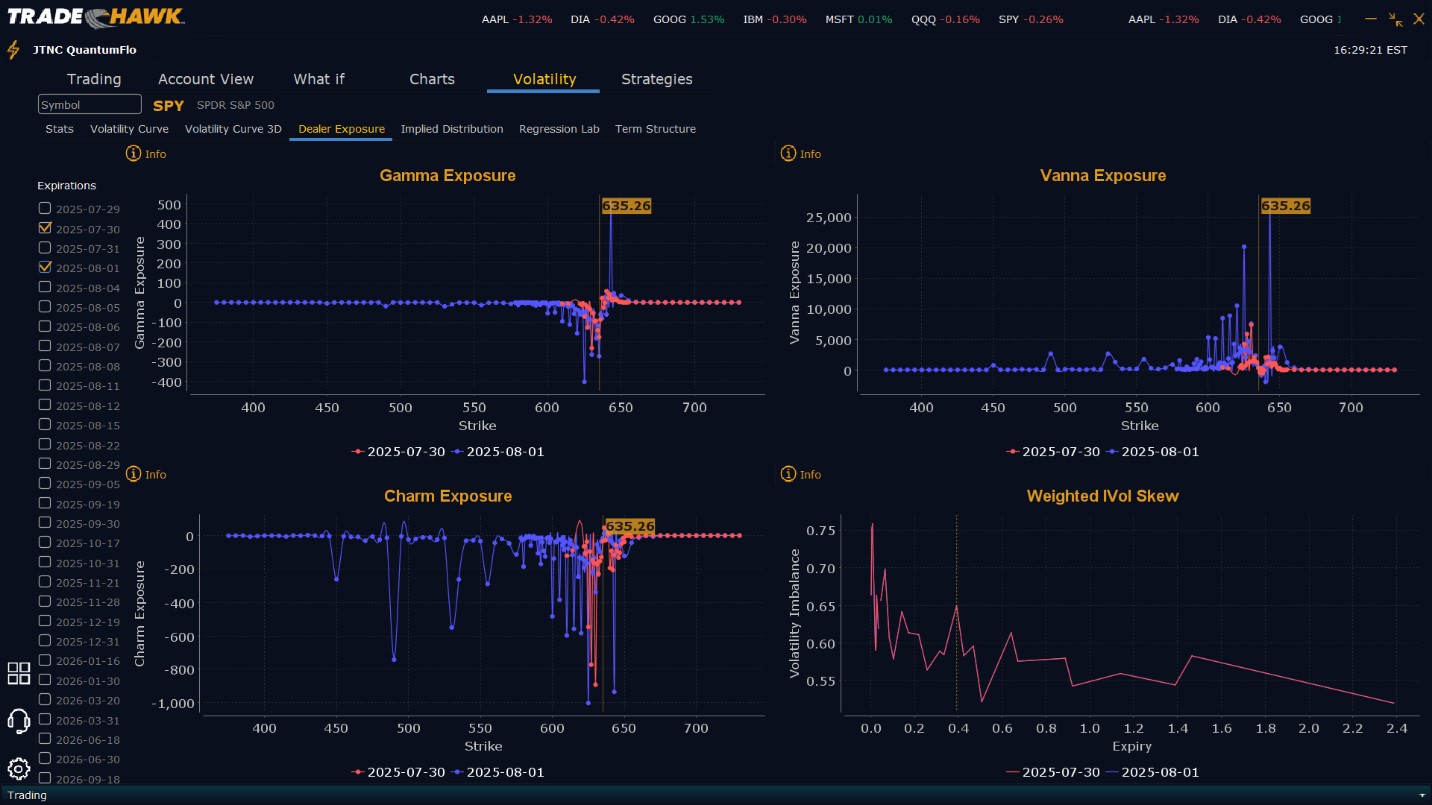
Dealers are selling SPY $637 to $650 and higher strike Calls while also buying $636 Calls indicating the Dealers desire to participate in any rally on Wednesday above $636. The ceiling for Wednesday appears to be $640. To the downside, Dealers are buying $635 to $600 and lower strike Puts in a 3:1 ratio to the Calls they’re selling/buying implying little concern that prices will move lower on Wednesday. Dealer positioning is unchanged from slightly bearish/neutral to slightly bearish/neutral.
Looking Ahead to Friday:
Dealers are selling SPY $639 to $660 and higher strike Calls while also buying $636 to $638 as well as $640 Calls in small size indicating the Dealers desire to participate in any rally later this week. The ceiling for the week appears to be $643. To the downside, Dealers are buying $635 to $555 and lower strike Puts in a 5:1 ratio to the Calls they’re selling/buying, reflecting a bearish outlook for the week. Dealers have maintained their net bearishness for the week with the ratio displaying Dealers holding significant protection. For the week Dealer positioning is unchanged from bearish to bearish. We advise reviewing Dealer positioning daily for directional clues. These positions evolve quickly and tracking them is essential for staying ahead of shifting market sentiment.
Recommendation for Traders
SPY remains within its strong bullish trend, but caution is warranted as markets brace for the Fed. Traders should focus on long setups near $635 and $632 with profit targets at $638, $640, and potentially $645 if momentum continues. Short trades could be considered if SPY fails to hold $632 or breaks below $625, with downside targets at $622 and $620, or above $638 on failed breakouts. With the VIX at 15.69, volatility is ticking higher, and risk management becomes essential. Use tighter stop-losses near resistance and be ready to scale back position size in uncertain conditions. Be sure to review the premarket analysis posted before 9 AM ET to account for any changes in the model’s outlook and in Dealer Positioning.
Good luck and good trading!
