Market Insights: Monday, July 28th, 2025
Market Overview
Stocks were little changed Monday, though the S&P 500 and Nasdaq managed to edge out fresh record closes, kicking off what’s shaping up to be one of the busiest weeks of the summer. Markets opened higher following upbeat weekend news, including a U.S.-European Union tariff agreement that calmed trade tensions and lifted early sentiment. The agreement set a baseline tariff rate of 15% on European goods, down from the 30% previously floated. President Trump hailed it as “the biggest of them all,” although EU officials were more muted in their response.
The S&P 500 closed fractionally higher, notching a sixth straight record close, while the Nasdaq added about 0.3%, extending its winning streak. The Dow, however, slipped 0.2% as some rotation out of industrials and financials weighed on the index. Meanwhile, market watchers are now eyeing a full slate of events including the Federal Reserve’s two-day meeting starting Tuesday, Wednesday’s interest rate decision, and a deluge of earnings reports from Big Tech heavyweights like Meta, Microsoft, Apple, and Amazon. There’s also renewed speculation that U.S.-China trade talks in Stockholm may extend the current tariff truce by another three months past the August 12 deadline. With inflation data and July’s jobs report also on deck, markets are bracing for a potentially volatile week. Investors are particularly focused on any Fed language that hints at a pivot toward a rate cut in September, especially as pressure from the White House mounts on Chair Jerome Powell.
SPY Performance
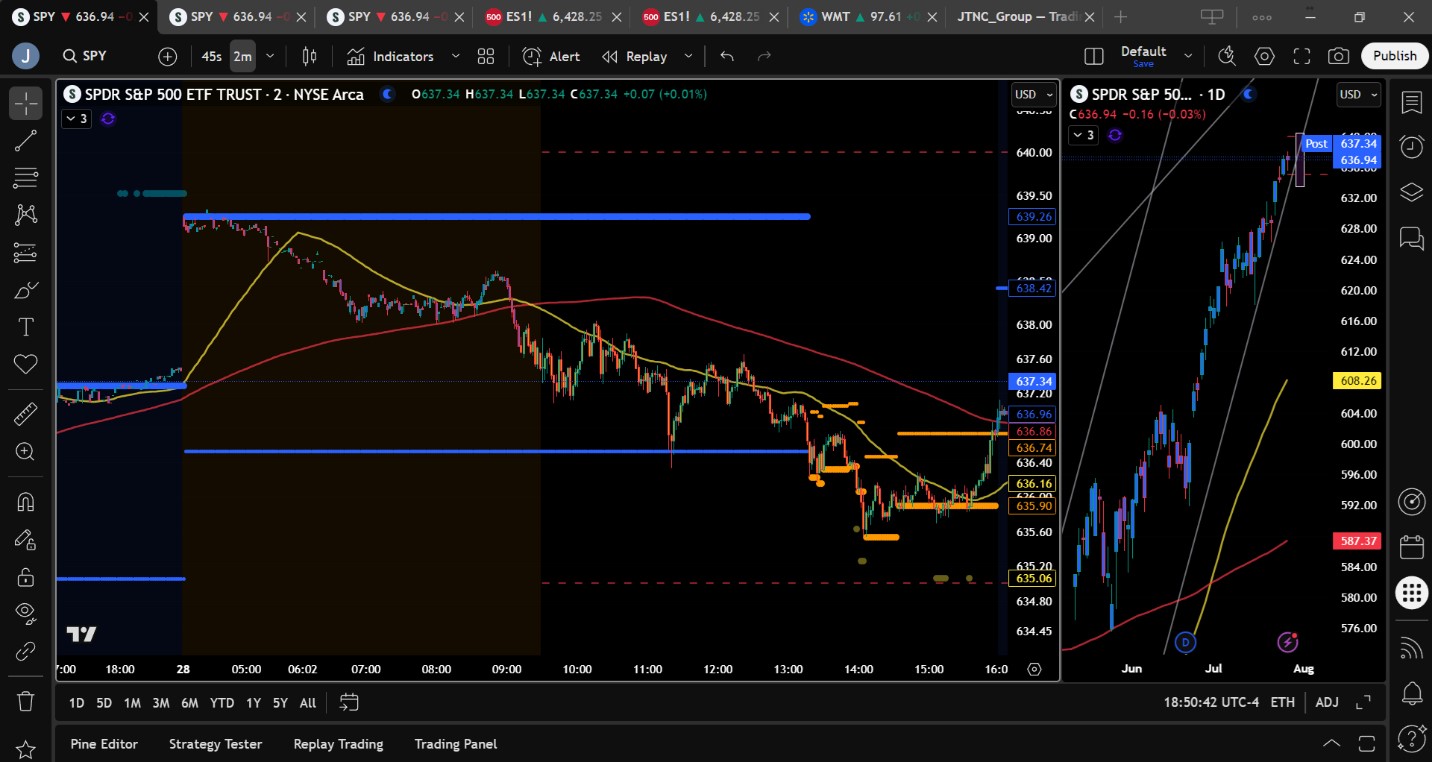
SPY closed Monday nearly flat, down just 0.02% at $636.95 after reaching an intraday high of $638.04 and a low of $635.54. The ETF opened at $637.48 and spent much of the day drifting sideways following an early pullback from overnight highs. Volume was subdued at 50.68 million shares, slightly below average, as traders adopted a wait-and-see approach ahead of key macro events. The muted performance capped a session that started with optimism but faded into consolidation as the market digested the EU trade news and braced for the week’s heavy data flow.
Major Indices Performance
The Nasdaq led the major indices on Monday, gaining 0.33% as tech stocks continued their upward push. The Russell 2000 fell 0.07%, followed by the Dow, which lost 0.14%. The S&P 500 ended nearly unchanged but managed to post its sixth straight record close. While the trade pact between the U.S. and EU provided early support, momentum faded throughout the day, with investor focus turning toward the Fed’s upcoming rate decision and a flurry of economic reports. Sectors were mixed, with strength in technology offset by weakness in defensives and industrials.
Notable Stock Movements
Tesla once again stood out among the Magnificent Seven, climbing over 3% and extending its lead as the group's top performer. Apple, Amazon, and Meta also posted gains, continuing the trend of investor optimism ahead of this week's earnings. Microsoft, Alphabet, and Netflix lagged slightly, closing modestly lower. The mixed action suggests that while growth names continue to attract buyers, positioning is becoming more selective as traders brace for potentially market-moving results from key tech giants in the days ahead.
Commodity and Cryptocurrency Updates
Crude oil rebounded sharply, jumping 2.96% to $66.96, bucking its recent downtrend. While our model still expects oil to move toward $60 this year, Monday’s move reflects some short-term supply concerns and possibly speculative positioning ahead of key inventory data. Gold slipped 0.68% to close at $3,313, reflecting ongoing rotation out of safe havens and into equities. Bitcoin fell 1.21% but held above $118,000, continuing its choppy consolidation phase. Crypto remains range-bound, with diminishing speculative enthusiasm compared to earlier in the year.
Treasury Yield Information
The 10-year Treasury yield edged up 0.32% to close at 4.411%, hovering just under the critical 4.5% level. While yields remain elevated, Monday’s modest rise did little to rattle equity markets. Still, traders remain on alert, as any move above 4.8% would likely spark a more pronounced equity selloff. A push past 5% or higher could trigger a full-blown correction. For now, equity markets appear comfortable with current yield levels, especially ahead of the Fed’s policy update.
Previous Day’s Forecast Analysis
Friday’s forecast projected SPY to trade between $633.25 and $641.75 with a bullish bias above $634. The model outlined upside targets at $639, $640, and $641, and support zones at $634, $632, and $628. The strategy emphasized buying dips near major support levels while cautioning that resistance above $641 could prompt profit-taking. A breakdown below $634 was expected to bring a test of $632 or lower, while maintaining long setups remained the primary strategy with bulls in control.
Market Performance vs. Forecast
SPY’s actual trading session on Monday aligned well with Friday’s forecast. The ETF opened at $637.48, dipped to a session low of $635.54, and finished at $636.95, comfortably within the projected range of $633.25 to $641.75. The key $634 support level held once again, validating the model’s bullish tilt. While SPY did not test upper targets at $639 or $641, the minor dip and consolidation near mid-range levels were consistent with expectations. Traders who focused on buying dips near $634 likely found favorable opportunities, as downside momentum failed to build and the market stayed steady despite early volatility.
Premarket Analysis Summary
In Monday’s premarket analysis posted at 7:10 AM, SPY was trading at $638.35 with a bullish bias above the 638 level. The model favored long trades on dips near support levels, with upside targets set at $640 and a projected max high near $643. If SPY lost 638 support, the model anticipated a choppy decline with potential bounces around 635, and stronger support at 633 and 630. The analysis warned that the upward range was fragile and stressed locking in profits near resistance while being cautious of mid-range consolidation.
Validation of the Analysis
Monday’s session validated the premarket analysis with a textbook move. SPY briefly tested just above the $638 bias level before pulling back toward the $635 support zone, ultimately closing at $636.95. The projected resistance at $640 remained out of reach, but the analysis correctly forecasted limited upside and highlighted the possibility of early gains fading into consolidation. Support near $635 held, and downside action stalled as expected. Traders who followed the roadmap found value in long setups around support, particularly with the session unfolding within the premarket’s anticipated choppy structure.
Looking Ahead
Tuesday brings the JOLTS Job Openings report, kicking off a week loaded with market-moving data. Traders will be focused on whether job openings decline significantly, which could increase expectations for a September rate cut. Attention then turns to Wednesday’s Fed decision, along with ADP employment data. With volatility likely to increase midweek, traders should remain alert to shifting sentiment and ready to react to both economic releases and central bank commentary.
Market Sentiment and Key Levels
SPY enters Tuesday trading around $636.95, hovering just below resistance levels at $640, $642, and $643. Sentiment remains cautiously bullish, supported by strong underlying trends and consistent dip buying. Major support now lies at $635, followed by $630 and $629. Bulls maintain control as long as SPY holds above $632. A break above $643 could lead to a test of $645, where significant resistance and profit-taking are likely. On the downside, a loss of $632 would invite tests of $629 and $625, which could shift the tone bearish if broken.
Expected Price Action
Our AI model projects SPY to trade between $634 and $640 on Tuesday, a narrow, actionable intelligence range that signals a continuation of the choppy and sideways price action seen Monday. The market retains a bullish bias above $635, with upside targets at $640 and $643. A breakout through $643 opens the door to $645, but the model expects resistance in that zone. If SPY falls below $635, look for a retest of $632 or lower. A failure to hold $632 would turn sentiment negative and set up a move toward $629 or $625. With macro catalysts looming, traders should remain agile and respond quickly to directional shifts.
Trading Strategy
SPY remains favorable for long trades on dips to $635 and $632, with upside targets at $640 and $643. A break above $643 opens the path to $645, though gains should be protected with tighter stops as we approach resistance. Short trades have lower odds of success but may become viable on failed breakouts above $640 or confirmed breakdowns below $632. Downside targets include $629 and $625. The VIX rose slightly to 15.03, signaling that while overall volatility remains low, traders should prepare for wider ranges midweek. With FOMC risk ahead, trade sizes should remain conservative near key resistance.
Model’s Projected Range
The model projects SPY’s maximum range for Tuesday between $633.50 and $640.50 with the Call side dominating within a narrow band suggesting choppy price action punctuated by occasional trending moves. Overnight, the market moved higher on favorable EU tariff news. However, by the open, much of the euphoria had faded, and SPY surrendered most of its overnight gains, trading mostly sideways to lower throughout the session and closing virtually flat. This price action is typical of an FOMC week, especially with a full slate of economic data on tap. Despite the muted session, SPY closed above $635, notching another all-time high and reinforcing the bulls’ control. Dips to key support levels continue to be bought, and momentum remains firmly intact as investors largely dismiss macro risks. While the recent streak of daily highs appears stretched, historical patterns continue to favor a continuation of the uptrend. A consolidation phase will eventually be necessary to digest gains, but without a clear catalyst for a slowdown, the rally is likely to persist, particularly as markets often generate positive returns for at least six months following rebounds of this magnitude. A healthy 5 to 10 percent pullback remains a reasonable expectation to alleviate excess froth. Markets rarely crash immediately after strong rallies; more often, they shift into slower advances and increased choppiness as volatility declines. Since reclaiming the $585 level, SPY has maintained a strong uptrend. The close above $635 confirms bullish momentum and sets the stage for a test of the $640 to $645 resistance zone, where meaningful selling and profit-taking are likely. Tariff-related headlines remain a key risk, but as those uncertainties subside, attention will likely refocus on economic data, earnings, and valuations. Heading into Tuesday, key resistance levels are $640, $642, and $643, with support at $635, $630, and $629. Overnight action will likely center around the bulls defending $635. A pullback to this area could present another buying opportunity, while a break below could trigger a move toward $632. A successful hold at $632 would preserve the ultra-bullish setup, keeping targets above $640 in play. If $632 fails, support levels at $629 and $625 come into focus; a break below $625 would turn our model bearish. A move below $600 would significantly increase the probability of retesting the $585 level. Post-FOMC and into the August to October window, seasonal volatility could reemerge, offering bears a potential opening. SPY remains above the lower boundary of a redrawn bullish channel from the April lows, confirming the strength of the trend. The $640 to $643 zone remains a dense resistance band, likely capping near-term upside, while the $633 to $629 area provides equally strong support, suggesting more sideways action on Tuesday. Markets remain highly sensitive to macroeconomic data, bond yields, inflation, tariff developments, and shifts in fiscal policy. Meanwhile, the VIX rose 0.67% to 15.03, maintaining a risk-on tone and implying more range-bound trading and reduced directional conviction in the coming weeks. We continue to recommend maintaining hedges on long positions at these levels, particularly through 90-day out-of-the-money VIX calls, as we expect volatility to increase later this quarter.
Market State Indicator (MSI) Forecast
Current Market State Overview:
The MSI is currently in a Ranging Market State, with SPY closing at the bottom of the range. Extended targets printed briefly in the afternoon session as price found the lows of the day near major support at $635. But these extended targets were sporadic and the narrow, bearish MSI foretold that it was unlikely the market would fall much below the $635 major support level. Spending much of the day in a wide Bullish Trending Market State, SPY traded within the MSI range until it gave way after 1 pm and began a series of rescalings lower to narrow, bearish MSIs. At 2 pm extended targets had ceased printing and the dip was bought, moving the MSI to a ranging state. This implies more of the same overnight with SPY likely rangebound, perhaps attempting to test $638.50 to the upside and $635.50 to the downside. MSI support is currently $636.85 with resistance at $638.42.
Key Levels and Market Movements:
On Friday, we wrote that “the sideways-to-up bias remains intact,” and added, “Overnight, we expect SPY to churn within a range, with bulls aiming to defend the $634 level. If that support holds, it could pave the way for a move toward $640,” reinforcing our continued preference for dip buying at major support levels and on failed breakdowns. With this plan in place and SPY opening above $637, around mid MSI range, we looked for long setups targeting a possible retest of the overnight highs. At 11:20 a.m., SPY dropped and printed a textbook failed breakdown at MSI support, prompting a long entry at $636.70. Given the wide MSI range, we turned to the premarket report for our first target. The first premarket level was $640, above MSI resistance, so there wasn’t a viable initial target within striking distance. As SPY returned to mid MSI and formed a double top around noon, we scalped our first target, exiting 70% of our position for just under $1 profit. The lack of broad market participation and absence of extended targets above with a wide MSI trading midrange gave us clues to take what we could for the trade. We moved our stop to breakeven on the remaining 30%, even though we typically wait until after T2 to do so. Price dropped, tagging our stop, but we viewed it as a fortunate outcome and shifted our mindset to profit protection mode, waiting for the MSI to provide a cleaner setup. The MSI rescaled to a bearish state, but the range was narrow and choppy, with frequent up-and-down moves indicating a weak decline. With some profits secured, we avoided short entries in the middle of the MSI range. As price dropped again, the MSI briefly printed extended downside targets, but just after 2 p.m., another textbook failed breakdown just above major support at $635 triggered us to enter a second long entry at $635.75, with a first target at $636.75. The MSI rescaled higher but stayed in a bearish state and printed extended targets below. We quickly moved our stop to breakeven again, aligned with our profit protection rule of not risking gains already booked. This time, we narrowly avoided getting stopped out, and a late-day SPY pop allowed us to exit just below $637, securing a single target on the long off the second failed breakdown. It was a difficult session to navigate, as expected during FOMC week, but having a clear plan, executing it with discipline, and trusting the MSI’s directional cues in line with our broader market model and key levels allowed us to come away with a solid outcome. The MSI remains a cornerstone of our consistent trading process.
Trading Strategy Based on MSI:
Tuesday brings the JOLTS Job Openings report, which is unlikely to meaningfully move the market. We expect the recent pattern of grinding higher within a tightening range to continue, with $640 acting as a likely magnet above and $635 serving as key support below. Price action is expected to remain range-bound until after the FOMC decision and the flurry of economic data and earnings due later this week. While some market commentators are predicting a 10% or larger decline in the near term, our model currently does not support that scenario. As always, we remind readers to trade what’s in front of them when new information enters the market. For Tuesday, our forecast calls for sideways-to-up price action with limited volatility unless disrupted by an external macro event. Emotion and FOMO continue to influence movement, and with the projected range narrowing, the sideways-to-up bias remains intact. Overnight, we expect SPY to churn within a defined range, with bulls aiming to defend the $635 level; if that support holds, a move toward $640 becomes more likely. Conversely, if $635 breaks and fails to recover quickly, a decline to $632 is likely, and a sustained drop below that level could open the door to a deeper pullback toward $625. That said, a meaningful pullback remains a low-probability scenario for now, and we continue to favor dip buying at major support levels and failed breakdowns, as bulls retain control of the broader trend. While tariff-related headlines from the White House remain a wildcard, the market’s resilience in the face of such risks reinforces the bullish outlook. With the MSI currently in a Ranging Market State, we expect slightly higher prices on Tuesday and favor long setups above $635, while remaining open to short opportunities near $640 or on failed breakouts and breakdowns below $632, particularly if the MSI starts to show weakness. As always, failed moves remain among the highest-probability setups. Stay nimble, avoid trades during Ranging Market States, and ensure full alignment with MSI. Providing real-time insights into market control, momentum shifts, and actionable levels, the MSI when integrated with our Pre-Market and Post-Market Reports continues to sharpen execution precision and elevate trade quality. If you haven’t yet integrated MSI and our model levels into your process, now is the time. Contact your representative to get started as these tools are designed to support consistency and enhance performance.
Dealer Positioning Analysis
Summary of Current Dealer Positioning:
Dealers are selling SPY $639 to $646 and higher strike Calls while also buying $637 and $638 Calls indicating the Dealers desire to participate in any rally on Tuesday. Dealers were convinced price would stall today and were positioned properly. The ceiling for Tuesday appears to be $640. To the downside, Dealers are buying $636 to $600 and lower strike Puts in a 3:1 ratio to the Calls they’re selling/buying implying little concern that prices will move lower on Tuesday. Dealer positioning is unchanged from slightly bearish/neutral to slightly bearish/neutral.
Looking Ahead to Friday:
Dealers are selling SPY $639 to $660 and higher strike Calls while also buying $637 to $640 Calls in small size indicating the Dealers desire to participate in any rally later this week. Dealers are no longer selling near to the money Puts. The ceiling for the week appears to be $645. To the downside, Dealers are buying $636 to $555 and lower strike Puts in a 5:1 ratio to the Calls they’re selling/buying, reflecting a bearish outlook for the week. Dealers have actually reduced their net bearishness for the week but the ratio still shows Dealers holding lots of protection. For the week Dealer positioning is unchanged from bearish to bearish but less so. We advise reviewing Dealer positioning daily for directional clues. These positions evolve quickly and tracking them is essential for staying ahead of shifting market sentiment.
Recommendation for Traders
With SPY continuing to trade in a strong uptrend and holding firmly above $635, traders should remain focused on long setups near support at $635 and $632, targeting upside levels at $640, $642, and $643. If SPY breaks out above $643, expect follow-through momentum toward $645, though caution is advised due to likely resistance. Short trades should only be considered if SPY fails to hold $632 or breaks below $625, with downside targets at $622 and $620 or above $640 on a failed breakout. The VIX ticked up slightly to 15.03, hinting at a possible pickup in volatility ahead of the FOMC meeting. Keep position sizes conservative, protect profits into strength, and maintain tight stop-losses near key levels. Be sure to review the premarket analysis posted before 9 AM ET to account for any changes in the model’s outlook and in Dealer Positioning.
Good luck and good trading!
