
Market Insights: Monday, July 27th, 2026
Market Overview
US stocks kicked off the busiest week of the quarter on a mixed note Monday, with the Dow gaining nearly 0.5% while the S&P 500 barely moved and the Nasdaq slipped close to 0.2%. Chip stocks were the main drag, with Nvidia tumbling more than 4% on circular financing concerns and ASML dropping over 5% after The Information reported a Chinese state-backed company began mass-producing a key piece of chipmaking equipment. That tech weakness was partially offset by a massive drop in oil prices, with Brent crude futures falling over 9% to trade below $88 a barrel after the US and Iran announced a pause in fighting, raising hopes that peace negotiations could get back on track.
The oil selloff is actually good news for the Fed, which delivers its rate decision Wednesday. Policymakers are expected to hold rates steady, though a hike isn't completely off the table in what's shaping up to be one of the least-telegraphed Fed decisions in years. Beyond the Fed, all eyes are on a flood of Big Tech earnings — Microsoft, Meta, Apple, and Amazon are all reporting this week. Investors will be laser-focused on capital expenditure guidance and AI monetization after last week's blowout capex numbers from Alphabet and Tesla triggered a meltdown across the tech sector.
SPY Performance
SPY opened at $744.91 and looked like it wanted to make a run early, with the high of the day coming in at $745.53 before sellers showed up and took control. From there, the tape slid steadily lower, eventually touching a session low of $735.87 — a drop of nearly ten points from the peak that tells you the bears had real conviction once they pushed back. That kind of intraday reversal after an optimistic open is never a great look for the bulls, and it kept the broader market on edge throughout the session.
SPY closed at $739.12, up just 0.13%, which technically counts as a green day but barely deserves the label given how the session unfolded. Volume came in at 38.16 million shares, below average, so the selling pressure didn't come with a flood of participation — but a quiet tape cutting lower isn't exactly comforting either. The VIX rose 0.70% to close at 18.83, nudging fear levels slightly higher and signaling that the market hasn't found its footing yet. Two consecutive sessions of essentially flat closes after the prior week's volatility sounds like stabilization on the surface, but the intraday action tells a messier story. The bulls keep opening the door and then watching it get slammed shut — until they can hold early strength and build on it rather than surrender it, the path of least resistance still feels more sideways to lower than anything else.
Major Indices Performance
The Dow was the clear winner on the day, surging 0.96% in a session that saw blue-chip names attract real buying interest. The move suggests investors were once again gravitating toward the more established, value-oriented side of the market, leaning on names with proven cash flows and less exposure to the growth premium that's been getting squeezed. It's a continuation of the rotation theme that's been quietly building, and the Dow's near-1% gain in an otherwise mixed tape is hard to ignore.
The S&P 500 barely held its ground with a 0.13% gain, which tells you the broader market didn't have much conviction behind it. The gap between the Dow's strong advance and the S&P 500's near-flatline finish is the real story — it points to significant divergence under the hood, where the index-level number is masking a genuine tug-of-war between growth and value that tilted decisively toward value today.
The Russell 2000 managed a modest 0.32% gain, which looks decent on the surface but still lagged the Dow by a wide margin. Small-caps have been fighting an uphill battle all year with rates where they are, so even a small positive close counts as a relative win for that group. The Nasdaq was the drag on the whole session, falling 0.82% as growth and tech names faced meaningful pressure. The spread between the Dow's nearly 1% gain and the Nasdaq's loss approaching 1% is almost a two-point gap — a clean, unmistakable signal that the market is rewarding stability and punishing growth right now. Value over growth remains the dominant playbook.
Notable Stock Movements
NVIDIA took center stage in the Magnificent Seven today, and not in a good way. A -5.87% drop is the kind of move that stops traders in their tracks — that's not noise, that's conviction selling in one of the most widely watched names in the entire market. When NVIDIA moves that aggressively to the downside, it sends a ripple across the growth and semiconductor space that's hard to ignore, and today it served as the single biggest weight dragging on the Nasdaq's -0.82% decline.
The rest of the Magnificent Seven was mostly red as well, though Apple, Alphabet, and Microsoft once again managed to find some green on the day. That's the same trio that held up during the prior session's weakness, which suggests the software and services side of the group continues to carry relative strength while the hardware and chip-adjacent names take the heat. Still, with more names finishing in the red than the green, the cohort as a whole remained a net drag rather than a source of support for the broader market.
The group's mostly negative showing fits the split personality of today's session — the Dow pushed nearly 1% higher while the Nasdaq struggled, and that divergence reflects exactly what's happening inside the Magnificent Seven. When NVIDIA is getting hit that hard and the rest of the growth-heavy names can't rally as a unit, the high-beta corner of the market is doing more harm than good to sentiment. How NVIDIA responds in the next session will be closely watched, because a name that size moving nearly 6% in a single day tends to leave a mark on both the charts and trader psychology.
Commodity and Cryptocurrency Updates
Crude oil got hit hard today, dropping 8.27% to close at $81.92 — a significant single-session selloff, but one that still leaves crude well above $70 and well above any level that would suggest the broader rally has reversed. A one-day flush of that magnitude will naturally grab headlines, but context matters here. Oil at $81.92 is still deeply embedded in territory that keeps inflationary pressure elevated, and the fundamental drivers that pushed crude this high haven't evaporated overnight. Geopolitical tensions and supply dynamics don't resolve themselves in a single session. The Fed is watching every tick, and crude holding above $70 — even after a day like this — continues to complicate the rate path more than policymakers would like.
Gold tacked on another 0.52% today, closing at $4,089, building on yesterday's stabilization with a bit more conviction. The metal is now sitting comfortably above $4,000 and trending in the right direction after last week's brief wobble. Central bank demand, geopolitical uncertainty, and a global rate environment that remains anything but clear-cut continue to underpin the bid. The path of least resistance still looks higher.
Bitcoin dipped 0.62% today, closing just above $64,934, which is actually a relatively contained move after a stretch of choppiness. Back-to-back losses have slowed, and while crypto isn't showing any explosive upside momentum right now, the structure hasn't cracked either. Buyers need to start asserting themselves more convincingly to shift the narrative back in a bullish direction.
Treasury Yield Information
The 10-year Treasury yield extended its pullback today, sliding another 1.32% to close at 4.640%. That's two consecutive sessions of relief after what had been a grinding, relentless climb, and while the move is welcome, it's important not to over-read it. Two days of backing off doesn't erase the broader trend, and at 4.640%, we're still well inside the pressure zone where valuations face a structural headwind.
Inside the framework, the setup looks modestly better than it did a few sessions ago but is far from clean. Sitting 16 basis points below the critical 4.8% threshold gives equity bulls a bit more room to work with compared to where we were earlier this week. That buffer matters — 4.8% is the line where the tone shifts from slow, grinding pressure to the kind of broad-based selling that accelerates quickly. We haven't crossed it, and today's move nudges us a little further away from it, which is a net positive in the short run. But the 4.5% level remains the floor that separates "manageable headwind" from genuine relief, and we're still 14 basis points above it with no convincing sign yet that bond buyers have real conviction here.
What to watch going forward is whether this two-day pullback has any legs. If yields stabilize and drift lower with follow-through, the equity backdrop improves meaningfully. If this stalls and yields start curling back toward 4.8%, that threatened selloff scenario comes right back into play fast. A decisive close back below 4.5% would be the real game-changer for stocks — but we're not there yet. Stay patient and stay alert.
Previous Day’s Forecast Analysis
Yesterday's forecast projected SPY trading within a sixteen-point range, with $732 marking the downside floor and $748 serving as the max upside ceiling. The bias heading into Monday's session was bearish, with Friday's close at $738.93 sitting in the lower half of the expected move and sellers holding the structural edge coming out of the prior week. The model identified $742 as the critical gamma flip point — the level bulls needed to reclaim and hold with conviction before any meaningful recovery attempt could gain traction.
On the downside, $739 was flagged as the first critical line to defend, with a loss of that level expected to confirm seller control and open the door to $738, where selling could accelerate through the negative gamma pocket. Below there, $736 was the next decision point and $735 was identified as the point of last hope, carrying a substantial put wall and deep negative gamma. Failure at $735 put $732 in play as the absolute bottom, with a major put wall at $730 just beneath. To the upside, the road ran through $741, then $742, with $743, $745, and the major call wall at $746 as the sequential targets before reaching the $748 ceiling. VIX at 18.58 suggested conditions were ripe for volatile early action.
The recommended trading strategy called for position sizing in the 65-70% of normal exposure range with stop-losses in the 1.75-2% zone from entry. Short entries were favored on a push back toward the $742-743 zone on weak breadth, targeting $739 first and $736-737 on follow-through, with a break below $737 opening the door to $734 and $731-732 on extension. Stops on shorts were placed above $744.50. Long setups required a clean breakout above $743.72 on improving breadth to target $746 and then $748-749, or alternatively a confirmed bounce off $737-738 targeting $741 and $743, with stops below $736. The overriding message was to wait for confirmation, honor stops, and avoid chasing in either direction.
Market Performance vs. Forecast
Monday's session produced a volatile tape that gave traders meaningful opportunities to work with the framework on both sides of the range. SPY opened at $744.91, well above Friday's close of $738.93, immediately testing the upper end of the projected window — that gap-up open delivered exactly the kind of volatile early action the forecast had flagged as likely given VIX conditions and negative gamma positioning. The upside target zone of $745-$746 was reached within the session's opening range, with the high of $745.53 tagging the first major resistance cluster the model had identified, validating the level architecture right out of the gate.
From there, the tape did what the framework described in precise terms. The model had warned that below $742, sellers retain the structural edge — and once price failed to hold above that gamma flip point, the pullback accelerated exactly as projected. The forecast had mapped $739 as the first critical line on the downside, $738 as the acceleration zone through negative gamma, and $736 as the next decision point — and Monday's low of $735.87 confirmed all three of those levels played out in sequence, with price finding support just above the $735 put wall battleground the model had explicitly identified as the point of last hope. That low held, and SPY recovered to close at $739.12 — right back into the structural zone the model had treated as the primary battleground throughout the forecast.
The VIX ticking higher by 0.70% to 18.83 aligned with the forecast's caution that volatility remained in a zone demanding respect and that sharp intraday reversals were possible without much warning. Traders who respected the 65-70% position sizing guidance and maintained stops in the 1.75-2% range navigated this wide-ranging session effectively — risk management protocols protected capital through the intraday swing. The level-by-level architecture performed exactly as designed, and the framework's structural roadmap continues to give traders a clear edge in even the most dynamic tape conditions.
Premarket Analysis Summary
The premarket analysis posted at market open identified SPY spot at $745.38 in a call-dominated environment, bouncing off Friday's lows and sitting directly on the heaviest gamma strike of the day. The expected move was framed at 21 points — an unusually wide range signaling traders were pricing in a significant volatility event this week — with $766 as the maximum upside cap and $725 as the maximum downside floor, with a major put wall at $730 serving as the ultimate floor along the way. The defining gate above was set at $747, the level where positive gamma firms up further and buyers gain structural momentum. Above that, $748 was the first target where heavy interest sits, $750 marked the critical round-number pivot and major call wall acting as a price magnet, $752 was the next decision point, and $757 held significant call interest before $766 capped the move. On the downside, $744 was flagged as the first level to watch given how close spot was to it, with a clean breakdown there expected to shift tone quickly. Below $744, the analysis warned that losing $743 could accelerate selling into $742, then $741, with $740 identified as the point of last hope where gamma flips negative — a critical battleground where failure opens the door to $725.
The actual session leaned hard into the downside framework. SPY opened at $744.91, immediately testing the $744 warning level from the first print, and never managed to establish any meaningful footing above spot. Price pushed to a high of $745.53, which barely held within striking distance of the $747 gate but never threatened it, confirming that sellers retained control from the open. The low of $735.87 blew through $743, $742, $741, and $740 in succession, breaching the point of last hope and extending toward the $730 put wall the analysis identified. The session closed at $739.12, with the VIX rising 0.70% to 18.83, reflecting a session where the downside cascade played out almost exactly as warned once $744 gave way early.
Validation of the Analysis
Today's session offered a compelling validation of the premarket framework, with the analysis threading the needle on a complex, two-phase tape that tested both sides of the roadmap before settling into bearish territory. SPY opened at $744.91, right on top of the 744 downside level flagged as the first line of defense — and that proximity was no coincidence. The premarket explicitly warned that losing 744 cleanly would shift the tone, and with the open sitting just pennies above it, disciplined traders were already on high alert from the first print. The early fade did exactly what the analysis projected: a break of 744 opened the door to accelerated selling, and price wasted little time pushing through 743 and 742 on its way to a session low of $735.87 — slicing through 741 and 740 and landing squarely within the expected move window the premarket had mapped out. The 740 level was identified as the point of last hope where gamma flips negative, and the failure there played out precisely as advertised, with the slide extending toward the 725 max downside anchor. That sequence from 744 to 743 to 742 to 741 to 740 printed in order, giving traders who respected the framework a clear and actionable roadmap for managing short exposure throughout the decline.
The intraday high of $745.53 also deserves attention — price briefly tested above the open but couldn't clear the 747 gate the premarket identified as the level where positive gamma firms up. That rejection confirmed the analysis was right to treat 747 as the defining level above, and with buyers unable to push through it, the path of least resistance tilted squarely to the downside. SPY closed at $739.12, well below the 740 gamma flip level, validating the bearish resolution the framework had outlined for a break below that zone. The VIX rising 0.70% to 18.83 reinforced the cautious read the premarket embedded in its wide expected move projection. From the opening stall at 744, through the cascading breakdown, to the close below 740, the levels guided every meaningful decision of the day with precision that's difficult to replicate without a structured framework like this one.
Looking Ahead
Tuesday's economic calendar is quiet as well, with no high-impact releases on the docket to shake up the tape. That keeps the macro backdrop relatively calm heading into the session, but don't mistake a silent calendar for a sleepy market. All eyes are already starting to drift toward Wednesday's FOMC decision, and that anticipation alone is enough to keep positioning tentative and ranges potentially compressed as traders avoid overcommitting ahead of the Fed.
A quiet Tuesday in front of a major catalyst like a Fed decision tends to trade cautiously. Participants who want to be positioned ahead of the statement will be doing their work, and those who don't want the risk will be trimming or standing aside. That dynamic can create a choppy, two-sided session where neither the bulls nor the bears can generate sustained follow-through. Use the session to refine your levels, assess where price is relative to key structure, and let the tape show its hand rather than forcing conviction. The real weight drops Wednesday when the Fed speaks — Tuesday is your last clean window to get positioned.
Market Sentiment and Key Levels
The directional bias today leans modestly bearish, though the session was messy enough that neither side can claim a clean victory. SPY finished barely positive at $739.12, but the intraday story is what matters — the index opened near its highs, sold off nearly ten points to a low of $735.87, and never fully recovered. That kind of price action, where the open acts as the ceiling and the session spends most of its time in retreat, is not the behavior of a healthy bull market. The VIX ticking higher by 0.70% to 18.83 confirms that anxiety is quietly building rather than fading, and below-average volume suggests conviction was hard to find in either direction. The Dow's 0.96% gain adds some confusing noise, but when Nasdaq is shedding -0.82% and mega-cap growth names are getting hit hard, the index-level divergence points to defensive rotation rather than broad-based strength.
Key resistance now sits at $745.53, today's intraday high, which lines up with the opening gap zone and represents the level bulls failed to defend. A clean reclaim of that level on solid volume would shift the tone and bring $747 and $750 back into play. On the downside, $735.87 is the line in the sand — today's session low and the last defense before sellers can make a real push. A decisive close below that level opens the door to $732 and potentially $728, where a more meaningful technical breakdown could unfold. Gold's continued strength at $4,089 signals that the flight-to-safety trade remains very much alive, and crude's sharp drop removes some inflationary pressure at the margin, which is a mild positive for equities. Treasury yields easing slightly also helps at the edges. But with the VIX still elevated and growth stocks struggling to find footing, the burden of proof remains squarely on the bulls. Until SPY can mount a credible move above resistance with volume to back it up, the path of least resistance stays choppy with a downside bias.
Expected Price Action
Tuesday's session presents actionable intelligence generated by our AI model, with SPY projected to trade within a range defined by $725 on the downside and $766 as the max upside target. That forty-one-point window is an exceptionally wide expected move, and it signals the market is set to trend with conviction rather than consolidate — a major volatility catalyst on the calendar this week is already being priced in by options traders. With Friday's close at $739.12 sitting in the lower half of the expected move, the bias leans bearish heading into Tuesday, though the premarket spot of $745.38 reclaiming constructive ground near the heaviest gamma strike complicates the picture and keeps both sides in play.
The defining level to watch Tuesday is $747 — that's the gate above where positive gamma firms up meaningfully and bulls gain real structural support. Above $747, the model puts $748 in the crosshairs where heavy interest sits, then $750 becomes the critical magnet — a round-number pivot and major call wall that price will gravitate toward if buyers press. Above that, $752 is the next decision point, $757 holds significant call interest, and $766 caps the expected move as the absolute upside ceiling. On the downside, $744 is the first level to respect — losing it cleanly shifts the tone and puts $743 in play, where selling could accelerate. A break of $743 opens $742 and then $741 in quick succession. The critical line of last hope sits at $740, where gamma flips negative and a major battleground forms — failure there opens a fast path toward $730, which serves as the ultimate put wall floor, with $725 marking the bottom of the expected move. With VIX ticking up to 18.83 and the expected move ballooned to 21 points, don't underestimate how quickly moves can extend in either direction — if $744 cracks early, expect a swift slide toward $741, and bulls need $747 reclaimed with authority to put $750 back in the conversation.
Trading Strategy
The VIX ticking higher by 0.70% to 18.83 keeps volatility in that uncomfortable middle ground — not extreme enough to signal capitulation, but elevated enough to keep aggressive positioning off the table. At 18.83, the market is sending a message that uncertainty hasn't cleared, and traders need to respect that. Position sizing should stay in the 65-70% of normal exposure range until the tape shows cleaner directional conviction. Stop-losses in the 1.75-2% range from entry remain appropriate here — tight enough to protect capital, but with enough breathing room to handle the intraday whipsaws that tend to show up when VIX is flirting near 19. Don't let the modest uptick in volatility push you into oversizing or chasing — confirmation remains the priority before committing real size.
The session's wide intraday range — with a high near $745.53 before selling dragged price down to $735.87 — carved out clear technical boundaries to work with heading into the next session. In a falling market scenario, a failure to reclaim $740 on the open sets up a short entry with an initial target of $736-737, and a break below $735.87 on follow-through opens the door to $733-734 as the next meaningful level. Stops on short trades belong above $742 to keep risk defined against any surprise reclaim of the range. Below-average volume during the session suggests the selling wasn't panic-driven, which means a bounce attempt is entirely possible — but bounces into resistance are opportunities, not reasons to flip bullish prematurely.
In a rising market scenario, a clean reclaim and hold above $741-742 on improving breadth is the long trigger, targeting $744-745 first and then $747-748 on sustained momentum. The more conservative long setup is a confirmed bounce off the $736-737 zone with visible buying interest stepping in, targeting $739-740 first and $742 on follow-through. Stops on longs belong below $735 to guard against a failed bounce turning into a more serious breakdown. With VIX at 18.83, conditions are manageable but still demand discipline — wait for your level, respect your stop, and don't let intraday noise pull you into trades that haven't confirmed.
Model’s Projected Range
SPY's projected maximum range for Tuesday is $731 to $746, with the Put side dominating in an expanding band that suggests trending price action with intermittent chop. Tuesday brings no economic news due out so the market will trade on technicals. SPY closed at $739.12, up 0.13% on the session, though the day was anything but smooth — price swung from a high of $745.53 down to a low of $735.87 before settling near the middle of that range on below-average volume, with the VIX ticking up alongside the choppy action. SPY remains in the $735 to $740 range that has defined recent trading, with ongoing tariff uncertainty and global trade tensions continuing to keep bulls and bears in a tug-of-war near these levels. On the upside, our model puts the first resistance at $740, and a clean break above that opens the door to $741 next — on the downside, $735 is the first support to watch, and a break there puts $731 in play, and if that gives way there is little to keep price from falling toward $725. The long-term bull trend remains intact above $640 with SPY well above structural support. As long as price holds above key structural levels, this remains a broader dip-buying environment. Absent a catalyst, resistance sits at $740, $741, $742, $745, while support rests at $735, $731, $730, $725. With SPY closing just a hair above $739, we favor buying dips near $735 given the proximity to key support and the broader constructive trend. Bitcoin slipped 0.62% to close above $64,934, while the MAG stocks had a rough session led lower by NVIDIA which dropped 5.87% — Apple was the standout exception, rallying 4.74% and keeping the group from a full washout, though sustained weakness across both leadership groups would be required to signal a deeper pullback. The VIX closed at 18.83, up 0.70%, suggesting elevated fear given the choppy intraday price action and lingering macro uncertainty keeping traders hedged heading into the new session. SPY closed in the lower half of its intraday range and just above the lower line of the trend channel, with structural support near $735 keeping the broader uptrend from being challenged.
Market State Indicator (MSI) Forecast
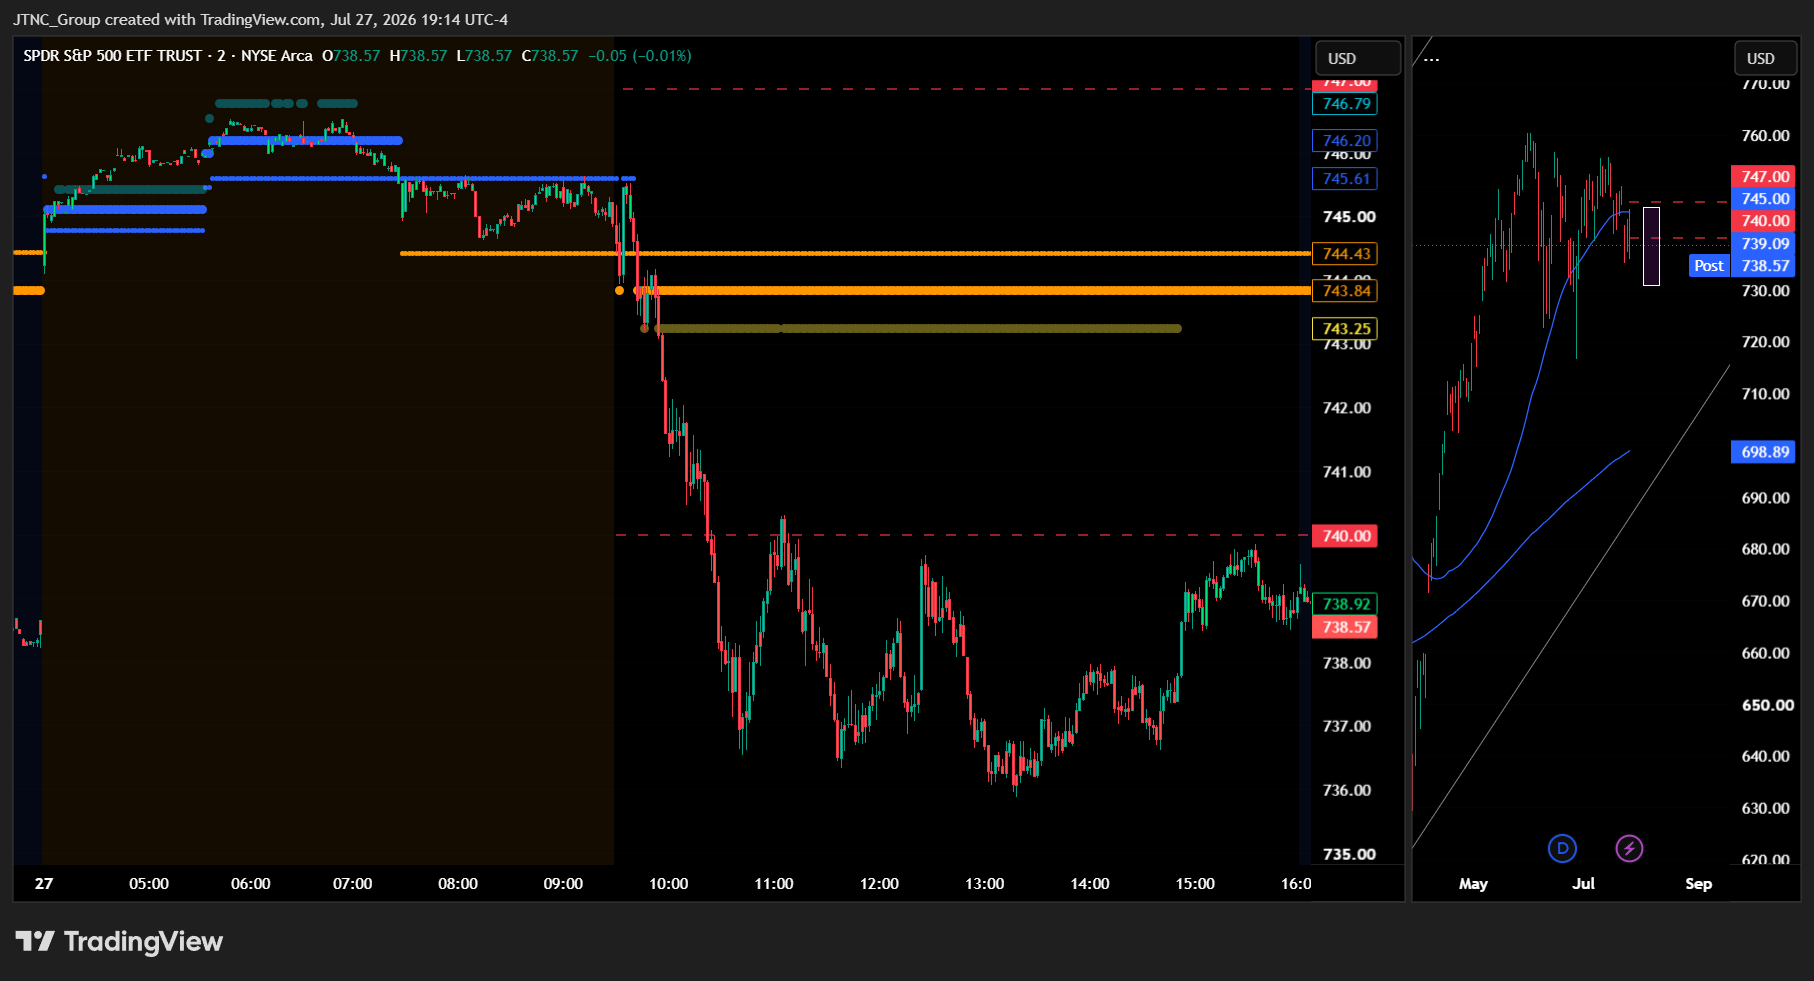
Current Market State Overview:
The MSI ended in a Bearish Trending Market State with SPY closing at $739.12. Since SPY closed well below MSI support, that former support level at $743.84 now flips to act as resistance heading into Tuesday, with $744.44 as the additional resistance layer above. The MSI width remains very narrow at $0.60, and that extremely tight spread signals the market is coiling within a bearish structure rather than pressing lower with any real conviction. Extended targets were not printing at the close, which tempers the urgency of the bearish case and leaves the door open for a consolidation or even a relief move higher in the next session.
Extended targets did print below during the AM session, offering a clear directional cue early in the day, and the premarket showed no extended targets visible. The MSI rescaled higher overnight with a massive gap up that fully closed by midday, and what made that rescale particularly telling was how narrow the MSI remained throughout the entire sequence. When price moves that violently in either direction, you would normally expect the MSI to produce a wide range reflecting expanded momentum. It did not — not on the gap higher and not on the reversal back to Friday's closing MSI levels. Even with extended targets printing below for much of the regular session, the MSI stayed extremely narrow, implying that prices might drift but not run. The message the MSI was sending all day was clear: don't expect follow-through in either direction. And that is exactly what the session delivered — a big move up followed by a big move down that resolved into confusion, leaving SPY virtually unchanged and the market no closer to picking a direction. With FOMC on Wednesday and major earnings on deck, the market is consolidating and waiting on an external catalyst before committing to a longer-term trend. The MSI is forecasting a Tuesday that is likely sideways to possibly up as the narrow bearish spread suggests consolidation rather than strong trending. That said, the bears are likely to maintain pressure to the downside, and any failure of MSI support is likely to see SPY retest the day's lows. MSI support is $743.84 with resistance at $744.44.
Key Levels and Market Movements:
Friday we stated, "the most productive approach is staying reactive to what the MSI communicates in real time rather than committing to a directional conviction before the session begins," and added, "bulls want to see price push back above $743.84 overnight and hold it as support, using it as a base to target $744.44 and potentially higher premarket levels above," while also noting, "a rejection at that level with the MSI remaining in a Bearish Trending state and extended targets resuming below would set up a retest of Friday's low at $737.29 as the next meaningful downside target."
That read set the stage well for what turned out to be one of the more chaotic sessions of the recent stretch. The MSI rescaled sharply higher overnight, and SPY opened at $744.91 with a gap up that initially looked like the bulls were finally asserting control. The Bullish Trending state in premarket with levels near 745 to 746 gave that impression early. But the moment the regular session opened, the MSI rescaled lower and transitioned decisively into a Bearish Trending state, with resistance levels settling near $744.44 and $743.84. That transition was immediate and unambiguous, and traders following the MSI had their signal to shift posture right at the open. From that point forward SPY spent the remainder of the session trading well below MSI support, with extended targets printing below throughout the AM session to confirm the directional lean. Price pressed lower and eventually reached a session low of $735.87 before attempting to stabilize. The recovery off the lows was modest and lacked the kind of sharp reversal seen in prior sessions, and SPY ultimately closed at $739.12, up just 0.13% on a session that covered an enormous amount of ground to get there. Volume came in at 38.16 million shares, below average, which speaks to the lack of real conviction behind either the morning surge or the afternoon drift. The VIX rose 0.70% to 18.83, reflecting the day's underlying anxiety even as the percent change appeared tame.
The primary setup the MSI framework identified was to sell rallies back toward $743.84 once the MSI transitioned to Bearish Trending at the open, targeting premarket levels below as SPY extended lower with extended targets printing to confirm. That setup delivered as price never reclaimed support and continued to slide through the AM session. It was an easy day to read albeit not an easy day to trade given the wide, whippy nature of the swings and the speed of the morning reversal from the gap. But the framework offered at minimum one clear, well-defined setup that aligned with the MSI's directional lean from the moment the regular session opened. At minimum it was a 1-for-1 session for traders following the framework. The MSI continues to prove its reliability as the cornerstone of our trading process.
Trading Strategy Based on MSI:
Tuesday has light economic news so the market is likely to move more sideways than trend given the Bearish Trending at the close. But with such a narrow range it is also likely the MSI rescales overnight and a short squeeze ensues which will push price back to test higher levels. The same extremely tight $0.60 spread that defined Monday's close signals a market that is coiling rather than collapsing, and the absence of extended targets into the close reinforces the idea that the bears have not yet demonstrated they can sustain a clean directional move. Monday's session was essentially a round trip — a big move up erased by a big move down — and that kind of unresolved price action tends to invite more of the same until an external catalyst forces a decision. With FOMC on Wednesday and key earnings from major market weights also in the mix this week, Tuesday is likely to be another session where the market grinds and waits rather than runs.
Heading into Tuesday the MSI closed in a Bearish Trending state with a very narrow $0.60 spread and no extended targets printing at the close. Former support at $743.84 now acts as resistance, with $744.44 as the additional resistance layer above. These are the levels that matter most going into Tuesday's session. The narrow MSI width means a rescale in either direction remains entirely possible overnight, and traders should monitor the premarket session closely for any shift in state that could change the tone heading into the open. The bears need to see $743.84 hold as resistance to maintain pressure and keep the focus on retesting Monday's low at $735.87. The bulls need to reclaim $743.84 with conviction to shift the narrative and put $744.44 and higher premarket levels back in view.
Bulls want to see price push back above $743.84 overnight and hold it as support, using it as a launching pad to target $744.44 and eventually higher premarket levels above. If the MSI rescales higher overnight into a Ranging or Bullish Trending state, the strategy is to buy dips toward $743.84 as support and target levels above, accepting that any recovery may be gradual given the weight of the recent selling and the broader market indecision. Bears want to see $743.84 continue to act as resistance and cap any overnight or early-session recovery attempts. A rejection at that level with the MSI remaining in a Bearish Trending state and extended targets resuming below would set up a retest of Monday's session low near $735.87 as the next meaningful downside target. Either way, any continuation move in either direction will need to be confirmed by the MSI before treating it as a genuine directional shift rather than more of Monday's noise.
Within the session, the core strategy is to sell rallies to $743.84 as long as the MSI holds in a Bearish Trending state, targeting premarket levels below as the primary objective. If price reclaims $743.84 and the MSI rescales higher, that flip is the signal to shift approach and buy dips toward $743.84 as support targeting $744.44 and eventually higher premarket levels above. A failed breakdown attempt where price dips toward Monday's lows but reverses with extended targets stopping below is also a high-probability long setup if that situation develops. The narrow MSI width means both directions remain genuinely in play on Tuesday, and the most productive approach is staying reactive to what the MSI communicates in real time rather than committing to a directional conviction before the session begins.
The long-term bull trend remains intact above $640 and failed breakouts and failed breakdowns continue to offer the highest-probability setups. Remain flexible, avoid trading during Ranging Market States unless a clear failed breakout or breakdown presents itself, and ensure all trades are fully aligned with MSI signals. Providing real-time insights into market control, momentum shifts, and actionable levels, the MSI when integrated with our Pre-Market and Post-Market Reports continues to sharpen execution precision and elevate trade quality. If you haven't yet integrated MSI and our model levels into your process, now is the time. Contact your representative to get started as these tools are designed to support consistency and enhance performance.
Dealer Positioning Analysis
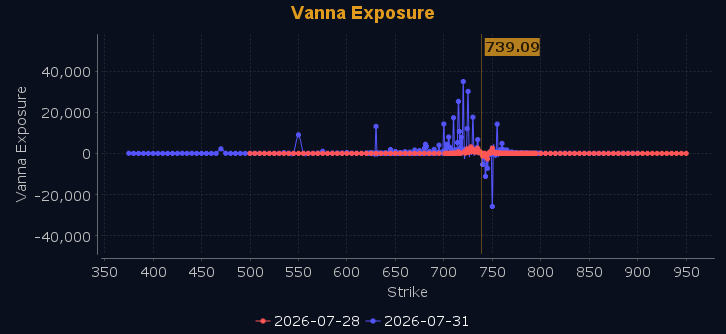
Dealers are selling SPY $746 to $775 and higher strike Calls while buying $740 to $745 Calls, indicating the Dealers' desire to participate in any rally on Tuesday, and they are buying large quantities of ATM Calls suggesting some confidence that prices may rise. SPY tried and once again failed to clear the 50 DMA today, giving back all of the overnight gains, but the heavy Call buying heading into turnaround Tuesday makes a case that Dealers are looking for a rally before the end of the day. The ceiling for Tuesday appears to be $750, and traders should note that below $740 the bias is bearish while above $741 it turns bullish, with heavy chop and trap potential in between. Should SPY reclaim $741, there is little standing in the way of a move toward $745. To the downside, Dealers are buying $739 to $676 and lower strike Puts in a 4:1 ratio to the Calls they're selling, displaying significant concern that prices could move lower, though a heavy wall of support at $735 should help cushion any decline. Dealer positioning is unchanged at neutral/slightly bearish.
Looking Ahead to Next Friday:
Dealers are selling SPY $751 to $782 and higher strike Calls while buying $740 to $750 Calls, indicating the Dealers' desire to participate in any rally this week, as they are buying large quantities of ATM Calls even as they remain heavily hedged heading into earnings season. The ceiling for next week appears to be $755, though resistance at $748 to $750 will slow any meaningful ascent before prices reach that level. Traders should remain bullish above $747, but below $746 the bias shifts bearish, with support sitting at $735 and again at $730 if the market loses ground. To the downside, Dealers are buying $739 to $680 and lower strike Puts in a 4:1 ratio to the Calls they're selling, displaying notable concern that prices could move lower, though Dealers have not increased their protection meaningfully heading into the week. For the week Dealer positioning is unchanged at bearish. We advise reviewing Dealer positioning daily for directional clues. These positions evolve quickly and tracking them is essential for staying ahead of shifting market sentiment.
Recommendation for Traders
SPY closed at $739.12 after a wide intraday range, with $745.53 acting as resistance and $735.87 marking the floor. The Nasdaq's weakness and a VIX rising to 18.83 suggest caution on aggressive longs. Favor a range-bound approach — look for shorts near $745 resistance and longs only on a confirmed hold above $740. Keep size light given below-average volume and no strong directional conviction.
Protect your capital by using defined stops and avoiding oversized positions in this choppy environment. Review the premarket analysis posted before 9 AM ET for any changes in the model's outlook and Dealer Positioning.
Good luck and good trading!
