
Market Insights: Friday, July 24th, 2026
Market Overview
Friday's session was a mixed bag as investors tried to find their footing after Thursday's brutal selloff. The Dow managed to climb around 0.5% while the S&P 500 barely held the flat line, but the Nasdaq slipped another 0.6% as megacap tech continued to weigh on sentiment. All three major indexes still logged weekly losses, with the Nasdaq leading the damage at roughly 2% for the week — a rough stretch driven largely by the Magnificent Seven shedding nearly $800 billion in market cap on Thursday alone. Intel added to the pain on Friday, dropping close to 8% despite posting a blowout second quarter, a reminder that even strong earnings can't always fight a bad tape.
On the macro side, President Trump's new Section 301 tariffs officially kicked in overnight, hitting nearly all US imports with rates of 10% to 12.5%. Energy products got a carve-out, which helped ease some pressure as oil prices actually pulled back — Brent crude dropped 4% to trade below $96 a barrel, though it still finished the week with gains after briefly touching $100. Meanwhile, S&P Global's flash PMI showed US business activity expanded at its fastest pace in eight months in July, partly boosted by World Cup activity. On the earnings front, Verizon, American Express, and NextEra Energy all beat on the bottom line but missed revenue estimates.
SPY Performance
SPY opened at $738.51, right in line with where the prior session left off, and spent much of the day searching for direction after the previous day's sharp selloff rattled sentiment. The intraday range ran from a high of $743.72 down to a low of $737.29 — a span of about six and a half points, which tells you there was still some two-way volatility under the surface even if the end result looked calm on paper. The bulls made enough noise to push the tape higher mid-session, but sellers were never far away, and the gains kept getting trimmed before anything meaningful could develop.
SPY closed at $738.93, up just 0.10%, which is essentially a flat tape after a rough prior session. Volume came in at 41.48 million shares, near average, so this wasn't a low-volume drift — there was real back-and-forth happening, it just didn't resolve in either direction in a convincing way. That kind of indecision after a big down day can actually be constructive if the market holds its ground, but it needs follow-through buying to mean anything. The VIX eased 0.64% to close at 18.58, a modest pullback from the prior session's spike, suggesting fear didn't accelerate further even if it hasn't been fully wrung out yet. The market essentially caught its breath today, but the bulls haven't done enough to reclaim control — they stabilized the situation without actually improving it. More needs to happen before the weight from recent selling gets lifted.
Major Indices Performance
The Dow led the way today, gaining 0.46% in a session that saw blue-chip names find some real footing while the rest of the market struggled to get traction. Defensive and value-oriented stocks carried the load, and the Dow's outperformance relative to the broader market suggests investors were favoring stability over growth in what was ultimately a choppy, low-conviction tape. It's the kind of day where the old-guard names quietly do their job while the flashier side of the market flounders.
The S&P 500 managed a razor-thin gain of 0.10%, essentially a flat close that tells you the market couldn't make up its mind. The spread between the Dow's solid advance and the S&P 500's near-flatline finish points to real divergence under the surface — the index-level numbers are masking a tug-of-war between the growth and value camps that never really got resolved.
The Russell 2000 slipped 0.35%, a modest decline but a telling one. Small-caps have been sensitive to rate dynamics all year, and with yields still elevated, the path of least resistance for smaller companies remains downward. The Nasdaq was the weakest of the group, dropping 0.64%, as growth and tech names continued to face headwinds. The gap between the Dow's gain and the Nasdaq's loss — more than a full percentage point — is a clean illustration of how differently the market is treating value versus growth right now. Rotation into safer, more established names is the dominant theme, and today's spread across the indices makes that crystal clear.
Notable Stock Movements
Tesla was once again the headline name in the Magnificent Seven, this time with a -2.08% decline leading the group lower. After the brutal flush the session before, this follow-through drop signals that the selling pressure around Tesla hasn't found a clean floor yet. Two consecutive down sessions of meaningful size for one of the most widely held names in the market reinforces the idea that investor conviction in the stock is shaky right now, and anyone still holding through this stretch is dealing with some real technical damage underneath.
The rest of the Magnificent Seven was mostly red as well, though Apple, Alphabet, and Microsoft managed to buck the group trend and finish green. That split performance is worth noting — when the heavyweights on the software and services side can hold their ground while Tesla bleeds, it tells you the weakness isn't entirely uniform. Still, with more names finishing in the red than the green, the cohort as a whole remained a modest drag on broader sentiment rather than a stabilizing force.
The group's mixed but mostly negative showing fits neatly into the choppy, directionless feel of the session. The Nasdaq's -0.64% decline reflects the continued pressure on growth and tech names even as the Dow managed to stay positive, and the Magnificent Seven's inability to rally as a group is part of that story. With Tesla still carrying the weight of back-to-back losses, how the name trades in the next session will continue to serve as a barometer for risk appetite across the high-profile, high-beta corner of the market.
Commodity and Cryptocurrency Updates
Crude oil pulled back 1.87% today, closing at $90.47, though the bigger picture here hasn't changed — crude remains firmly entrenched well above $70 and well above any recent model expectations. One down session doesn't undo a rally of this magnitude, and with oil still sitting near $90, the inflationary implications remain very much alive. Every day crude holds at these levels, the Fed's flexibility shrinks a little more. A sustained run above $70 was always going to complicate the rate conversation, and at $90, it's not complicating it — it's dominating it.
Gold had a quiet but positive session, gaining 0.22% to close at $4,056. After yesterday's sharp pullback, this is exactly the kind of stabilization bulls were looking for. Holding above $4,000 and closing near these levels keeps the trend intact, and the fundamental drivers — central bank demand, geopolitical uncertainty, and a murky global rate environment — haven't gone anywhere. A few more sessions like this and the recent pullback gets filed away as healthy consolidation rather than a trend reversal.
Bitcoin slid another 1.66% today, closing just above $63,963, marking back-to-back losses that are starting to demand some attention. The broader structure hasn't broken down, but the absence of any meaningful bounce is a yellow flag. Key support levels need to hold here — if buyers don't show up soon, the risk of a deeper move lower starts to build into the conversation.
Treasury Yield Information
The 10-year Treasury yield finally caught its breath today, pulling back 0.51% to close at 4.680%. After a relentless string of sessions pushing steadily higher — 4.600%, 4.630%, 4.660%, 4.700% — even a modest pause is worth noting. It doesn't change the bigger picture, but it does take a little pressure off the near-term setup and gives equity bulls something to work with, at least temporarily.
Inside the framework, 4.680% keeps us firmly in the pressure zone above 4.5%, where valuations continue to face a structural headwind. The encouraging part is that today's move creates a small amount of breathing room between current levels and the critical 4.8% threshold — we're now sitting 12 basis points away rather than the razor-thin 10 we were staring at yesterday. That's not a dramatic shift, but it matters at the margin. The question now is whether today's dip represents genuine conviction from bond buyers stepping in, or simply a one-session pause before the march higher resumes. Given how little follow-through we've seen from bond buyers throughout this entire move up, skepticism is warranted.
What to watch going forward is straightforward — if yields fail to build on today's pullback and start climbing again, that 4.8% level comes right back into focus as a near-term threat. Any close above 4.8% flips the script from "slow squeeze" to the kind of aggressive, broad-based selling that tends to feed on itself fast. A convincing move back below 4.5% with real follow-through would materially change the outlook for equities, but we're not close to that yet. Stay alert.
Previous Day’s Forecast Analysis
Friday's forecast carried a bearish bias, with the AI model projecting SPY to trade within a nineteen-point range from $734 on the downside to $753 as the max upside ceiling. Thursday's close at $738.30 near the lower end of that range reinforced the bearish lean heading into the session, with sellers firmly in control and the burden squarely on bulls to reclaim key levels.
The critical level to watch was $745, identified as the immediate gate above and the heaviest negative gamma strike — clearing it was the prerequisite for any real recovery attempt. Above that, $747 was the next target, followed by $749 where gamma flips positive and buyers would regain a genuine tailwind. The $750 round-number pivot and $752 call wall were the levels beyond that, with $753 capping the expected move. On the downside, $740 was framed as the major battleground — a substantial put wall sitting inside deep negative gamma territory, serving as the dividing line between an orderly pullback and a sharper leg lower. Below $740, $736 represented the point of last hope before $734 marked the absolute floor.
The recommended trading strategy dialed back position sizing to 60-65% of normal exposure, with stop-losses widened to the 2-2.25% range to account for the elevated intraday swings that come with a VIX near 20. Short setups held the edge, with the $741-742 zone on weak breadth and fading momentum identified as a clean short entry targeting $738 first and $735-736 on follow-through. A break below $735.21 was the trigger for a more extended downside play toward $729-730. Long setups were lower probability — the cleanest long trigger was a confirmed reclaim of $740 on improving breadth with VIX pulling back below 19, targeting $742 and then $744-745. Confirmation over conviction was the theme throughout.
Market Performance vs. Forecast
Friday's session delivered a relatively contained tape that validated the structural framework in several meaningful ways. SPY opened at $738.51, ran up to a high of $743.72, dipped to a low of $737.29, and settled at $738.93 — a gain of just 0.10% on volume near average. Price action stayed entirely within the projected $734 to $753 expected move window, and the session's range aligned closely with the key battleground levels the model had flagged heading into Friday.
The forecast's identification of $740 as the major battleground proved prescient. Price tested above and below that level throughout the session, and the $737-$738 floor — where the put wall had been mapped — held with conviction, with the low of $737.29 confirming that structural support remained relevant. The model had warned that $740 was the line between an orderly pullback and a faster leg lower, and the tape respected exactly that dynamic, with sellers unable to generate the follow-through needed to push toward $736 or $734. The $743.72 session high also validated the $742-$743 short resistance zone the forecast had outlined as the primary resistance reference, with price stalling almost precisely at that ceiling before pulling back.
The VIX cooling 0.64% to 18.58 was consistent with the model's framing that a VIX pullback below 19 would be a prerequisite for any stabilization — and that's exactly what materialized as Friday's range compressed and sellers failed to accelerate. The directional bias leaned bearish in the forecast, and while bulls did manage a fractional gain, the inability to reclaim $745 or push meaningfully above $743 kept bears in structural control of the tape, just as the framework described. Traders who sized down to the 60-65% exposure range and widened stops as recommended navigated the intraday swings effectively, with risk management protocols keeping positions well-protected throughout a session that ultimately resolved in tight, range-bound fashion. The framework's level architecture continues to deliver a reliable roadmap, and as gamma concentrations reset into the new week, the structural edge remains firmly intact.
Premarket Analysis Summary
The premarket analysis posted at market open identified SPY spot at $739.96 sitting in a put-dominated environment, with spot pinned directly on the heaviest negative gamma strike of the day. The expected move framed $748 as the maximum upside cap and $732 as the maximum downside floor, with $730 noted as an enormous put wall just beneath. The defining gate above was set at $742 — the level where gamma flips firmly positive and buyers regain a structural tailwind. Below that, $741 was the first step required before any meaningful repair could begin, but the analysis was clear that until $742 was taken and held with conviction, sellers retained the edge heading into the weekend. On the downside, $739 was the immediate line to watch given spot was essentially sitting on it, with a clean loss of that level expected to confirm sellers' grip. Below there, $738 was flagged as an acceleration point through the negative gamma pocket, $736 the next decision level, $735 the point of last hope with a substantial put wall and deep negative gamma making it a real battleground, and $732 the maximum downside at the bottom of the expected move. The analysis specifically warned that Friday sessions with spot pinned on the largest negative gamma strike can move violently and that minimal cushion existed between $739 and $738 if the early session failed to hold.
The actual session played out almost entirely within the premarket framework. SPY opened at $738.51, immediately below the critical $739 line, confirming sellers' grip from the very first print exactly as the analysis warned. Price pushed to a high of $743.72, which cleared the $742 gamma-flip gate and briefly tagged $743 before fading — validating $742 as a real structural level but stopping short of the $745 call interest. The low of $737.29 held above $736, keeping the downside damage contained to the identified acceleration pocket. The session closed at $738.93, up just 0.10%, with the VIX dropping 0.64% to 18.58, reflecting a choppy but ultimately contained session that respected nearly every key level the analysis laid out.
Validation of the Analysis
Today's session delivered a strong validation of the premarket framework, with the analysis proving its worth across both the downside and the recovery — a more complex tape than a straight directional move, but one the roadmap handled cleanly. SPY opened at $738.51, immediately confirming the premarket's first warning: losing 739 cleanly signals the sellers' grip. That open below 739 put traders on alert right away, and the early slide to a low of $737.29 proved the premarket's caution about minimal cushion between 739 and 738, with the analysis explicitly noting that a break of 739 could see selling accelerate through the negative gamma pocket. Price tagged that zone almost to the tick, offering a well-defined entry for traders watching those levels with discipline.
The real story, though, was what happened next — and the premarket called that too. The analysis identified 742 as the gamma flip level where buyers regain a real tailwind, and SPY's intraday high of $743.72 punched right through that gate and tagged the 743 target on the other side, validating the upside roadmap with equal precision. The sequence of 741 as the first step, then 742 as the conviction level, then 743 as the first target above it played out in order, giving traders who understood the framework a clear path to manage a long off the morning lows. SPY ultimately settled at $738.93, closing back below 739 and confirming that the 742 reclaim didn't hold with the conviction needed to shift control — exactly the kind of outcome the analysis projected for a put-dominated Friday session. The VIX easing 0.64% to 18.58 reflected the brief stabilization without signaling any real change in character. From the opening flush to the intraday bounce and the fade back, the premarket's levels guided every meaningful decision of the day.
Looking Ahead
Monday's economic calendar is light, with no high-impact releases scheduled to drive a directional macro catalyst heading into the session. That puts the focus squarely on price action and positioning as traders return from the weekend without a fresh data point to force their hand. The market will be leaning on what Friday's tape left behind — momentum, sentiment, and wherever the dominant trend stood at the close.
A quiet Monday open isn't neutral by nature. Without a scheduled catalyst to anchor conviction, the session often becomes an extension of the prior week's narrative — either the prevailing trend finds continuation as money flows back in, or the lack of a forcing function leaves room for early positioning chop while traders feel out their footing. Whatever structure Friday builds into the close sets the stage. Clean and directional, and Monday has the conditions to follow through. Ragged and unresolved, and the first session of the week becomes a range-finding exercise rather than a clean move. Stay reactive, keep your levels tight, and let price lead the way.
Market Sentiment and Key Levels
The directional bias today is essentially a coin flip leaning slightly bearish, with neither bulls nor bears able to make a convincing case after a session that went nowhere fast. SPY finished nearly flat with a gain of just 0.10%, but the internal picture tells a more complicated story. The Dow's 0.46% gain looks encouraging on the surface, but Nasdaq slipping -0.64% and the Russell 2000 dropping -0.35% signals that the risk-on appetite investors need to push this market higher just isn't fully showing up. When small caps and growth names are struggling while the blue-chip index catches a bid, that's rotation, not conviction. The VIX dropping 0.64% to 18.58 is a modest positive — it shows the fear gauge is easing off recent highs — but at 18.58 it's still elevated enough to keep aggressive buyers on the sideline.
Key resistance sits at $743.72, today's intraday high, and that level needs to be reclaimed and held before the bulls can make any real noise. Above there, $745 and $747 come back into focus, but those targets feel premature without a clean break first. On the downside, $737.29 — today's session low — is the immediate floor to watch. A decisive close below that level opens the door to a test of $735 and potentially $732, where momentum sellers could make things uncomfortable quickly. With gold continuing its quiet grind higher at $4,056 and Bitcoin slipping -1.66%, the risk appetite across assets is mixed at best. Treasury yields easing slightly helps the macro backdrop at the margin, and crude softening -1.87% to $90.47 removes some inflationary noise from the equation — though oil remaining well elevated keeps the Fed in a tough spot. The bears don't have a commanding edge here, but the bulls haven't earned one either. Until SPY can push through resistance with real volume behind it, the path of least resistance remains choppy and sideways.
Expected Price Action
Monday's session presents actionable intelligence generated by our AI model, with SPY projected to trade within a range defined by $732 on the downside and $748 as the max upside target. That sixteen-point window signals the market will trend rather than consolidate, and with Friday's close at $738.93 sitting in the lower half of the expected move, the bias leans bearish heading into Monday's open — sellers maintained the edge through the week's final session and the burden falls squarely on bulls to reclaim critical levels before any meaningful recovery can take shape.
The defining level to watch Monday is $742 — that's the gamma flip point where buyers regain a real tailwind, making it the gate that has to be cleared and held with conviction for any serious repair attempt. Below $742, sellers keep the structural edge. Reclaiming $741 is the first step, and above $742 the model puts $743 in the crosshairs, then $745 where significant call interest sits. The $746 level marks the major call wall, with $748 capping the expected move top as the max upside ceiling. On the downside, $739 is the first critical line to watch — losing it cleanly confirms sellers are in control. Below there, $738 is where selling could accelerate through the negative gamma pocket, and a break of $738 puts $736 in play as the next decision point. The $735 level is the point of last hope, carrying a substantial put wall and deep negative gamma that makes it a real battleground. Failure there opens $732 as the absolute bottom of the expected move, with an enormous put wall at $730 just beneath as the ultimate floor. With VIX settling at 18.58 and spot pinned on the largest negative gamma strike coming into the weekend, conditions are ripe for volatile early action — if $739 fails to hold at Monday's open, expect minimal cushion and a fast push toward $736, and bears will remain firmly in control until $742 is reclaimed with authority.
Trading Strategy
The VIX dropping 0.64% to 18.58 is a modest improvement from recent elevated levels, but the market isn't out of the woods yet. At 18.58, volatility remains in a zone that demands respect — it's not screaming panic, but it's not complacent either. Traders should keep position sizing in the 65-70% of normal exposure range, as the tape is still capable of sharp intraday reversals without much warning. Stop-losses should be maintained in the 1.75-2% range from entry, tight enough to protect capital but with enough room to absorb the intraday noise that comes with a VIX hovering near 19. Confirmation before committing size is still the rule here — the slight VIX improvement doesn't give the green light to go back to full exposure.
The mixed session — with the Dow pushing higher while tech-heavy indices struggled — creates a somewhat muddled setup heading into the next session. Resistance is clearly established at the $743.72 intraday high, and any push back toward the $742-743 zone on weak breadth or tech underperformance is a reasonable short entry targeting $739 first and $736-737 on follow-through. In a falling market scenario, a break and hold below $737 opens the door to more meaningful downside, with short entries targeting $734 initially and $731-732 on an extended move. Stops on short trades should be placed firmly above $744.50 to keep risk defined against any surprise breakout to the upside.
Long setups have a reasonable case given the near-flat close and the modest VIX relief. In a rising market scenario, a clean breakout and hold above $743.72 on improving breadth sets up a long entry targeting $746 first and then $748-749 on sustained momentum. A more conservative long trigger is a confirmed bounce off the $737-738 zone with visible demand stepping in, targeting $741 first and $743 on follow-through. Stops on longs belong below $736 to guard against a failed bounce turning into a sharper leg down. With VIX at 18.58, conditions are manageable but not fully favorable — wait for your trigger, honor your stops, and avoid chasing moves in either direction.
Model’s Projected Range
SPY's projected maximum range for Monday is $730 to $746, with the Put side dominating in an expanding band that suggests trending price action with intermittent chop. Monday brings no economic news due out so the market will trade on technicals. Friday's session saw SPY open at $738.51, push as high as $743.72, and dip to a low of $737.29 before settling at $738.93, up a modest 0.10% on the day in a relatively tight range with trading volume coming in lower than average. SPY remains in the $735 to $740 range that has defined recent trading, with ongoing trade policy uncertainty continuing to keep institutional participants cautious about committing to a decisive directional move. On Monday, the first resistance our model flags is $740 — a break above that puts $742 in play next, while a failure at first support near $735 opens the door toward $730, and if $730 gives way there is little to keep price from falling toward $725. The long-term bull trend remains intact above $640 with SPY well above structural support. As long as price holds above key structural levels, this remains a broader dip-buying environment. Absent a catalyst, resistance sits at $740, $742, $744, $745, while support rests at $735, $730, $725. With SPY closing near the middle of Friday's range and just below first resistance, we favor shorting rallies near $740 until the level is decisively reclaimed. Bitcoin slipped 1.66% to close above $63,963, showing some softness in the risk-on leadership camp, while MAG stocks were mostly red on the day led lower by Tesla down 2.08%, though Apple bucked the trend with a strong 3.53% gain — sustained weakness across both leadership groups would be required to signal a deeper pullback. The VIX closed at 18.58, down 0.64%, suggesting fear remains contained and the market is not pricing in any immediate shock to the downside. SPY closed near the mid-range of its trend channel, with structural support near $735 keeping the near-term setup balanced between a continuation higher and a retest of the lower end of recent consolidation.
Market State Indicator (MSI) Forecast
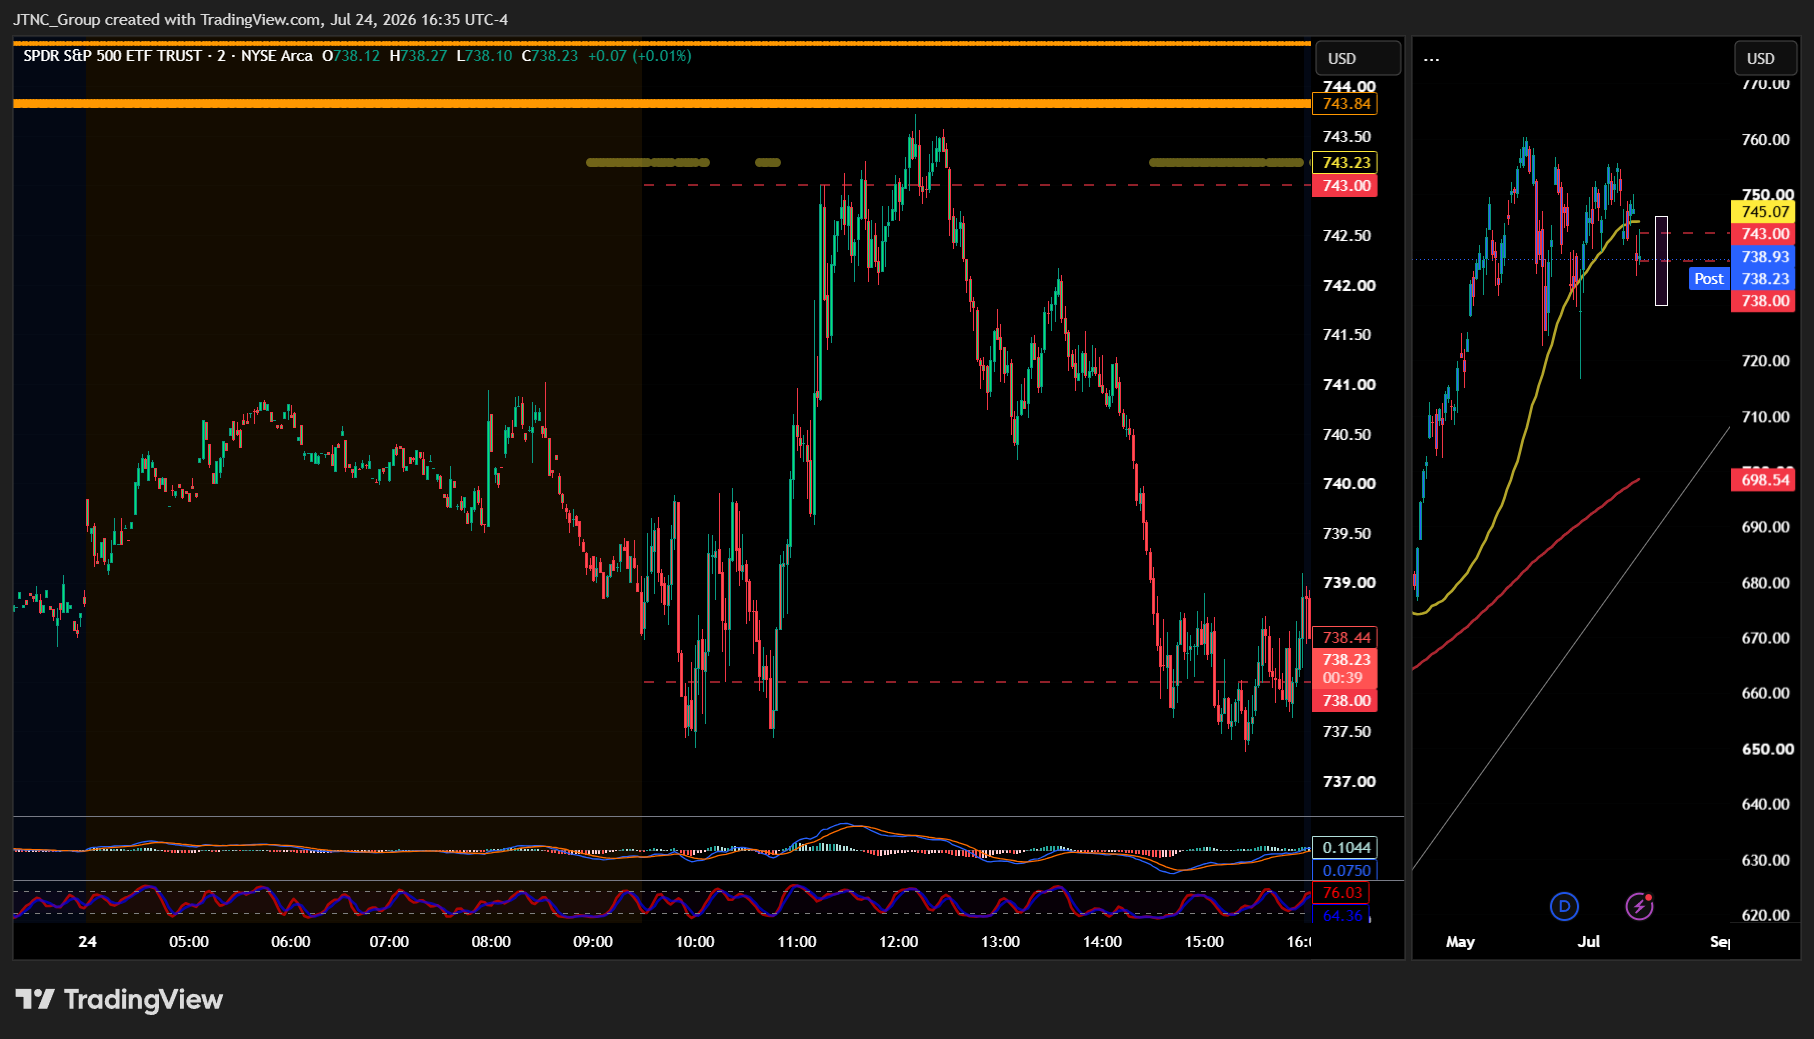
Current Market State Overview:
The MSI ended in a Bearish Trending Market State with SPY closing at $738.93. Since SPY closed well below MSI support, that former support level at $743.84 now flips to act as resistance heading into Monday, with $744.44 as the additional resistance layer above. The MSI width remains very narrow at $0.60, and that extremely tight spread signals consolidation within a bearish structure rather than a market pressing lower with real conviction. Extended targets were not printing at the close, which is a meaningful detail that tempers the urgency of the bearish case heading into the next session. Extended targets did print above during the AM session, providing a directional cue early in the day, but their absence into the close suggests the bulls ran out of gas before the bears could fully take over.
The MSI did not rescale overnight and remained in a very narrow bearish state heading into Friday's open. With extended targets visible in premarket it was clear SPY would move lower toward major support, which it found at $737.50. Those extended targets stopped printing around midday and SPY reversed hard back toward MSI support turned resistance, almost to the penny. That precision reversal led to a double top at MSI support, which rejected the entire move higher and left SPY to finish up just 0.10%, virtually unchanged on the day, just like the MSI itself. When the MSI fails to move meaningfully in either direction, the message is clear — expect a range, no matter how wide the intraday swings get, that tests both sides and resolves nowhere. With extended targets visible heading into the close, Monday does not look favorable for the bulls, assuming the MSI stays in its current state or rescales lower. An external catalyst could certainly shift that narrative, but as of the close the setup favors lower prices to start the week. The MSI is forecasting a Monday that is likely sideways to possibly up, as the narrow bearish spread suggests consolidation rather than strong trending continuation. That said, the bears are likely to maintain pressure to the downside, and any failure of MSI support is likely to see SPY retest the day's lows. MSI support is $743.84 with resistance at $744.44.
Key Levels and Market Movements:
Thursday we stated, "the most productive approach is staying reactive to what the MSI communicates in real time rather than committing to a directional conviction before the session begins," and added, "bulls want to see price push back above $743.84 overnight and hold it as support, using it as a launching pad toward $744.44 and potentially higher premarket levels above," while also noting, "bears want to see $743.84 continue to act as resistance and cap any overnight recovery attempts."
That read set up Friday's session almost perfectly. The MSI held in its very narrow bearish state overnight without rescaling, and with extended targets printing in premarket it was immediately clear that early selling pressure was the path of least resistance. SPY opened at $738.51 and pressed lower through the AM session, eventually finding major support at $737.29, which aligned almost precisely with the $737.50 level the MSI framework had in view. Extended targets stopped printing at midday, and SPY reversed hard off those lows in what became one of the sharper intraday recoveries of the week, surging back toward MSI support turned resistance at $743.84. Price reached a high of $743.72, stopping just shy of that level to the penny, and the precision of that reversal point was a textbook example of former support acting as a ceiling. From there SPY formed a double top at resistance and rejected, surrendering nearly the entire recovery and closing at $738.93, up just 0.10% on the session. Volume came in at 41.48 million shares, near average, suggesting neither side had the conviction to push through key levels. The VIX eased 0.64% to 18.58, a modest decline that reflects a market catching its breath rather than decisively changing character.
The session offered two well-defined setups for traders following the framework. With extended targets visible in premarket and the MSI in a Bearish Trending state, the primary setup was to sell the AM rally as SPY approached MSI support turned resistance at $743.84, targeting premarket levels below as the directional objective. That setup delivered cleanly as price rejected hard at resistance. The secondary setup emerged as extended targets stopped printing midday and SPY staged a sharp recovery off the $737.29 low, offering a long opportunity for traders who recognized the failed breakdown signal and captured the move back toward $743.84. At minimum it was a 2-for-2 session for traders following the framework. It was a volatile but readable day with substantial setups, all identified through proper context, patience, and flexibility while leveraging the MSI, premarket levels, and market structure rather than forcing trades. The MSI continues to prove its reliability as the cornerstone of our trading process.
Trading Strategy Based on MSI:
Monday has light economic news so the market is likely to move more sideways than trend given the Bearish Trending at the close. But with such a narrow range it is also likely the MSI rescales overnight and a short squeeze ensues which will push price back to test higher levels. The same extremely tight $0.60 spread that defined Friday's close signals a market that is coiling rather than collapsing, and the absence of extended targets at the close reinforces the idea that the bears have not yet proven they can sustain this move through the weekend. The double top rejection at $743.84 is worth respecting, but so is the sharp intraday recovery off $737.29 — markets that can mount that kind of reversal from intraday lows often carry unfinished business into the next session. Any overnight rescaling will be the clearest signal of what Monday intends to deliver.
Heading into Monday the MSI closed in a Bearish Trending state with a very narrow $0.60 spread and no extended targets printing at the close. Former support at $743.84 now acts as resistance, with $744.44 as the additional resistance layer above. These are the levels that matter most heading into Monday's session. The narrow MSI width means a rescale in either direction remains entirely possible overnight, and traders should monitor the premarket session closely for any shift in state that could change the character of Monday's open. The bears need to see $743.84 hold as resistance to maintain any hope of retesting Friday's lows, while the bulls need to reclaim that level with conviction to shift the tone back toward the upside.
Bulls want to see price push back above $743.84 overnight and hold it as support, using it as a base to target $744.44 and potentially higher premarket levels above. If the MSI rescales higher overnight into a Ranging or Bullish Trending state, the strategy is to buy dips toward $743.84 as support and target premarket levels above, accepting that any recovery may be gradual given the weight of the recent selling. Bears want to see $743.84 continue to act as resistance and cap any overnight or early-session recovery attempts. A rejection at that level with the MSI remaining in a Bearish Trending state and extended targets resuming below would set up a retest of Friday's low at $737.29 as the next meaningful downside target. Any continuation lower will need to be confirmed by the MSI before treating it as a genuine directional move rather than weekend noise.
Within the session, the core strategy is to sell rallies to $743.84 as long as the MSI holds in a Bearish Trending state, targeting premarket levels below as the primary objective. If price reclaims $743.84 and the MSI rescales higher, that flip is the signal to shift approach and buy dips toward $743.84 as support targeting $744.44 and eventually higher premarket levels above. A failed breakdown attempt where price dips toward Friday's lows but reverses with extended targets stopping below is also a high-probability long setup if that situation develops. The narrow MSI width means both directions are genuinely in play on Monday, and the most productive approach is staying reactive to what the MSI communicates in real time rather than committing to a directional conviction before the session begins.
The long-term bull trend remains intact above $640 and failed breakouts and failed breakdowns continue to offer the highest-probability setups. Remain flexible, avoid trading during Ranging Market States unless a clear failed breakout or breakdown presents itself, and ensure all trades are fully aligned with MSI signals. Providing real-time insights into market control, momentum shifts, and actionable levels, the MSI when integrated with our Pre-Market and Post-Market Reports continues to sharpen execution precision and elevate trade quality. If you haven't yet integrated MSI and our model levels into your process, now is the time. Contact your representative to get started as these tools are designed to support consistency and enhance performance.
Dealer Positioning Analysis
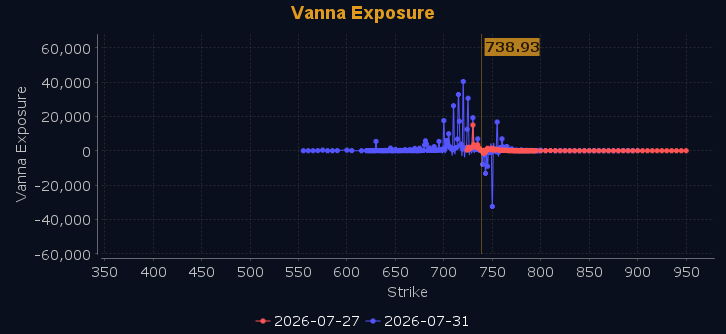
Dealers are selling SPY $744 to $775 and higher strike Calls while buying $739 to $743 Calls, indicating the Dealers' desire to participate in any rally on Monday, though they are not committing significant capital to that effort. SPY tried and failed to reclaim the 50 DMA today, and given the prevailing weakness and elevated level of hedging, Dealers appear to be anticipating lower prices heading into next week. The ceiling for Monday appears to be $750, and traders should note that below $738 the bias is bearish while above $742 it turns bullish, with heavy chop and trap potential in between. Should SPY reclaim $742, there is little standing in the way of a move toward $745. To the downside, Dealers are buying $738 to $676 and lower strike Puts in a 4:1 ratio to the Calls they're selling, displaying significant concern that prices could move lower, though a heavy wall of support at $735 to $730 should help cushion any decline. Dealers remain heavily hedged for any eventuality. Dealer positioning is unchanged at neutral/slightly bearish.
Looking Ahead to Next Friday:
Dealers are selling SPY $751 to $782 and higher strike Calls while buying $739 to $750 Calls, indicating the Dealers' desire to participate in any rally next week, as they are buying large quantities of ATM Calls even as they remain heavily hedged heading into earnings season. The ceiling for next week appears to be $755, though a wall of resistance above $751 will slow any meaningful ascent before prices reach that level. Traders should remain bullish above $751, but below $745 the bias shifts bearish, with choppy and trap-filled conditions in between, and support sitting at $735 and again at $730 if the market loses ground. To the downside, Dealers are buying $738 to $680 and lower strike Puts in a 4:1 ratio to the Calls they're selling, displaying notable concern that prices could move lower, though Dealers have not increased their protection meaningfully heading into the week. For the week Dealer positioning is unchanged at bearish. We advise reviewing Dealer positioning daily for directional clues. These positions evolve quickly and tracking them is essential for staying ahead of shifting market sentiment.
Recommendation for Traders
SPY closed near flat at $738.93 with mixed signals across indices — the Nasdaq and Russell in the red while the Dow held gains. With VIX easing 0.64% to 18.58, conditions are less fearful but not yet a clear green light for aggressive longs. Watch $743.72 as resistance from today's high — a clean break above opens room higher, while a failure there favors fading toward $737.29 support. Neither side has a convincing edge here, so trade the range and wait for confirmation.
Keep position sizes modest until a clearer directional trend emerges. Review the premarket analysis posted before 9 AM ET for any changes in the model's outlook and Dealer Positioning.
Good luck and good trading!
