Market Insights: Thursday, July 24th, 2025
Market Overview
Stocks ended Thursday mixed, but the S&P 500 managed to post its fourth straight record close, thanks in large part to strong earnings from Alphabet that reignited hopes around AI’s growth potential. The Nasdaq also reached another all-time high, driven by tech optimism. Alphabet’s results came in ahead of expectations and underscored its continued investment in AI, a move that markets viewed as a key catalyst for future growth. Shares of Alphabet rose sharply, helping lift sentiment across AI-linked names like Nvidia. However, Tesla weighed on the broader picture, falling more than 8% following a revenue miss and a warning from Elon Musk about tough quarters ahead due to the end of key EV tax credits.
Meanwhile, IBM’s post-earnings slide dragged the Dow lower, erasing early gains. The broader market was also buoyed by continued optimism around trade. Following the U.S.-Japan tariff deal announced earlier this week, reports indicate that a similar framework with the EU is close, with a 15% baseline tariff being discussed, down from the 30% initially floated. President Trump’s push for “reciprocal” tariffs remains central, with the August 1 deadline fast approaching. Despite the mixed performance across indices, investor sentiment remains risk-on as AI tailwinds and de-escalating trade tensions continue to drive the narrative.
SPY Performance
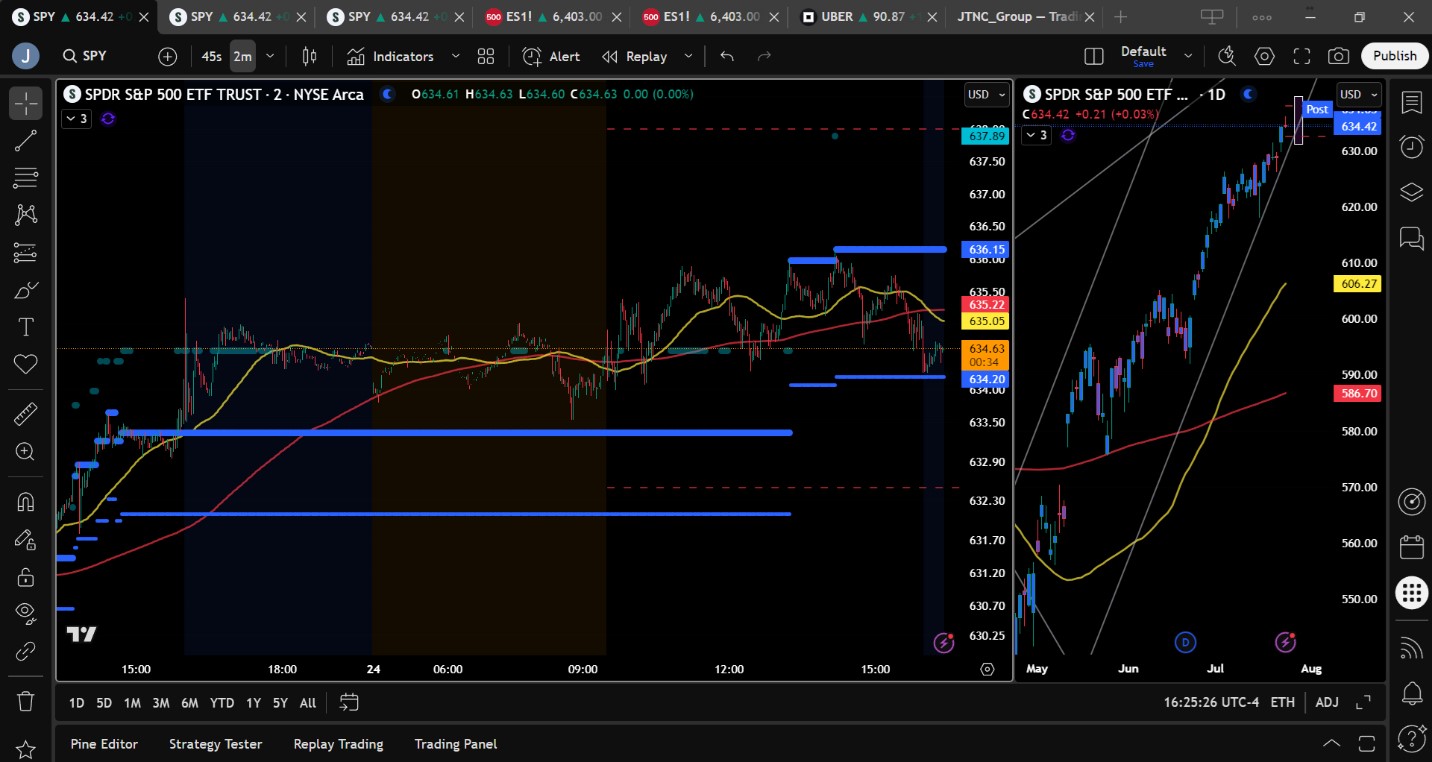
SPY closed Thursday nearly flat, inching up 0.04% to settle at $634.47 after reaching a new intraday high of $636.15. The ETF opened at $634.60 and briefly dipped to a session low of $634.02 before recovering. Trading volume increased to 66.14 million shares, indicating continued investor interest and bullish undercurrents despite the day’s modest gains. With SPY continuing to set all-time highs, momentum remains intact, although signs of short-term exhaustion are beginning to emerge.
Major Indices Performance
The Nasdaq led the major indices with a 0.18% gain, closing at another record high thanks to strength in Alphabet and Nvidia. The S&P 500 followed with a slim 0.04% gain, notching its fourth straight record close. In contrast, the Dow fell 0.70%, dragged down by weakness in IBM after earnings. Small caps saw the steepest decline as the Russell 2000 slid 1.32%, reflecting some risk-off behavior in that segment of the market. While tech and AI-centric names continued to show leadership, broader market participation was limited. Sector rotation remains in focus, with traders increasingly cautious ahead of next week’s FOMC announcement.
Notable Stock Movements
Among the Magnificent Seven, Alphabet led with a gain of over 1% after delivering strong earnings and emphasizing continued AI investment. Nvidia and Amazon also posted solid gains, reinforcing the tech sector’s leadership. Tesla was the clear laggard, dropping more than 8% on a disappointing quarter and renewed concerns about demand in Europe. Apple also dipped slightly by 0.18%. The mixed performance within this key group highlights growing investor selectivity, particularly as valuations and expectations remain elevated.
Commodity and Cryptocurrency Updates
Crude oil rose 1.38% to settle at $66.15, a sharp rebound that briefly countered the recent bearish tone. However, the model maintains its long-standing view that oil is on a path toward $60 later this year. Gold declined 0.69% to $3,374 as traders moved away from defensive assets amid improved risk sentiment. Bitcoin edged up 0.74% to close just above $118,800, continuing its choppy but generally upward trajectory as speculative appetite remains intact.
Treasury Yield Information
The 10-year Treasury yield climbed slightly by 0.30% to close at 4.402%, inching closer to the key 4.5% mark. Yields remain elevated, and while they haven’t yet reached danger levels, traders are watching closely. A break above 4.8% would likely spark broader equity selling, with 5.2% still the red line for a potential market correction of 20% or more. For now, the move reflects moderate inflation expectations and ongoing market resilience.
Previous Day’s Forecast Analysis
Wednesday’s forecast projected SPY to trade between $630 and $636 with a bullish bias, contingent on maintaining strength above $630. Upside targets were set at $635 and $640, while support was expected at $630, $628, and $625. The model favored long trades on dips to support and advised tightening stops near upper resistance zones. Given the economic data scheduled and earnings reports due, a cautious but opportunistic tone was emphasized, particularly if SPY held above $630.
Market Performance vs. Forecast
SPY’s performance Thursday closely mirrored the prior day’s expectations. It opened at $634.60, briefly pulled back to test the $634 area, and surged to a new all-time high at $636.15 before closing modestly higher at $634.47. This movement remained within the model’s projected range of $630 to $636 and respected the key bias level at $630. Upside resistance at $635 was breached intraday, but sustained momentum was lacking, in line with the forecast’s warning that resistance near $640 could spark hesitation or profit-taking. Long trades off early support and into the $635 zone once again proved profitable, validating the forecast’s bullish bias and tactical strategy.
Premarket Analysis Summary
In Thursday’s premarket analysis posted at 7:46 AM, SPY was trading at $634.87 with a bullish tone, supported by positive sentiment around AI earnings and trade progress. The analysis identified $632.50 as the bias level, favoring long entries above that point. Targets to the upside were $635, $638, and $640, while downside levels were $632.50, $630, and $628. The strategy advised dip buying near support and anticipated consolidation near $635 before any meaningful push higher. A break below $632.50 was expected to lead to short-term consolidation or a drift toward $630.
Validation of the Analysis
Thursday’s market action validated the premarket analysis almost exactly. SPY held above the key $632.50 bias level throughout the session, briefly testing support near $634 before rallying to an intraday high of $636.15, nearly tagging the $638 target. The early strength and modest consolidation around $635 matched the expected price behavior. Long trades near early support paid off, and the cautious tone around resistance proved prudent. Overall, the analysis accurately predicted the day’s structure, reinforcing the reliability of the premarket model.
Looking Ahead
Friday’s session is expected to be quieter, with no scheduled economic data releases. This calm before next week’s key events, including the FOMC statement and jobs data, may lead to a continuation of Thursday’s narrow trading range. With SPY closing near its highs and sentiment still skewing bullish, traders will be watching closely for signs of consolidation or any early rotation into defensive sectors. Volatility could return quickly if unexpected news emerges, especially related to global trade or corporate guidance.
Market Sentiment and Key Levels
SPY enters Friday trading at $634.47, just beneath meaningful resistance near $635 and within striking distance of the next key levels at $637, $639, and $640. Sentiment remains bullish, supported by strong earnings, easing trade tensions, and a resilient technical uptrend. Key support is now at $632, followed by $630, $627, and $625. Bulls remain in control while SPY stays above $625, but any break below $630 would mark a significant shift, potentially signaling the start of a larger pullback. Until then, dip buyers are likely to continue stepping in.
Expected Price Action
Our AI model projects SPY to trade between $632 and $638 on Friday, an actionable intelligence range suggesting continued choppy price action with the potential for trending moves. The bias remains bullish as long as SPY holds above $632, with upside targets at $637 and $640. A clean breakout above $640 would be a major bullish confirmation, but it is likely to trigger some profit-taking. On the downside, a failure to hold $632 could bring a retest of $630 or even a deeper drop to $625. With no economic news scheduled, expect volume to taper off slightly, but bulls may try to push prices higher ahead of next week’s data-heavy schedule.
Trading Strategy
With SPY pressing against resistance at $635, long trades remain favorable on pullbacks to $632 and $630, with upside targets at $637 and $640. If those levels break to the upside, momentum could build quickly, but traders should tighten stops into strength. Short trades should only be considered on a confirmed break below $625, targeting $622 and $620, but they remain lower probability given current market momentum. The VIX rose slightly to 15.46, still in a complacent zone, but this subtle uptick suggests traders should be alert. Position sizes should remain conservative around resistance as we approach a heavy macro calendar next week.
Model’s Projected Range
The model projects SPY’s maximum range for Friday between $631.25 and $639.75, with the Call side dominating within a narrowing, 4-point band suggesting choppy price action punctuated by occasional trending moves. Overnight, the market moved sideways in a tight range. Before the open, SPY pulled back slightly before dip buyers stepped in, pushing it to another new all-time high at $636.15. Strong earnings from Google and favorable tariff news from the EU contributed to SPY’s continued ascent. The U.S. appears to have control of the trade narrative, which continues to support the broader market. SPY spent much of the session consolidating within a narrow $2 range, a pattern likely to persist ahead of next week’s FOMC statement. While bulls remain in control, with dip buyers quick to respond to even minor pullbacks, the series of daily new highs is beginning to look extended and a pause or short-term consolidation may be on the horizon. Nonetheless, new highs reinforce the prevailing bullish trend. Since reclaiming the $585 level, SPY has remained in a strong uptrend. With a close near $635, bullish momentum is intact, setting the stage for a potential test of the $640 area, where we anticipate meaningful resistance and likely profit-taking. Tariff-related headlines remain a key risk, and as those uncertainties are resolved, market drivers will increasingly shift back to economic data, earnings, and valuations. Any negative developments could quickly shift sentiment, but in the absence of surprises, the broader trend remains higher. Key resistance levels heading into Friday are $637, $639, and $640, while major support lies at $630, $627, $625, and $620. Momentum continues to favor the bulls, and near-term action is likely to center on whether the $634 level holds. A pullback to this area may offer another buying opportunity, but a failure to hold $634 could trigger a move to $632, an important line in the sand. A successful defense of $632 keeps the ultra-bullish scenario alive, with upside targets at $640. If $632 breaks, the next key level is $630; below that, the path opens toward $625 or even $620. Our model turns bearish below $625. While the probability of a deeper correction is currently low, a break below $600 would notably increase the odds of a retest of the $585 level. Early signs of potential weakness emerged last week as we moved toward August, but the strength of recent sessions has tempered those concerns. Still, the market feels increasingly stretched, and with a parabolic rise off the April lows, seasonal weakness may reemerge post-FOMC. From August through October, bears may attempt to reclaim some ground, though our model currently assigns a low probability to that outcome. We note it only due to subtle signs beginning to appear in our model. SPY continues to close above the lower edge of a redrawn bullish channel from the April lows, confirming the trend’s strength. However, the $635–$643 resistance zone is dense and may limit near-term upside. The market remains sensitive to macroeconomic data, bond yields, inflation prints, tariff news, and fiscal policy shifts. The VIX rose slightly by 0.59% to 15.46, reflecting a continued risk-on tone. We continue to recommend maintaining hedges on long positions at these levels, particularly through 90-day out-of-the-money VIX calls, as we expect volatility to pick up later this quarter.
Market State Indicator (MSI) Forecast
Current Market State Overview:
The MSI is currently in a Bullish Trending Market State, with SPY closing mid-range. Extended targets printed during the overnight and morning sessions which pushed SPY to new all-time highs intraday. Overnight the MSI remained in a bullish state from the prior day’s close but rescaled higher twice during the afternoon session. Extended targets preceded the rescaling, which implied the herd was participating in the day’s rise to new highs. But extended targets stopped printing just after noon and price found MSI resistance too much to overcome and pulled back slightly into the close to settle mid MSI. Overnight our model suggests SPY may pull back and consolidate to a low of $632 however with the MSI in a bullish state, prices on Friday are not likely to decline much from the current levels. MSI support is currently $634.20 with resistance at $636.15.
Key Levels and Market Movements:
On Wednesday, we wrote, “After the close, Tesla and Google will report earnings, which could also introduce volatility into the mix. As such, Thursday may be a good day to observe and let the MSI provide clearer guidance before initiating any trades.” We also noted, “Without a new external catalyst, the market is likely to grind higher. The projected range remains stable at 5 points, indicating a continuation of sideways movement,” and added, “Odds favor SPY churning in a range overnight, with bulls looking to defend the $632 level. If that support holds, it could pave the way for a move toward $640.” With this plan in hand and SPY opening just below $635 above MSI resistance turned support, we looked for an opportunity to go long and see how far SPY could run on the day. While extended targets were printing and the bull trend remained intact, there simply wasn’t a suitable setup to enter a long position. We would have taken a bounce off MSI support at $633.30, but price never retraced to that level. By the afternoon, extended targets stopped printing, and the only opportunity was a short on a failed breakout at 2:20 p.m. at MSI resistance. We waited for confirmation that extended targets had ceased before entering, and shorted at $635.85 with a first target at MSI support at $634.20. While we didn’t love this countertrend trade, it was the only setup the market offered. We held the position to the close, and a bit of good fortune saw SPY fall right to MSI support, where we exited 100% of the trade and wrapped up the day. It was a challenging session, just as we anticipated in yesterday’s post-market recap. Long was the preferred play, but the only viable setup came during premarket at 8:45 a.m. and we only report trades that occur during regular market hours. So, one short it was, which added nicely to the wallet thanks to having a plan, sticking to it with discipline, and trusting the MSI’s directional cues in alignment with our broader market model and key levels. The MSI remains a cornerstone of our consistent trading process.
Trading Strategy Based on MSI:
Friday brings no major economic news, so the market is likely to continue its recent pattern grinding higher within the steep, uncorrected channel that has been in place since the April lows. While tariff headlines or other unexpected developments could disrupt this path, in the absence of a new external catalyst, we expect more of the same until next Wednesday’s FOMC meeting. Emotion and FOMO continue to drive price action, and with the projected range narrowing slightly, the sideways-to-up bias remains intact. The broader bullish trend is supported by stronger-than-expected Q2 earnings and persistent new highs. Overnight, we expect SPY to churn within a range, with bulls aiming to defend the $634 level. If that support holds, it could pave the way for a move toward $640. However, if $634 breaks and fails to recover quickly, a drop to $632 is likely, and a sustained move below that could open the door to a deeper pullback toward $625. That said, any meaningful pullback still appears to be a low-probability outcome, so we continue to favor dip buying at major support levels and on failed breakdowns, as bulls remain firmly in control of the broader trend. While traders should stay alert for tariff-related headlines out of the White House, the market’s resilience in the face of potential risks only reinforces the case for continued upside. With the MSI currently in a Bullish Trending Market State, we expect slightly higher prices on Friday. Our preference is for long setups above $632, with potential short opportunities near $638 or on failed breakouts and breakdowns below $625, particularly if the MSI begins to weaken. As always, failed moves remain among the highest-probability setups. Stay nimble, avoid trades during Ranging Market States, and ensure full alignment with MSI. Providing real-time insights into market control, momentum shifts, and actionable levels, the MSI when integrated with our Pre-Market and Post-Market Reports continues to sharpen execution precision and elevate trade quality. If you haven’t yet integrated MSI and our model levels into your process, now is the time. Contact your representative to get started as these tools are designed to support consistency and enhance performance.
Dealer Positioning Analysis
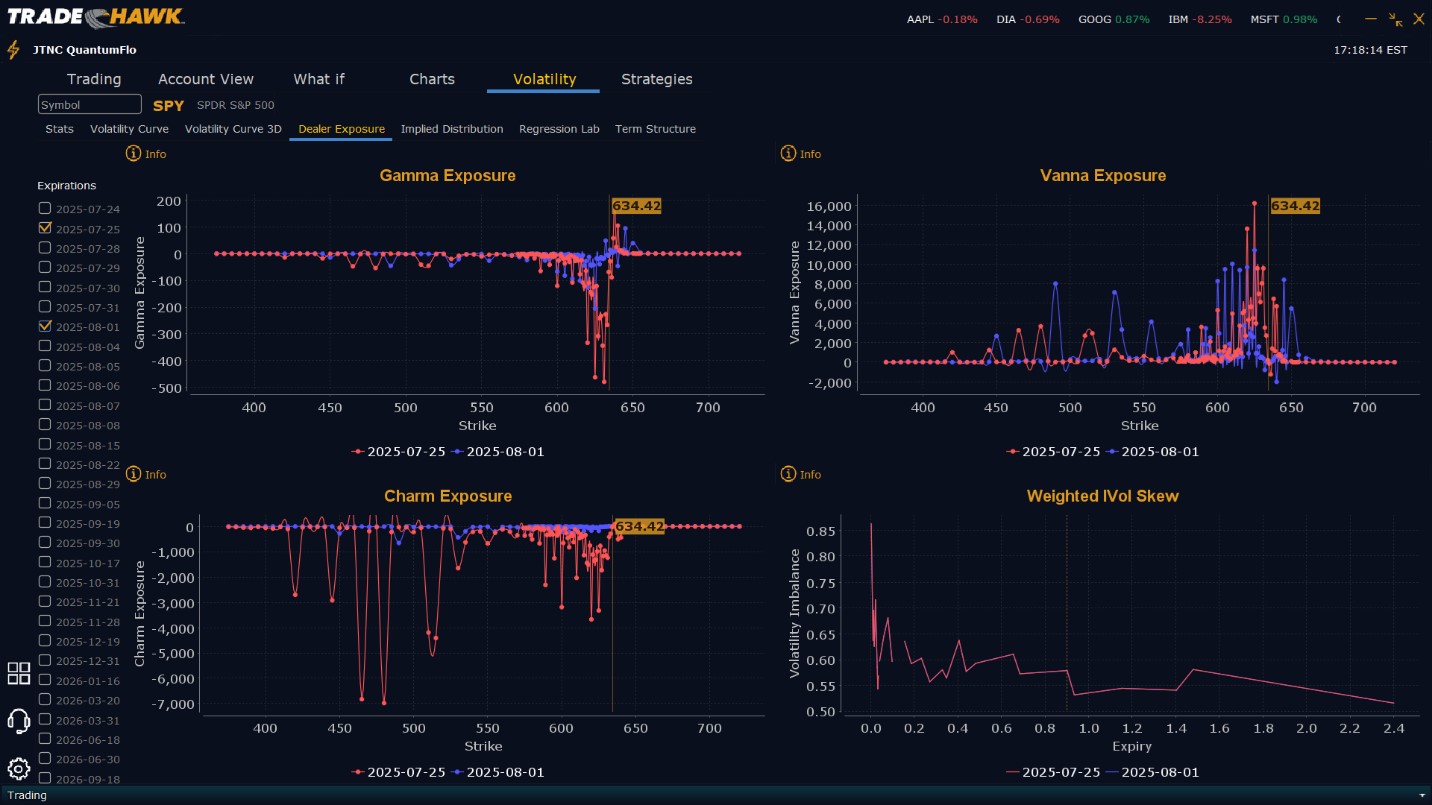
Summary of Current Dealer Positioning:
Dealers are selling SPY $636 to $643 and higher strike Calls while buying $635 Calls indicating the Dealers desire to participate in any rally on Friday. Once again Dealers nailed the positioning yesterday for today. The ceiling for tomorrow appears to be $638. To the downside, Dealers are buying $635 to $575 and lower strike Puts in a 3:1 ratio to the Calls they’re selling/buying implying little concern that prices may move lower on Friday. Dealer positioning is unchanged from slightly bearish/neutral to slightly bearish/neutral.
Looking Ahead to Next Friday:
Dealers are selling SPY $635 to $660 and higher strike Calls while selling $632 Puts in small size, while also buying $640 Calls in large size indicating the Dealers belief that prices will not decline beyond $632 next week. Dealers only sell near the money Puts when they are confident in higher prices. Dealers are also buying $640 Calls so Dealers are looking to participate in any breakout above this level. The ceiling for the week appears to be $645 which has moved up significantly. To the downside, Dealers are buying $634 to $500 and lower strike Puts in a 6:1 ratio to the Calls they’re selling/buying, reflecting a bearish outlook for next week. Dealers have not increased their hedges however and this ratio is likely more a reflection of protection as opposed to bearish concerns. With August 1st as another tariff deadline, and given the seasonally weak period for the market, Dealers are protecting from any potential downside which is showing up in our model. For the week Dealer positioning is unchanged from bearish to bearish. We advise reviewing Dealer positioning daily for directional clues. These positions evolve quickly and tracking them is essential for staying ahead of shifting market sentiment.
Recommendation for Traders
SPY remains in a strong uptrend, but with price action consolidating below $635, traders should prepare for either a breakout or a short-term pullback. Long trades continue to offer the highest probability of success on dips to $632 and $630, with upside targets at $637 and $640. Traders should be cautious near $640, where profit-taking may increase. Short setups become viable only if SPY breaks below $625, targeting $622 and $620 or above $638 on failed breakouts. The VIX at 15.46 still reflects complacency but may start to rise quickly if volatility returns. Manage risk carefully and consider reducing size at resistance. Review the premarket analysis posted before 9 AM ET to account for any changes in the model’s outlook and in Dealer Positioning.
Good luck and good trading!
