
Market Insights: Monday, July 20th, 2026
Market Overview
Stocks kicked off the week in the red Monday, with the Dow dropping 0.6% and the S&P 500 slipping about 0.2%, while the Nasdaq edged just below the flat line as chip stocks gave back earlier gains. The session came on the heels of a rough week for semiconductors, and the market is still searching for its next catalyst on the AI trade after a series of sector rotations left investors unsettled. All eyes are now shifting to a packed earnings week featuring Alphabet, Intel, IBM, and Tesla — Wall Street has ramped up expectations that these companies will show they're actually monetizing their massive AI investments, not just spending on them.
Geopolitics kept things interesting too, as oil prices swung wildly after the US-Iran conflict escalated over the weekend. The US carried out its ninth straight day of strikes, Iran retaliated with attacks on US allies including Kuwait, and President Trump warned Iran "will pay" for American military casualties. Yemen's Houthi militia piled on by declaring a blockade against Saudi Arabian oil exports, sending Brent crude futures higher on the day — though prices are still well off their April and May peaks, hinting that energy markets may be starting to price in alternative shipping routes around the Strait of Hormuz.
SPY Performance
SPY opened at $747.06 and spent the early part of the session holding its ground, with buyers briefly pushing the tape to a high of $748.73 before the energy fizzled and the sellers reclaimed control. From there, price worked its way lower through the session, eventually bottoming at $741.51 before stabilizing into the close. It wasn't a dramatic collapse, but it was another session where bulls failed to hold the morning strength — and that pattern is starting to speak for itself.
SPY closed at $742.21, down 0.15%, a relatively modest loss on the surface but still a red close that keeps the bears in control of the narrative. Volume came in at 41.00 million shares, near average, so this wasn't a low-conviction drift — there was enough participation to make the inability to hold early gains meaningful. The silver lining, if there is one, is that the VIX pulled back 2.34% to close at 18.33, snapping the back-to-back fear readings from the prior two sessions and offering at least a small signal that the panic may be cooling. But one day of VIX relief doesn't erase the damage that's been done, and with SPY still unable to mount a real defense of the morning highs, the bulls have yet to show they can string together anything convincing. The burden of proof remains firmly on their side.
Major Indices Performance
The Nasdaq edged out the best relative performance of the major averages on the day, finishing down just 0.05% in what amounted to a near-flat session for tech and growth names. Given the pressure that's been building on that complex lately, holding nearly flat is a quiet win. The index didn't generate any real upside momentum, but the fact that it didn't buckle further suggests the heaviest sellers may have stepped back for now.
The Russell 2000 finished down 0.39%, which continues to be the story of small-caps trailing off quietly while the larger indices absorb the headlines. There's still no convincing evidence that institutional money is rotating into this space with any conviction, and that lack of sponsorship keeps the small-cap index in a frustrating holding pattern. It's not a dramatic decline, but it's another session where small-caps failed to find their footing.
The Dow was the laggard on the day, dropping 0.59%, which is a bit of a reversal from the recent dynamic where blue-chips had been providing relative shelter. The S&P 500 also finished slightly in the red. The spread between the Nasdaq and the Dow — about 0.54 percentage points — is notable because it flips the usual script. Growth held its ground while the more traditional, value-oriented names felt more of the drag, suggesting the rotation dynamic that's been in play is far from settled. That divergence between the growth-heavy index and the blue-chip average is worth keeping on your radar as the market continues searching for a clear directional catalyst.
Notable Stock Movements
Tesla took the hardest hit in the Magnificent Seven today, dropping as much as 2.96% to lead the group lower and stand out as the clear laggard in an otherwise constructive session for mega-cap tech. That's a notable single-day move for a name that carries as much sentiment weight as Tesla does, and it's the kind of decline that gets attention even when the broader group is holding up well. Whether investors are reacting to broader concerns about EV demand, valuation, or simply using Tesla as a pressure valve in a choppy tape, the selling had enough conviction to make it the defining story for the cohort today.
The rest of the Magnificent Seven told a very different story, with Microsoft leading the charge to the upside by climbing as much as 2.15% in what was a mostly green day across the group. Meta and Apple were the other exceptions alongside Tesla, closing in the red while their peers pushed higher. That split within the cohort is worth noting — when the more enterprise-focused, software-heavy names like Microsoft are outperforming while the consumer-facing and sentiment-driven names absorb the selling, it suggests investors are making careful distinctions about where they want their mega-cap exposure rather than treating the group as a monolith.
The Magnificent Seven's mixed-but-mostly-green showing fits reasonably well with the cautious tone that played out across the broader market today. The Nasdaq's modest 0.05% decline confirmed that technology wasn't under any serious systemic pressure, and the VIX slipping 2.34% to 18.33 reflects a modest easing of volatility that tends to provide at least some support for high-multiple names. Microsoft's strength was the headline story for the group, but Tesla's sharp pullback is the one worth watching closely in the sessions ahead.
Commodity and Cryptocurrency Updates
Crude oil slipped just 0.10% on the session but still closed at $82.41, keeping it firmly in elevated territory that continues to create headaches for anyone hoping the Fed pivots sooner rather than later. Energy prices stubbornly parked above $80 mean inflation has a persistent tailwind that policymakers can't easily dismiss, and today's near-flat session doesn't suggest any relief is coming. Geopolitical tensions and supply dynamics remain the dominant forces keeping crude bid at these levels, and as long as oil stays in this neighborhood, the Fed's case for cutting rates gets harder to make with every passing week.
Gold was essentially unchanged on the day, closing at $4,012 with a 0.00% move. After yesterday's strong reclaim of $4,000, today's flat session is actually constructive — it tells you sellers didn't rush back in to fade that recovery. Holding above $4,000 two sessions in a row reinforces the idea that the dip buyers who stepped in yesterday weren't just a one-day trade. The fundamental case for gold — central bank demand, geopolitical uncertainty, and a complex global rate environment — hasn't shifted, and the price is reflecting that stability.
Bitcoin tacked on 0.52% and closed just below $65,030, continuing its quiet grind higher. The crypto market is showing real resilience here, holding well above the $60,000 floor that bulls have been defending for weeks. Today's modest but positive move keeps the intermediate-term setup intact, and with no signs of meaningful distribution, the path of least resistance still appears to be higher.
Treasury Yield Information
The 10-year Treasury yield moved in the wrong direction on the session, climbing 1.26% to close at 4.600%. After yesterday's modest dip gave bulls a brief reason for optimism, today's move higher erases that progress and then some, pushing yields further above the critical 4.5% threshold that keeps equity headwinds firmly in play. One step forward, two steps back — and that pattern is exactly what makes this yield environment so frustrating for anyone hoping stocks can mount a sustained rally.
Inside the framework, 4.600% is a meaningful location. We're sitting 20 basis points above the 4.5% danger line, and the distance to 4.8% — where selling tends to become more aggressive and broad-based — has now narrowed to just 20 basis points as well. That gap can close fast on a single hot inflation print, a surprisingly resilient jobs number, or any hint of a hawkish lean from Fed officials. The brief dip yesterday that looked like it might signal some genuine downside momentum in yields has already been faded, which tells you conviction on the bond bull side remains thin at best.
What's notable here is that today's equity tape didn't completely fall apart despite yields climbing back toward the upper end of this danger zone, but that's not something bulls should read as comfort. The market's mild losses today mask a yield setup that is quietly tightening the screws. Until yields show a convincing and sustained break back below 4.5% — not a one-day dip, but a genuine multi-session retreat with momentum — the path of least resistance for equities remains choppy at best. A continued grind higher toward 4.8% would shift the tone in markets considerably. The burden of proof still belongs to the yield bears, and today they failed to deliver.
Previous Day’s Forecast Analysis
Yesterday's forecast called for SPY to trade within a $735 to $755 expected range, with the bearish bias anchored by Friday's close at $743.15 sitting in the lower portion of that twenty-point window. The model flagged $746 as the critical gate to watch — the heaviest negative gamma strike and the first level bulls needed to reclaim before any real recovery attempt could take shape. Above there, $748 and then $750 were identified as the next hurdles, with $751 marking the gamma flip level where buyers would finally gain structural tailwind and $755 capping the upside ceiling. On the downside, $744 was the first line in the sand, and losing it cleanly was expected to confirm seller control and accelerate the tape toward $742 and then the $740 major put wall. A failure at $740 was flagged as the trigger that opens the door to $735, the bottom of the expected move and the ultimate floor.
The trading strategy leaned short-side given the VIX surge to 18.40, with position sizing pulled back to 65-70% of normal exposure and stop-loss parameters widened to the 1.75-2% range to account for elevated intraday volatility. Long setups were identified in the $740-741 zone on stabilizing volume, targeting $747 initially and $747.29 on follow-through, with stops below $740.80. The higher-probability play was the short side — a failed rally into $747-748 resistance offered a fade entry targeting $743 and then $740-741, while a decisive break below $740.80 opened the door to $737 and $734-735 on extension, with stops above $744. The overarching message was clear: let the key levels do the work, respect the elevated volatility, and stay disciplined with size and stops.
Market Performance vs. Forecast
Monday's session delivered a tight, largely rangebound outcome that validated the model's core directional framework with notable precision. SPY opened at $747.06 — right in line with the $746 to $748 resistance band the forecast had identified as the immediate gate and first battleground — and spent the session oscillating within a defined range before settling at $742.21, a modest decline of 0.15%. The forecast had leaned bearish heading into Monday with Friday's close sitting in the lower portion of the expected range, and that bias proved correct. The bulls briefly tested resistance at the open, tagging a high of $748.73 that pressed right into the $748 resistance level outlined in the forecast, and when they failed to clear it convincingly, sellers reasserted control and walked price back down — exactly the dynamic the short setup framework had anticipated.
The downside levels also held up well. The model had identified $741 to $742 as a critical support shelf and decision point, and Monday's low of $741.51 tested that zone before buyers stepped in to defend it — a textbook interaction with the structural map. The $740 major put wall was never tested, and the session low stayed well above the $735 floor, meaning the model's range contained the actual price action cleanly on the downside. The failed rally into the $747 to $748 resistance band on a subsequent fade was precisely the short setup scenario the forecast had outlined, with the entry trigger and downside targets toward $743 playing out in an orderly fashion. Risk management protocols protected capital for any trader who respected defined entries and kept position sizing at the reduced 65 to 70% exposure level the forecast had explicitly recommended.
The VIX eased slightly, dropping 2.34% to close at 18.33, offering a modest reprieve from the fear escalation the prior session had introduced without yet signaling a full reversal in hedging demand. Monday's session is a reminder that the framework's greatest value often shows up on tight, well-contained days — when the levels hold, the entries trigger cleanly, and discipline determines outcome. The model delivered exactly that, and the structural map remains as relevant as ever heading into the next session.
Premarket Analysis Summary
The premarket analysis posted at market open identified SPY spot at $747.23 sitting in a call-dominated environment, bouncing off Friday's expiration lows and reclaiming firmer footing heading into the new week. The defining gate above was set at $748 — described as the immediate level where positive gamma builds decisively and the first obstacle buyers needed to clear with conviction. Above there, $750 was flagged as the major call wall and heaviest concentration zone of the day, acting as the primary magnet if buyers pressed. $752 was identified as the next decision point, $754 marked resistance, and $757 capped the expected move as the maximum upside. On the downside, $746 was the first level to watch just beneath spot, with a clean loss there stalling the recovery attempt. Below $746, $745 was flagged as the gamma flip and key battleground where negative gamma begins and selling could accelerate. $744 was the next decision point, $742 a key support level, and $738 sat at the bottom of the expected move as the line in the sand, with a major put wall at $740 just above providing a layer of defense. The overall bias leaned bullish, with the $750 magnet as the upside focus and $745 as the critical downside pivot.
The actual session delivered a sharp rejection of the bullish thesis. SPY opened at $747.06, briefly ticked up to a high of $748.73 — technically tagging the $748 gate but failing to hold it with conviction — and then reversed hard, slicing through $746 and $745 without meaningful defense. The $745 gamma flip proved decisive, as the breakdown accelerated through $744 and $742 before bottoming at $741.51, landing just above the $738 max downside target but well inside the negative gamma pocket the analysis had warned about. The close at $742.21 confirmed sellers maintained control after the early failure at $748, and the VIX dropping 2.34% to 18.33 suggested the move was orderly rather than panic-driven, but the damage to the recovery setup was clear. The $750 magnet never came into play.
Validation of the Analysis
Today's session delivered a clear example of the premarket framework identifying the critical levels in advance and letting price action confirm them in real time. SPY opened at $747.06, nearly flush with the premarket's spot price of 747.23, and the analysis was direct about what needed to happen next — 748 was the immediate gate, and holding it with conviction was the prerequisite for unlocking the pull toward 750. The open told the story right away: SPY made a brief run at 748, tagging a high of $748.73, which actually cleared that gate by a slim margin. But that push above 748 couldn't hold, and the session spent the rest of the day confirming the downside framework instead.
The premarket was equally precise on the bearish side. The analysis flagged 746 as the first level to watch on any breakdown, described 745 as the gamma flip and key battleground where negative gamma begins, and warned that a failure of 745 would accelerate selling toward 744 through the negative gamma pocket. That's exactly what the tape delivered. Once buyers failed to sustain above 748, the retreat through 746 and then 745 triggered the acceleration the framework described, and SPY sliced through 744 and pushed all the way down to a low of $741.51 — directly between the 742 key support level and the 740 major put wall the analysis identified as max downside anchors. SPY closed at $742.21, settling right on the 742 level the premarket named as a key support zone, giving traders who respected the downside roadmap a precise destination before the open. The VIX dropping 2.34% to 18.33 was the one divergence, reflecting some options relief even as price pressed lower. Every significant move today had a named level waiting for it — that's the defining value of this framework.
Looking Ahead
Tuesday's economic calendar is quiet, with no high-impact releases on the schedule to shake up the session. That puts traders squarely in positioning mode, carrying forward whatever conviction — or lack of it — built up during Monday's tape. Without a data catalyst to force a hand, Tuesday becomes a session driven by technicals, sentiment, and the broader narrative already in motion.
A clean calendar can cut both ways. If Monday left bulls in control with clean price structure, Tuesday gives them room to extend without interference. But if there's lingering uncertainty from recent Fed commentary or macro crosscurrents, a quiet session can let that unresolved tension simmer rather than resolve. No news isn't necessarily good news — it just means the market moves on its own terms. Keep your levels tight, respect what price is telling you, and don't manufacture a trade where the calendar isn't giving you one.
Market Sentiment and Key Levels
The directional bias today leans bearish, though the bulls managed to keep the damage contained. SPY shed just 0.15% on the session, but the price action tells a more cautious story — the open near $747 faded throughout the day with the close at $742.21 sitting well below the intraday high of $748.73 and only modestly above the low of $741.51. That kind of upper-end rejection, where price couldn't hold early gains and drifted toward the bottom of the range, hands the edge to the bears heading into the next session. The one encouraging data point is the VIX dropping 2.34% to 18.33, which at least signals that fear didn't accelerate — but at 18.33, the fear gauge is still elevated enough to keep bulls on their heels.
Key resistance sits at $748.73, the session high, and any push back above that level on solid volume would be a meaningful development that could put $750 to $752 back in play. On the downside, $741.51 is the immediate support floor from today's low, and a clean break below that level would be a bearish signal that opens the door toward the $738 to $739 zone rather quickly. The mixed picture across major indices — with the Dow's steeper decline acting as a drag while the Nasdaq held up relatively well — suggests there's no clean narrative driving this market in one direction. Gold's flat session at $4,012 offers little in the way of flight-to-safety conviction, while Bitcoin's modest 0.52% gain closing below $65,030 shows risk appetite hasn't completely rolled over. The 10-year yield ticking up to 4.600% keeps the macro pressure alive, and any further climb would add another layer of headwind to equity valuations that are already stretched. The bears hold a slight edge, but a VIX continuation lower and some stabilization at current levels could quickly bring the bulls back into the conversation.
Expected Price Action
Tuesday's session presents actionable intelligence generated by our AI model, with SPY projected to trade within a range defined by $738 on the downside and $757 as the max upside target. That nineteen-point window signals the market will trend rather than consolidate, and with Monday's close at $742.21 sitting in the lower portion of the expected move, the bias leans bearish heading into Tuesday's open.
The defining level to watch Tuesday is $748 — that's the immediate gate above and the critical threshold where positive gamma builds decisively. Bulls need to reclaim $748 convincingly before the move toward $750 becomes viable, and that $750 level is where the heaviest call wall concentration sits, acting as the primary magnet if buyers can press through. Above $750, the model identifies $752 as the next decision point, followed by $754 as resistance, with $757 capping the expected move top as the max upside ceiling. On the downside, $746 is the first level to defend — losing it cleanly stalls any recovery attempt before it gets started. Below $746, $745 is the gamma flip and a key battleground where negative gamma begins to take hold and selling can accelerate. A break of $745 puts $744 in play as the next decision point, with $742 serving as a critical support level just below Monday's close. The model places $740 as a major put wall just above the floor, with $738 marking the absolute bottom of the expected move and the ultimate line in the sand. With the VIX cooling to 18.33 but the tape still grinding near the lower end of the projected range, the burden remains on the bulls — $746 must hold early, and if it fails and $745 breaks, expect an aggressive push through the negative gamma pocket toward that $744 to $742 battleground.
Trading Strategy
The VIX dropping 2.34% to 18.33 is a modest improvement in sentiment, but don't let that small pullback lull you into complacency. At 18.33, volatility remains elevated enough that the market can still deliver sharp intraday reversals without much warning, and the modest decline across all major indices confirms that buyers aren't exactly rushing in with conviction. Until VIX gets back below 17 and holds there, position sizing should stay at roughly 65-70% of normal exposure, and stop-losses need to remain in the 1.75-2% range from entry to account for the noise baked into this tape. The near-average volume tells you this wasn't a panic session, but the inability to hold early gains keeps the short-term bias cautiously neutral at best.
Long setups require patience here. The $741.51 session low is the first key support shelf to monitor — a retest of the $741-742 zone on stabilizing breadth and shrinking selling pressure offers a tactical long entry with an initial profit target at $748, and a secondary target at $748.73 if momentum builds. In a rising market scenario, reclaiming and holding $748 on a retest sets up a momentum continuation play targeting $750 first and then $752-753 on follow-through, with stops planted firmly below $741.51 to guard against a structural breakdown. That low is your line in the sand — losing it on any meaningful pickup in activity shifts the entire short-term picture.
Short setups carry the better risk-reward in this environment. A failed rally back into the $747-748 resistance band on weak breadth or renewed selling pressure is a clean fade entry, with downside targets at $743 first and then $741-741.51 if sellers regain control. In a falling market scenario, a decisive break below $741.51 on increasing pressure opens the door to short entries targeting $737 initially and $734-735 on an extended move, with stops placed above $745 to keep risk tight. With VIX at 18.33 and the market still unable to push meaningfully higher, let the levels do the talking — trigger on confirmation, keep size disciplined, and respect your stops without hesitation.
Model’s Projected Range
SPY's projected maximum range for Tuesday is $734 to $749, with the Put side dominating in an expanding band that suggests trending price action with intermittent chop. Tuesday brings no economic news due out so the market will trade on technicals. SPY opened at $747.06, tagged a high of $748.73, then faded to a low of $741.51 before closing at $742.21, down 0.15% on the session — a relatively contained range that showed sellers capping early strength and holding price in check into the close. SPY is trading near our model's first support at $740, and ongoing uncertainty around trade policy continues to weigh on sentiment at the margin. If $745 resistance is reclaimed, the next target above is $748, while a break of $740 support opens the door to $735 on the downside — and if that level fails, there is little to keep price from falling toward $730. The long-term bull trend remains intact above $640 with SPY well above structural support. As long as price holds above key structural levels, this remains a broader dip-buying environment. Absent a catalyst, resistance sits at $745, $748, $749, $750, while support rests at $740, $735, $734, $730. Given that SPY closed closer to the lower end of the range at $742.21, we favor buying dips near $740 on any early weakness Tuesday. Bitcoin closed below $65,030, up just 0.52% on the day, showing modest but uninspiring action, while MAG stocks were mostly green led by Microsoft up 2.15%, though Tesla dragged on the group with a loss of 2.96% — a mixed leadership picture that keeps bulls from getting too comfortable. The VIX closed at 18.33, down 2.34%, suggesting a modest reduction in fear even as SPY struggled to hold gains, which is a mild positive for the near-term backdrop. SPY closed just above the lower line of its near-term trend channel, with structural support nearby — bulls need to defend the $740 area to keep the broader uptrend from deteriorating further.
Market State Indicator (MSI) Forecast
Current Market State Overview:
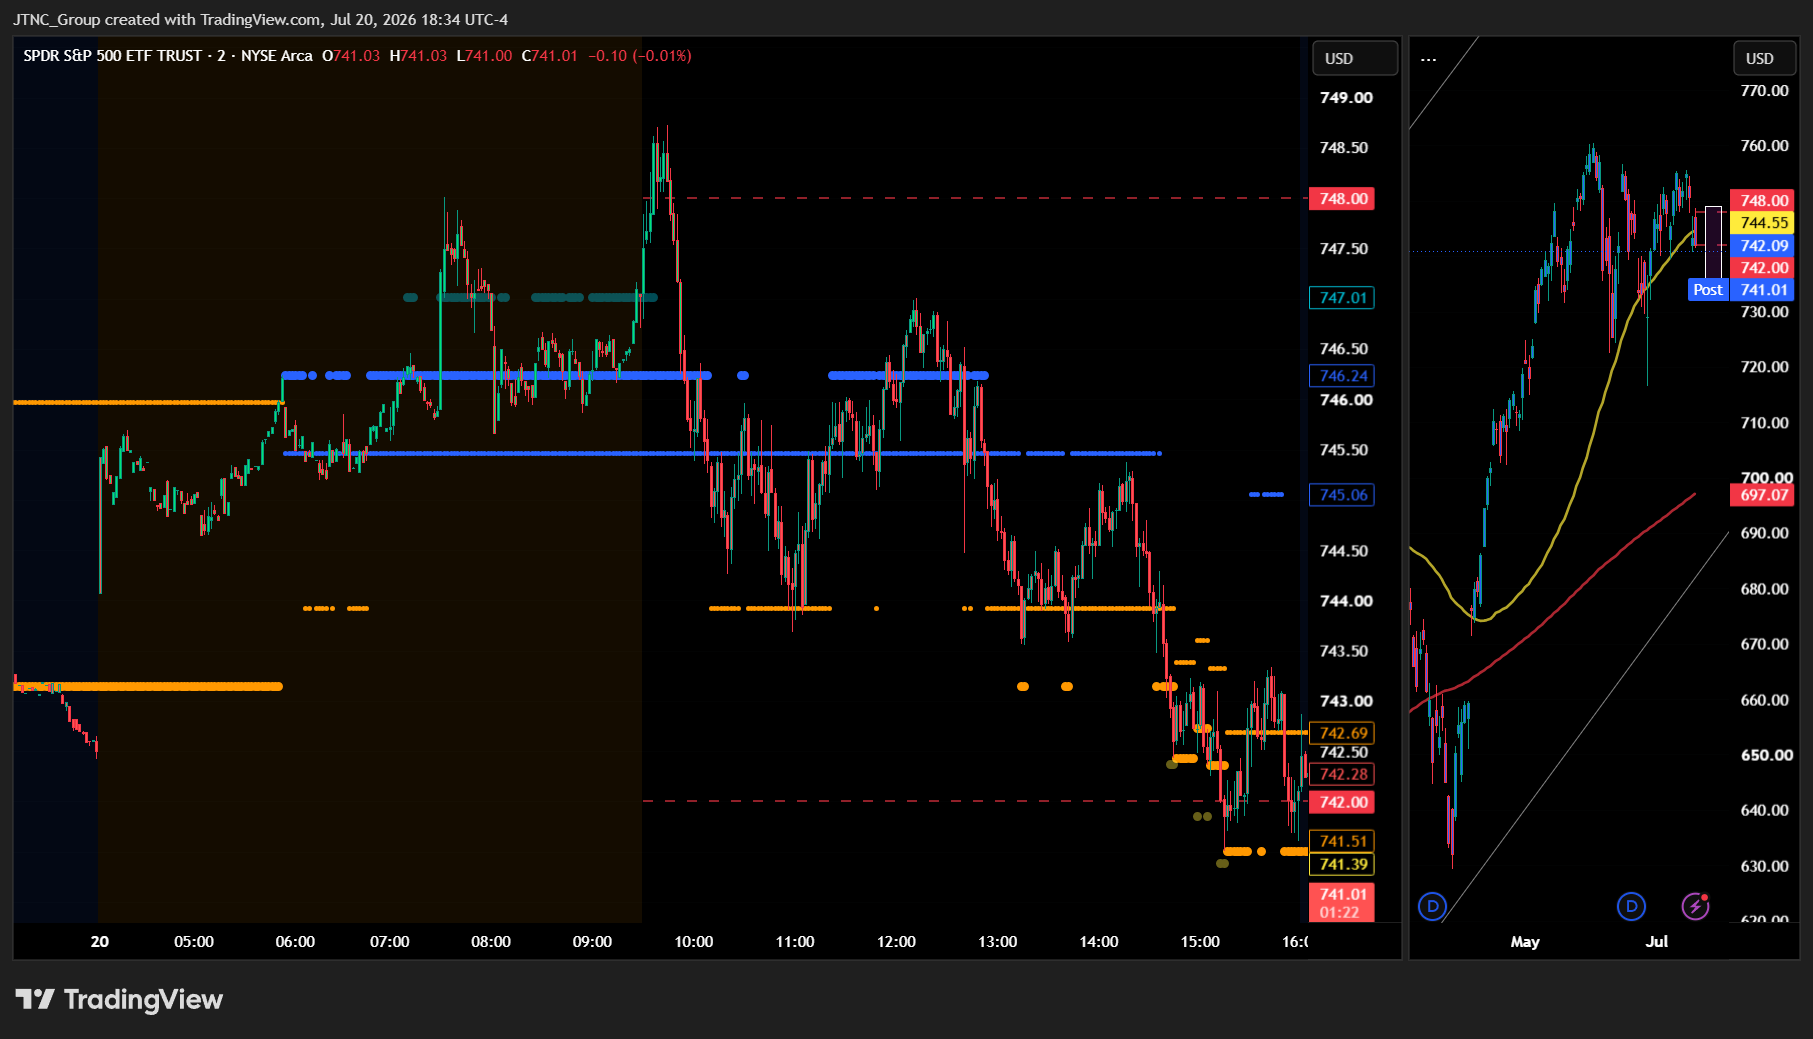
The MSI ended in a Bearish Trending Market State with SPY closing at $742.21. MSI resistance at $742.69 sits just above the close heading into Tuesday, with support at $741.51 below. The MSI width of $1.18 is extremely narrow, and that tells you this is a market coiling rather than trending with conviction. A spread this tight reflects compression rather than directional dominance, and traders should respect that dynamic heading into Tuesday's session. Extended targets were not printing at the close, which tempers any aggressive bear case for a gap-down continuation overnight. However, extended targets did print below during both the AM session and the PM session, confirming the bears were firmly in control for the better part of the day when it mattered most. The absence of extended targets in premarket was a divergence from the session that followed, as the MSI rescaled higher overnight with extended targets visible in a very narrow bullish state, which set up the early pop at the open before sellers reasserted themselves.
The session itself was a story of shifting control. The MSI rescaled higher overnight with extended targets printing and that led to a quick pop near the open, but the moment those extended targets stopped printing the rally faded immediately. SPY moved sideways through mid-morning as the MSI rescaled into a narrow ranging state. That calm didn't last. A post on Truth Social triggered a meaningful sell-off in the PM session and the MSI rescaled lower several times with extended targets printing below, confirming the sellers had seized full control. SPY retested Friday's lows and bounced, but the close below the 50-day moving average leaves the bulls in a difficult position. With no extended targets printing into the close and a very narrow MSI, the market is likely to trade sideways to possibly up on Tuesday, though the bears are likely to maintain pressure to the downside and any failure of MSI support opens the door to retesting the day's lows. MSI support is $741.51 with resistance at $742.69.
Key Levels and Market Movements:
Friday we stated, "any rally to MSI resistance at $745.97 should be treated as a shorting opportunity unless the MSI signals otherwise," and added, "Bears want to see $743.15 fail. A clean break below $743.15 with the MSI rescaling into a deeper Bearish Trending state and extended targets printing below would confirm the sellers are pressing the advantage and bring $740 into view as the next likely support magnet, with $736 as a secondary target beyond that," while also noting, "staying reactive to what the MSI is doing in real time is far more valuable than committing to a directional bias before the open."
That read proved largely accurate as the bears maintained control through the bulk of the session. SPY opened at $747.06, briefly pushed to a session high of $748.73 in the early going while the MSI was still reflecting a bullish state with extended targets printing above, and then faded quickly as those extended targets stopped. The mid-morning transition into a ranging state produced a period of sideways chop that gave little directional conviction, but the PM session changed everything. After the Truth Social headline hit, the MSI rescaled lower several times with extended targets printing below, and SPY dropped sharply, testing the session low of $741.51 before closing at $742.21 down modestly on the day. The session change from bullish in premarket, to ranging mid-morning, to aggressively bearish in the afternoon was a textbook example of why reading the MSI in real time matters more than any pre-session directional bias.
The setups were well-defined across the session. The first came early as extended targets stopped printing above and the rally off the open failed, offering traders a clean short entry as the MSI transitioned away from bullish. The second setup arrived when the MSI rescaled into a ranging state and price consolidated, giving patient traders a defined range to work within before the larger move developed. The third and most significant setup came in the PM session when extended targets printed below and the MSI confirmed the bears were pressing aggressively lower, offering a high-confidence short entry that tracked the sell-off toward MSI support at the session low. All three setups were clear, level-driven, and fully supported by the MSI structure in real time. At minimum it was a 3-for-3 session for traders following the framework. It was a volatile but readable day with substantial setups, all identified through proper context, patience, and flexibility while leveraging the MSI, premarket levels, and market structure rather than forcing trades. The VIX dropped 2.34% to 18.33, a modest decline that reflects a slight easing of fear even as SPY sold off into the close, consistent with the bounce off the session low before the bell. The MSI continues to prove its reliability as the cornerstone of our trading process.
Trading Strategy Based on MSI:
Tuesday has light economic news so the market is likely to move more sideways than trend given the Bearish Trending at the close. But with such a narrow range it is also likely the MSI rescales overnight and a short squeeze ensues which will push price back to test higher levels. The $1.18 MSI spread is about as tight as it gets, and that compression suggests the market is coiling for a larger move rather than continuing in a straight line lower. The bears are likely to maintain some downside pressure, particularly if MSI support at $741.51 gives way, but the lack of extended targets at the close and the extremely narrow width both argue against a clean trending session lower. Traders should approach Tuesday with flexibility and let the MSI do the work rather than forcing a directional bias before the open.
Heading into Tuesday the MSI closed in a Bearish Trending state with a very narrow $1.18 spread. That narrow width means the bears do not have meaningful room to press, and any move away from current levels in either direction is likely to trigger a rescale. The absence of extended targets at the close further tempers conviction for aggressive continuation lower, and traders should watch the overnight session closely for any shift in MSI state that could change the tone before Tuesday's open. $740 to $736 remains an area of heavy support and liquidity below, while $745 represents significant overhead resistance that the bulls need to reclaim with conviction to shift the tone.
Bulls want to see price hold above $741.51 overnight and use it as a base to push SPY back through MSI resistance at $742.69 with conviction. If the MSI rescales into a Bullish Trending state with extended targets printing above, that would signal a meaningful short squeeze is developing and shift the bias toward buying dips to $742.69 as support and targeting $745 and above. Bears want to see $741.51 fail. A clean break below $741.51 with the MSI rescaling into a deeper Bearish Trending state and extended targets printing below would confirm the sellers are pressing the advantage and bring the $740 to $736 support zone into view as the next likely magnet for price.
Within the session, the core strategy is to sell rallies to $742.69 MSI resistance and target $741.51 support below, consistent with the bearish lean coming out of Monday. If price fails at $742.69 and the MSI holds in a Bearish Trending state, that is confirmation to stay with the sellers. If price instead holds above $742.69 and the MSI rescales into a Bullish Trending state, that flip is the signal to shift approach and buy dips back to $742.69 as support targeting levels above. A failed breakdown at $741.51 with price reversing and the MSI rescaling higher is also a high-probability long setup, particularly if extended targets stop printing below as that reversal takes shape. The narrow MSI width means both directions are genuinely in play overnight, and the most dangerous approach is treating Tuesday as a guaranteed continuation of Monday's selling without confirmation from the MSI first.
The long-term bull trend remains intact above $640 and failed breakouts and failed breakdowns continue to offer the highest-probability setups. Remain flexible, avoid trading during Ranging Market States unless a clear failed breakout or breakdown presents itself, and ensure all trades are fully aligned with MSI signals. Providing real-time insights into market control, momentum shifts, and actionable levels, the MSI when integrated with our Pre-Market and Post-Market Reports continues to sharpen execution precision and elevate trade quality. If you haven't yet integrated MSI and our model levels into your process, now is the time. Contact your representative to get started as these tools are designed to support consistency and enhance performance.
Dealer Positioning Analysis
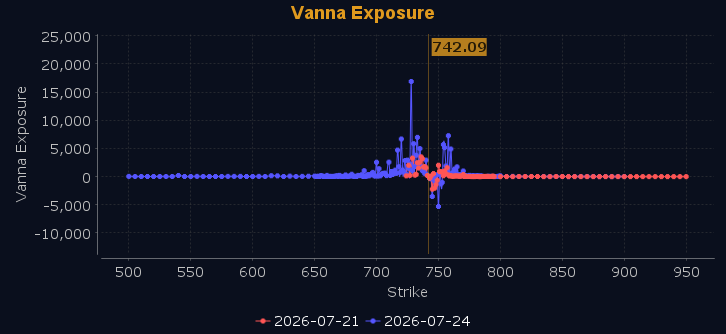
Dealers are selling SPY $750 to $770 and higher strike Calls while buying $743 to $749 Calls, indicating the Dealers' desire to participate in any relief rally on Tuesday. The ceiling for Tuesday appears to be $750, where resistance at $745 will need to be cleared first before prices can reach that level — once $745 is taken out, the path to $750 opens up. SPY is sitting just below the 50 DMA, and a retest of recent lows from here could actually lead to a rapid recovery absent any external catalysts. To the downside, Dealers are buying $742 to $690 and lower strike Puts in a 4:1 ratio to the Calls they're selling, displaying significant concern that prices could move lower. The range for Tuesday is expected to narrow slightly, which may lead to choppy, grinding price action rather than a clean directional move. Below $743 is bearish and above $750 is bullish, with heavy chop and traps in between. Notably, there is strong support built up from $735 to $740, which should keep prices from falling much further if the market loses ground. Dealer positioning is unchanged at neutral/slightly bearish.
Looking Ahead to Next Friday:
Dealers are selling SPY $751 to $778 and higher strike Calls while buying $743 to $750 Calls, indicating the Dealers' desire to participate in any rally this week, though they remain hedged heading into earnings season — albeit with slightly reduced hedge size compared to last week. The ceiling for this week appears to be $758, with resistance at $745 likely to slow any advance before that level, though once $745 is cleared, higher prices should follow. To the downside, Dealers are buying $742 to $685 and lower strike Puts in a 4:1 ratio to the Calls they're selling, displaying notable concern that prices could move lower. Support sits at $740 and again at $735 if the market loses ground. We advise traders to remain bullish above $749, but below $745 the bias shifts bearish, with the range in between full of chop and traps. For the week Dealer positioning has changed from bearish to bearish but less so. We advise reviewing Dealer positioning daily for directional clues. These positions evolve quickly and tracking them is essential for staying ahead of shifting market sentiment.
Recommendation for Traders
With SPY closing at $742.21 and the 10-year yield holding above 4.600, the bias remains cautiously short. Watch $741.51 as near-term support — a break below opens the door to a deeper pullback, while failed bounces toward $747–$748 offer cleaner short entries with stops above $748.73.
Size positions appropriately given near-average volume and a VIX at 18.33 — conditions can shift quickly. Review the premarket analysis posted before 9 AM ET for any changes in the model's outlook and Dealer Positioning.
Good luck and good trading!
