Market Insights: Wednesday, July 1st, 2026
Market Overview
Stocks kicked off the third quarter on a sour note Wednesday, with the S&P 500 slipping 0.2% and the Nasdaq dropping 0.6% as semiconductor stocks pulled back. The Dow dipped below the flatline after its fresh record-high close from the day before. Markets did bounce off their session lows after Fed Governor Kevin Warsh spoke at the ECB forum in Portugal — but he didn't hand Wall Street any forward guidance, only reaffirming his commitment to price stability and noting that "prices are too high."
The economic data front added more uncertainty heading into Thursday's June jobs report, which is dropping a day early due to the Fourth of July holiday shutdown. ADP's private payrolls report showed hiring slowed more than expected in June, with just 98,000 jobs added, while Challenger, Gray & Christmas reported employers announced just under 46,000 job cuts last month, down slightly from a year ago. Adding to the gloom, the Qatar peace talks hit a wall after Iran said its delegates wouldn't meet with President Trump's team, dashing hopes for a quick resolution on oil flows — and sending crude prices down about 1%, with Brent falling below $72 and WTI slipping below $69.
SPY Performance
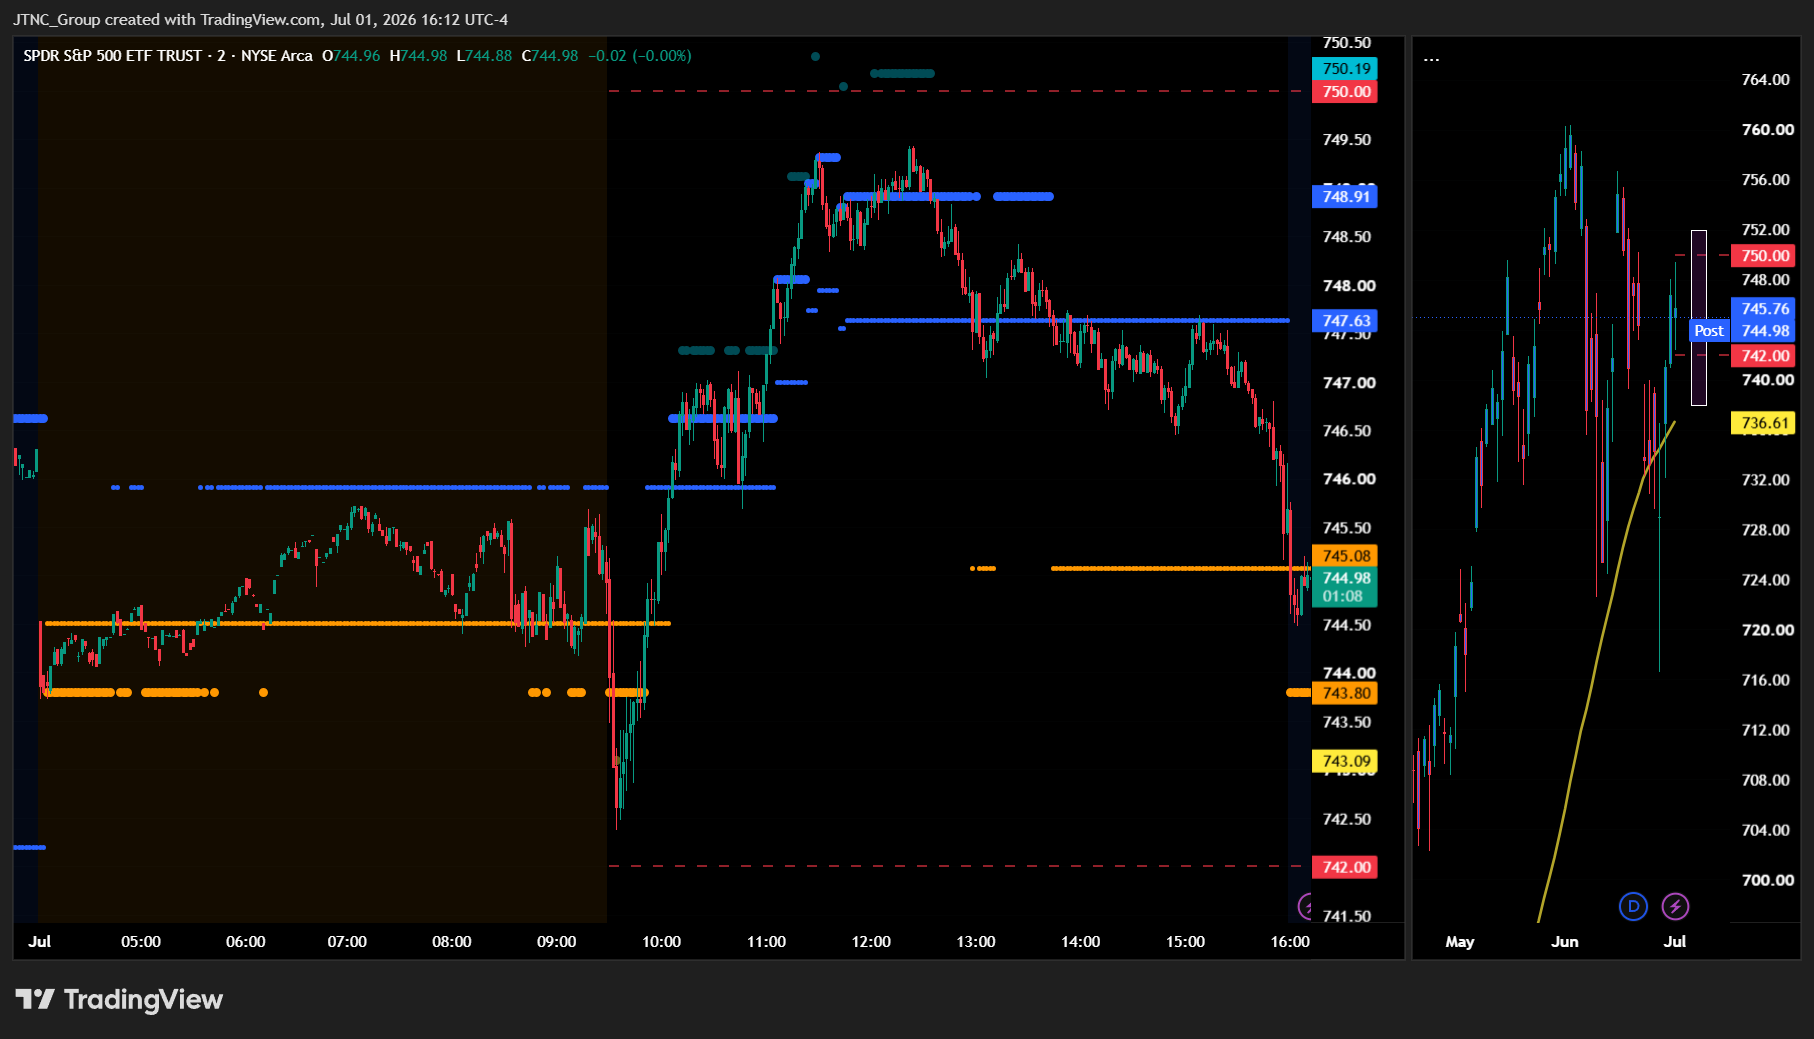
SPY opened at $745 and spent most of the session in a relatively tight range, with the low of $742.38 getting tested mid-session before buyers showed up to defend the downside. The high of $749.43 was tagged but couldn't hold, and that failure to sustain momentum above the prior day's close tells you something — the bulls are still in control, but they're taking a breather after two consecutive days of solid gains. When a market stalls after a run like that, it's not necessarily a red flag. Sometimes consolidation is exactly what a healthy trend needs.
SPY closed at $745.72, a modest decline of 0.14%, which is essentially flat on the day. That's not the kind of close that suggests distribution or a shift in sentiment — it's more of a pause, a market catching its breath. Volume came in at 39.12 million shares, below average, which aligns with the lack of conviction in either direction. There was no aggressive selling, but there wasn't a wave of new buyers rushing in either. The VIX dipped 0.73% to close at 16.33, which is a quiet but meaningful continuation of the volatility compression we've been watching build over recent sessions. Three straight days of VIX declining, even if today's move was small, reinforces that fear isn't staging a comeback here. The market may be digesting, but the underlying tone remains constructive.
Major Indices Performance
The Dow held up the best of the group on the session, barely budging with just a -0.03% decline — essentially flat on the day. That kind of resilience from a value and blue-chip heavy index actually makes sense in a session where growth names were under pressure, as investors tend to find more comfort in the steadier, dividend-paying names when momentum fades. The Dow's composition worked in its favor here, and while flat isn't anything to celebrate, holding the line while other indices sold off is worth noting.
The Russell 2000 came in next, dropping -0.2% on the day. Small-caps have been struggling to find a consistent footing, and today was no different — they didn't crater, but they couldn't shake the modest selling pressure that weighed on the broader market either. When risk appetite softens even slightly, small-caps tend to feel it first, and that pattern held true here.
The Nasdaq bore the brunt of the session's weakness, falling -0.66% and giving back a chunk of the momentum it had been building. That's a meaningful reversal from the prior session when it was leading the entire market higher. The drag came from the growth and tech side of the ledger, where some of the high-flying names ran into selling pressure. The S&P 500 also finished modestly in the red, consistent with a tape where the growth-heavy Nasdaq was the primary source of weakness. When the Nasdaq underperforms by this kind of margin relative to the Dow, it signals the session's selling was concentrated in higher-beta names rather than broadly distributed across the market.
Notable Stock Movements
Meta stole the show today, surging 8.81% to lead what was otherwise a mostly green session for the Magnificent Seven. That's a monster move for a mega-cap name of Meta's size, and it signals real conviction behind the buying — not just a technical bounce. When a stock with Meta's market weight moves that aggressively to the upside, it tends to generate positive spillover across the broader tech complex, even on days when the overall tape is flat or slightly negative.
The rest of the group largely participated in the green, which is a constructive sign even as the major indices drifted slightly lower on the day. The notable exception was NVIDIA, which slid 1.25% to sit at the bottom of the leaderboard. Coming off an extended stretch of heavy investor attention, a pullback like this for NVIDIA isn't alarming on its own — but it's worth watching, especially given how much of the market's AI-driven narrative has been built around the name. A few more soft sessions could start to weigh on sentiment in the broader semiconductor space.
What makes today's Magnificent Seven performance interesting is the divergence from the broader market. The Nasdaq fell 0.66% and SPY barely budged, yet most of the group's heavyweights held their own or pushed higher. That kind of resilience suggests there's still selective appetite for large-cap tech even when overall enthusiasm is muted. The VIX dipped another 0.73% to 16.33, meaning the fear-unwinding trade is still quietly in motion, and that backdrop tends to keep a floor under quality mega-cap names. If Meta can consolidate these gains and NVIDIA steadies itself, the Magnificent Seven remains a group with real momentum underneath it.
Commodity and Cryptocurrency Updates
Crude oil took a notable hit today, sliding 2.07% to close at $68.06 and dropping back below the $70 level that the bulls had been defending. That's a meaningful shift in tone after yesterday's resilience around that critical threshold. Our model has been forecasting crude moving toward $60 for several months, and while it's possible crude continues lower from here, if black gold can hold above $56, a rally back toward $70 remains very much in play. For now, the bears have the momentum, and the energy sector will need to find a reason to stabilize before the long side becomes compelling again.
Gold had a solid session, climbing 0.79% to close at $4,055 and continuing to build on its already historic run. After yesterday's near-flat finish, today's move higher is a reminder that dip buyers are still active and the macro backdrop — uncertainty, inflation concern, and geopolitical noise — remains a tailwind for the yellow metal. Institutional demand continues to look firm, and nothing in today's price action suggests the long-term setup is deteriorating.
Bitcoin flipped the script on yesterday's bearish close, posting a 2.21% gain but still finishing below $59,850. The move is encouraging for crypto bulls after the recent struggle to reclaim meaningful ground, but the fact that it's still sitting below $60,000 means the key psychological level hasn't been convincingly retaken. Progress, yes — but until Bitcoin can punch through that level and hold it, cautious optimism is still the right posture here.
Treasury Yield Information
The 10-year Treasury yield jumped 2.36% on the day, closing at 4.470%. That's a notably sharper move than yesterday's 1.05% climb, and the back-to-back sessions of rising yields are starting to tell a story worth taking seriously. The silver lining is that 4.470% still sits technically below the 4.5% threshold — the line where yields begin to actively pressure equity valuations — but the margin of safety is now razor thin at just 3 basis points. Today's muted equity session, with all major indices closing slightly in the red, reflects exactly the kind of hesitation you'd expect from a market that can see that level in its rearview mirror.
The framework matters here. Below 4.5%, equities still have room to maneuver, but the closer yields press against that ceiling, the more cautious institutional money becomes. A sustained close above 4.5% flips the dynamic — growth stocks and rate-sensitive names feel it first, and broad market momentum starts to erode. The next critical level to watch is 4.8%, where historically sellers begin to take control and risk asset repricing accelerates. Above 5%, the equity risk environment deteriorates meaningfully, and at 5.2% the data points to corrections exceeding 20%.
What makes this two-day surge in yields particularly important is the momentum behind it. We've gone from 4.420% yesterday to 4.470% today, and the pace of that move suggests the bond market relief from last week has fully unwound. Any hotter-than-expected inflation print, a surprisingly strong jobs number, or a hawkish shift in Fed communication could be all it takes to punch through 4.5% and change the tenor of this market. The bulls haven't lost control yet, but they're essentially operating without a net right now. Watch that 4.5% line closely — it is the most important number in the market at this moment.
Previous Day’s Forecast Analysis
Yesterday's newsletter projected SPY to trade within a fourteen-point range, with $736 serving as the max downside target and $750 capping the upside. The bias heading into Wednesday was bullish, with Tuesday's close at $746.48 sitting in the upper half of the expected range and the overall tape favoring continuation higher — though the model noted that resistance stacks quickly at elevated levels and the bull case required conviction to play out.
On the levels front, $744 was identified as the defining gate for the session — the major call concentration zone where the next leg higher would get decided. A clean hold above $744 was expected to open $746, then $748, with $749 as the major call wall and $750 as the round-number ceiling carrying the heaviest call interest of the day. To the downside, $742 was the first line to watch, with $741 flagged as the gamma flip zone where selling could accelerate. Below that, $740 was the round-number decision point, $738 was key structural support, and a break there would expose the full move to $736. Positive gamma between $742 and $744 was expected to act as a stabilizing tailwind near the open.
The recommended trading approach called for position sizing in the 85-90% of normal range, with the declining VIX giving traders increased confidence to participate. Long setups were favored near the $744-745 zone targeting $748-749 initially and $751-752 on continued momentum, with stops below $742. Short setups were outlined in the $749-751 zone on a failed breakout, targeting $745-746 and deeper toward $742-743. A clean open above $746.48 with sustained participation was the green light to add long exposure, while a firm break below $744 reopened short entries targeting $741-742. Stop-loss parameters were set in the 1.5-2% range from entry throughout.
Market Performance vs. Forecast
Wednesday's session produced a tightly contained, range-bound tape that validated several of the model's most important structural calls even as price ultimately settled nearly unchanged on the day. SPY opened at $745, right inside the long setup zone the forecast had identified between $744 and $745 as natural intraday support — that level absorbed early pressure and held with precision. Price then pushed higher through the session, tagging a high of $749.43 and reaching directly into the $749-751 short setup zone the model had flagged as the area where an overextended push without a fresh catalyst was likely to stall. That resistance held, sellers reasserted near the top of the expected range, and price faded back to close at $745.72 — a textbook rejection at the structural ceiling the framework had outlined in advance.
What the model got right was the full architecture of the session. The $744 level — identified as the major gate and upside tell — served as both the open and a floor throughout the day, never breaking down decisively even as the low of $742.38 briefly tested the $742 immediate support level the forecast had flagged as the first line of defense. That low held close enough to the model's $741 gamma flip zone to confirm the structural support thesis without triggering the accelerated selling scenario. On the upside, the $749 major call wall absorbed the session high of $749.43 with remarkable precision, demonstrating that the options-driven resistance levels the model identified were live and actionable. Risk management protocols on short entries near $749-751 with stops above that zone protected capital through the session's gyrations, and the fade from the top played out exactly as the short setup described. The model does not account for unpredictable external developments that can introduce noise into otherwise well-structured sessions, but Wednesday needed no such caveat — the tape respected the framework at nearly every decision point. The VIX easing another 0.73% to 16.33 continues to extend the volatility compression narrative the model has been tracking, and that persistent drift lower in fear premium keeps the structural backdrop constructive as the framework refines its edge heading into Thursday.
Premarket Analysis Summary
The premarket analysis posted at market open identified SPY spot at $745 sitting in a negative gamma pocket, opening the second half of the year in a call-dominated environment following the prior session's month-end consolidation. The defining gate was set at $747, flagged as the immediate level where positive gamma would firm up decisively and flip the structure constructive. Targets above mapped out $748 as the heaviest concentration zone of the day, $750 as the critical round-number pivot and major call wall, $751 as the next decision point above that, and $752 capping the expected move as max upside. On the downside, $744 was identified as the immediate trigger — a clean loss of that level was flagged as the door-opener to lower prices given the negative gamma environment below. Below $744, $743 was labeled the zone where selling could accelerate, with $742 as the next decision point, $740 as the round-number point of last hope holding significant put interest, and $739 marking the bottom of the expected move as max downside. The analysis characterized the setup as a market balanced on the flip, warning to expect choppy two-way action until price committed one way or the other.
The actual session delivered exactly that choppy, two-way action the analysis anticipated. SPY opened right at spot, pressed lower to a session low of $742.38, slicing through $744 and reaching into the $742 decision point zone the analysis had mapped. The bulls stepped in there and reversed the tape, pushing back up through $744 and eventually tagging a high of $749.43, which cleared $748 and briefly tested the space toward $750. However, price could not hold those gains, and the close at $745.72 landed right back inside the negative gamma pocket between $744 and $747 — neither bull nor bear committed decisively. VIX dropping 0.73% to 16.33 reflected modest improvement in sentiment, but the session was ultimately inconclusive, respecting both the downside trigger and the upside targets without confirming a directional break.
Validation of the Analysis
Today's session opened exactly where the premarket placed spot — $745.00 — and immediately confirmed why the analysis flagged the negative gamma pocket around current price as the setup to watch. The premarket warned that 744 was the immediate downside trigger and that losing it cleanly would open the door lower, and SPY tested that thesis within the session, sliding to a low of $742.38. That dip sliced through both the 744 trigger and the 743 acceleration level the analysis called out explicitly, touching 742 — a level named as the next decision point after 743 gave way. The precision there was notable: the session low landed almost exactly on the 742 print, which the premarket identified as a key pivot before 740 came into play. That 740 level never had to be tested because the market found its footing right at 742, exactly where the framework said support could emerge.
On the upside, the premarket identified 747 as the immediate gate and the level that needed to be reclaimed to flip the structure constructive, with 748 sitting just above as the heaviest concentration zone of the day. SPY pushed through 747 and drove to a session high of $749.43, cracking right into that 748 call wall zone and briefly pushing beyond it — rewarding any trader who used the 747 reclaim as a long trigger. The close at $745.72 pulled back inside the negative gamma pocket, which is consistent with the premarket's description of choppy two-way action in that zone. The full range of the session — from the 742 decision point low to the 748-plus concentration zone high — was mapped out before the open, giving traders a clear playbook on both sides. VIX dropping 0.73% to 16.33 added quiet confirmation that despite the intraday volatility, the broader tape wasn't deteriorating. Low at 742, high through 748 — both levels were on the chart before the first trade printed.
Looking Ahead
Thursday is the big one. The July jobs report drops all at once — Non-Farm Payrolls, Average Hourly Earnings, and the Unemployment Rate hitting the tape simultaneously in what amounts to the single most market-moving data release of any given month. NFP tells you the raw strength of the labor market, Average Hourly Earnings gives you the inflation read embedded in wages, and the Unemployment Rate confirms whether the consumer has the income base to keep spending. A strong number across all three could reignite rate-hike fears and send yields spiking, while a soft or mixed report might give bulls the cover they need to push equities higher on rate-cut optimism.
Given how much is riding on Thursday's release, positioning heading into the session matters enormously. Markets will be on edge, bid-ask spreads may widen around the number, and the initial move can be violent and fast before price finds its footing. Know your levels, keep your size disciplined, and don't chase the first reaction — the second move after the dust settles is often the one worth trading.
Market Sentiment and Key Levels
The directional picture today tilts slightly toward the bears, but only slightly — this was more of a pause than a breakdown. SPY shed just 0.14% on the session, closing at $745.72 after spending most of the day in a tight, indecisive range. The fact that price couldn't hold meaningful gains despite a mostly green Magnificent Seven session tells you the broader market is wrestling with mixed signals right now. That said, the VIX dropping 0.73% to 16.33 keeps the fear gauge at a comfortable level, and volatility this contained doesn't scream danger — it suggests the market is digesting recent moves rather than unraveling. Below-average volume at 39.12M reinforces that read — this wasn't a conviction sell, it was a low-energy drift.
Key resistance sits at $749.43, today's intraday high. SPY closed well below that level, meaning bulls couldn't sustain the push and left that ceiling intact. A clean break above $749.43 on stronger volume would be a meaningful development and could spark the next leg higher. On the downside, $742.38 is the support number to watch — that's where today's low held, and as long as SPY respects that floor, the bulls haven't lost structural control. A break below $742.38 on heavy selling would be a more serious warning sign and could invite follow-through pressure toward lower levels. From a cross-asset perspective, gold advancing 0.79% to $4,055 adds a mildly defensive tone, while Bitcoin climbing 2.21% to close just below $59,850 injects a small dose of risk appetite into the mix. The 10-year yield ticking up to 4.470 is worth keeping an eye on, as any continued upward drift in rates could weigh on sentiment. Bulls still have a case to make, but they need to show up with volume and clear $749.43 to regain the upper hand.
Expected Price Action
Thursday's session presents actionable intelligence generated by our AI model, with SPY projected to trade within a range defined by $739 on the downside and $752 as the max upside target. That thirteen-point window signals the market will trend rather than consolidate, and with Wednesday's close at $745.72 sitting right in the middle of the expected move, the bias is essentially neutral heading into Thursday — with the key question being whether bulls can reclaim the $747 gate or bears take control below $744.
The defining level heading into Thursday is $747, which the model identifies as the immediate upside gate where positive gamma firms up decisively and the structure turns constructive. A clean reclaim of $747 opens $748 as the next resistance decision point, where the heaviest call concentration of the session sits. Above there, $750 marks the critical round-number pivot and major call wall — that level will not give way without a serious commitment from buyers. If momentum carries through $750, $751 is the next battleground before $752 caps the expected move as max upside. On the downside, $744 is the immediate trigger to watch — that's sitting right below Wednesday's close and losing it cleanly opens the door lower in a hurry. Below $744, the model flags $743 as a zone where selling could accelerate, followed by $742 as the next decision point. A breakdown through $742 puts $740 in play as a round-number support level carrying significant put interest and serving as the point of last hope. Losing $740 opens $739, the model's line in the sand as max downside. With VIX easing to 16.33, fear remains subdued and the negative gamma pocket sitting between $744 and $747 sets up choppy two-way action near the open — but $747 is the upside tell and $744 is the downside trigger that will define Thursday's directional commitment.
Trading Strategy
The VIX dropping 0.73% to 16.33 continues to paint a calm backdrop for market participants, nudging volatility even lower than the prior session and reinforcing that fear remains subdued at current levels. At 16.33, the options market is pricing in minimal near-term turbulence, which is a constructive signal for traders willing to work defined setups. That said, the muted daily swing combined with below-average volume suggests conviction was thin in both directions, so position sizing should remain measured — around 80-85% of normal is appropriate here until the tape shows cleaner directional follow-through. Discipline on entries and stops is especially important in a low-range, low-volume session like this one, where false moves are more likely to shake out undisciplined positions before the real trend asserts itself.
Long setups are worth watching near the $742-743 zone, which represents yesterday's intraday low and a logical area where dip buyers would step in on any early morning weakness. Entries in that range carry an initial profit target of $746-747, with a secondary push toward $749 if buying pressure picks up meaningfully. Stops on longs belong below $741 to keep risk clean against a deeper breakdown. In a rising market scenario, a sustained push above $747 on improving participation opens the door to add exposure, targeting $749-750 on the first leg and potentially $752 if the move draws in fresh buyers, with stops trailed up to $745 to lock in gains as the trade develops.
Short setups look attractive in the $749-750 zone, where the session's high of $749.43 creates a well-defined resistance ceiling that sellers defended once already. A failed re-test of that level without a clear catalyst is a compelling fade setup, with initial downside targets at $745-746 and a deeper pullback toward $742-743 if selling gains traction. In a declining market scenario, a firm and sustained break below $744 reopens short entries targeting $741-742, with stops placed above $746. With the VIX at 16.33, keep stop-loss parameters in the 1.5-2% range from entry, respect the low-volatility environment by not expecting large intraday swings, and stay patient — the best setups in a choppy, low-volume tape come from letting price arrive at your level rather than chasing moves that have already extended.
Model’s Projected Range
SPY's projected maximum range for Thursday is $738 to $752, with the Call side dominating in an expanding band that suggests trending price action with intermittent chop. Thursday brings Average Hourly Earnings m/m, Non-Farm Employment Change, and Unemployment Rate — a full NFP release that is likely to produce significant volatility particularly in the first hour of trading. SPY closed at $745.72, down 0.14% on the session, with an intraday range from $742.38 to $749.43 off an open at $745, a relatively tight and indecisive day with volume coming in below average. SPY is trading near our model's first support at $745, and the market continues to digest a broader macro backdrop of resilient economic data keeping rate-cut expectations in check. If SPY can push through resistance at $749, the next target becomes $750, while a break below $745 opens the door to $740. Absent a catalyst, resistance sits at $749, $750, $752, $755, while support rests at $745, $740, $738, $735. The long-term bull trend remains intact above $640 with SPY well above structural support. As long as price holds above key structural levels, this remains a broader dip-buying environment. We favor buying dips at $745 given SPY closed right at that first model support with the Call side still in control of the range. Bitcoin posted a solid gain of 2.21% though it closed below $59,850, while MAG stocks were mostly green across the board led by Meta surging up to 8.81%, with NVIDIA being the notable laggard slipping as much as -1.25% — the strength in crypto and most of the Mag names supports the broader bullish tone even with NVIDIA dragging its feet. The VIX closed at 16.33, down 0.73%, suggesting the market is not pricing in excessive fear heading into the NFP print, though traders should stay nimble given how quickly that can change on a hot or cold jobs number. SPY closed near the middle of its trend channel, with structural support holding in the $742 to $745 zone keeping the broader uptrend intact.
Market State Indicator (MSI) Forecast
Current Market State Overview:
The MSI ended in a Bearish Trending Market State with SPY closing at $745.72. Since SPY closed inside the MSI range, $745.08 remains support and $747.63 remains resistance heading into Thursday. Extended targets were not printing at the close, a signal that while bears have asserted control, the downside conviction is limited and price is more likely to grind sideways to lower rather than trend sharply in either direction. Extended targets were active during the AM session, printing above as price pushed higher off the open, but they stopped printing ahead of the PM session, and the MSI transitioned to Bearish Trending as sellers took over and held that state into the close.
The MSI rescaled lower overnight into a narrow bearish state but without extended targets, price had no real downside follow-through. At the open the MSI was in a Ranging state, which briefly flashed price toward the lows of the day right after the bell, but extended targets never confirmed the move lower, and instead the MSI held its overnight narrow bearish structure. SPY reversed hard off MSI support, rallied through the transition, and continued pushing higher as the MSI rescaled several times higher with extended targets printing above during the AM session. SPY pushed close to $750 before stalling right around the time extended targets stopped printing, and the rest of the day was a steady rollover with the MSI rescaling lower several times through the PM session as sellers reasserted control and the Bearish Trending state held into the close. The VIX dropped 0.73% to 16.33, a modest compression in fear that offers little additional tailwind for bulls given the bearish MSI close. The MSI is forecasting a slow grind lower for Thursday, though without extended targets at the close the downside may be limited and price is likely to find support at key levels below. MSI support is $745.08 with resistance at $747.63.
Key Levels and Market Movements:
Tuesday we stated, "Bulls want to see overnight price hold above $742.2 MSI support and use that level as a launching pad to press SPY back toward $746.62 resistance and ultimately through it, with the extended targets above acting as the next guide once the MSI resistance is cleared," and added, "Any rally that stalls and reverses near $746.62 is a potential shorting opportunity targeting $742.2 support below, while any dip that stabilizes and bounces cleanly at $742.2 is a high-probability long entry targeting the extended target levels printing above," while also noting, "If the economic data shifts sentiment sharply and the MSI rescales lower out of its current Bullish Trending state, traders must follow that signal immediately and adjust without hesitation rather than anchoring to the prior session's bullish structure."
Wednesday delivered a textbook example of what the MSI framework is designed to catch — a session with two distinct and clearly readable halves that rewarded patient, disciplined traders on both sides of the tape. Premarket showed no extended targets, offering an early caution signal that the prior session's bullish momentum might not carry cleanly into the open. SPY opened at $745 and the MSI was in a Ranging state, which immediately sent price flashing toward the session low of $742.38 right after the bell. But without extended targets confirming the downside, that breakdown never had legs, and traders who waited for confirmation rather than chasing the flush were rewarded almost immediately. SPY reversed hard off that low, reclaimed MSI support, and began a steady grind higher as the MSI rescaled several times higher with extended targets printing above through the AM session — exactly the environment that produces clean, repeatable long setups. Each rescale higher gave bulls a fresh support level to defend and a clear target above, with extended targets guiding price upward toward $749.43, the session high, just below the $750 overnight ceiling.
The tell that the AM move was exhausting itself came from the MSI itself — extended targets stopped printing above, and almost immediately the rally stalled and reversed. That transition was the pivot point of the session. Once the MSI began rescaling lower through the PM session and locked into a Bearish Trending state, the framework flipped its bias just as cleanly. Rallies back toward MSI resistance at that point became shorting opportunities, and each new lower MSI support level established by successive rescales gave bears a fresh target to press toward. SPY closed at $745.72, a modest loss of 0.14% on below-average volume of 39.12 million shares, but the intraday range from $742.38 to $749.43 gave the MSI framework plenty of room to work on both sides. At minimum it was a 4-for-4 session for traders following the framework. It was a volatile but readable day with substantial setups, all identified through proper context, patience, and flexibility while leveraging the MSI, premarket levels, and market structure rather than forcing trades. The MSI continues to prove its reliability as the cornerstone of our trading process.
Trading Strategy Based on MSI:
Thursday has heavy economic data with Average Hourly Earnings, Non-Farm Employment Change, and the Unemployment Rate on the calendar, which can introduce significant volatility, so traders should be ready to trade what they see rather than predict. That said, the Bearish Trending MSI with no extended targets at the close sets a modest bearish structural bias heading into Thursday. The moderate spread of $2.55 gives price a defined but not particularly wide range to work within, and the absence of extended targets at the close suggests that while bears have a slight edge, the downside is unlikely to be aggressive without a catalyst to ignite real selling pressure. The jobs data has the potential to be exactly that catalyst — a hot number could spark a relief rally while a weak print could finally give bears the extended targets they need to press price meaningfully lower. Traders should stay patient, let the data land, and follow the MSI signal rather than front-running a direction.
Bulls want to see overnight price hold above $745.08 MSI support and use that level as a base to push back toward $747.63 resistance and attempt to flip the MSI out of its Bearish Trending state. If bulls can reclaim $747.63 with conviction and the MSI rescales into a Bullish Trending or Ranging state with extended targets printing above, the complexion of Thursday changes quickly and the slow grind lower thesis gets shelved. A strong jobs report could be the spark that drives that reversal. Bears want to see $745.08 fail to hold as support and press price toward the premarket levels below, and if that level gives way on a weak jobs report or disappointing earnings data, the MSI could rescale lower and finally produce the extended targets needed to confirm a more sustained leg down. Any rally that stalls and reverses near $747.63 resistance is a potential shorting opportunity targeting $745.08 support and the levels below it, while any dip that stabilizes and bounces cleanly at $745.08 is a reasonable long entry targeting $747.63 resistance, though traders should require more confirmation in a Bearish Trending state before leaning long.
Given the Bearish Trending state with a moderate spread and no extended targets at the close, the path of least resistance is modestly lower, but the downside is capped without extended targets confirming the move. Selling rallies to $747.63 MSI resistance is the primary setup for Thursday, targeting $745.08 support and the premarket levels below it. Failed breakouts at $747.63 are the highest-probability short entries in this environment. If the jobs data shifts sentiment sharply and the MSI rescales higher out of its Bearish Trending state, traders must follow that signal without hesitation and adjust their bias to match what the framework is telling them rather than anchoring to the bearish overnight structure. The MSI will tell traders everything they need to know in real time — trust that signal above all else.
The long-term bull trend remains intact above $640 and failed breakouts and failed breakdowns continue to offer the highest-probability setups. Remain flexible, avoid trading during Ranging Market States unless a clear failed breakout or breakdown presents itself, and ensure all trades are fully aligned with MSI signals. Providing real-time insights into market control, momentum shifts, and actionable levels, the MSI when integrated with our Pre-Market and Post-Market Reports continues to sharpen execution precision and elevate trade quality. If you haven't yet integrated MSI and our model levels into your process, now is the time. Contact your representative to get started as these tools are designed to support consistency and enhance performance.
Dealer Positioning Analysis
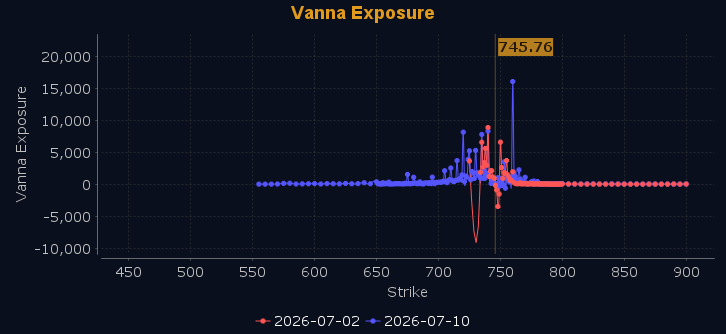
Dealers are selling SPY $749 to $776 and higher strike Calls while buying $746 to $747 Calls, indicating the Dealers' desire to participate in any rally on Thursday. The ceiling for Thursday appears to be $750. To the downside, Dealers are buying $745 to $670 and lower strike Puts in a 3:1 ratio to the Calls they're selling, displaying moderate concern that prices could move lower. Notably, Dealers are no longer selling ATM Puts, which tells us the floor that held today is no longer being defended heading into Thursday. There is a heavy wall of resistance at $750 with little support below, making the zone between $738 and $749 a wide range of chop — especially heading into the long weekend. Below $738 is bearish and above $749 is bullish. Dealer positioning is unchanged at neutral/slightly bearish.
Looking Ahead to Next Friday:
Dealers are selling SPY $753 to $780 and higher strike Calls while buying $746 to $752 Calls, indicating the Dealers' desire to participate in any rally heading into the end of next week. The ceiling for the week appears to be $753. To the downside, Dealers are buying $745 to $660 and lower strike Puts in a 3:1 ratio to the Calls they're selling, displaying moderate concern that prices could move lower. Dealers are no longer selling ATM Puts, confirming they are not committing to a floor at this time. Worth noting, Dealers have been flip flopping their hedges at key levels including $752, $749, $742, and $739, which signals real uncertainty about what follows next week — they appear hedged for any outcome, and we recommend traders do the same. We remain bullish above $746 but bearish below $745. For the week Dealer positioning is unchanged at neutral/slightly bearish. We advise reviewing Dealer positioning daily for directional clues. These positions evolve quickly and tracking them is essential for staying ahead of shifting market sentiment.
Recommendation for Traders
With SPY closing at $745.72 and VIX easing to 16.33, the tape is holding up despite modest broad-market weakness. Watch $742.38 as your key intraday support — a hold there keeps cautious long setups viable, while a break below opens the door for shorts. Stay selective and keep stops tight given the below-average volume backdrop.
Risk management is everything in a choppy, low-conviction session like this one. Size positions accordingly and don't chase extended moves in either direction. Review the premarket analysis posted before 9 AM ET for any changes in the model's outlook and Dealer Positioning.
Good luck and good trading!
