
Market Insights: Friday, July 17th, 2026
Market Overview
Stocks closed out the week on a sour note Friday, with the major indexes posting meaningful weekly losses as the semiconductor sector took center stage for all the wrong reasons. The Dow fell 0.7%, the S&P 500 dropped 1%, and the Nasdaq shed 1.4% on the day. For the week, the S&P 500 lost more than 1.5%, the Nasdaq gave back 2.9%, and the Dow dropped nearly 1% over five sessions. The chip sector was the story, as the PHLX Semiconductor Index officially entered bear market territory, though it did manage to close off its lows as dip buyers stepped in late in the session.
The AI trade continued to face headwinds as Chinese startup Moonshot unveiled Kimi K3 on Friday, claiming it's the world's largest open AI model and a direct rival to Anthropic's frontier Fable model — adding another layer of anxiety to an already nervous market grappling with massive AI spending and uncertain returns. Netflix didn't help the mood either, tumbling 7% after its third quarter revenue forecast came in below expectations, with management citing a "dynamic and competitive" entertainment landscape. On the earnings side, smaller banks Truist Financial and Fifth Third Bancorp wrapped up the week's reporting calendar, while the University of Michigan's preliminary consumer sentiment reading offered a bright spot — Americans are starting to feel better about the economy as gas prices ease.
SPY Performance
SPY opened at $742.08 and never really gave bulls a reason to get excited, grinding sideways early before the sellers gained control and pushed the tape toward the lows. The high of $747.29 came and went quickly, and from there the session turned into a slow bleed that kept pressure on anyone trying to defend support. Price bottomed at $740.80 before stabilizing slightly into the close, but the overall tone was one of continued distribution — not panic, but persistent and purposeful selling that left bulls with very little to work with.
SPY closed at $743.15, down 1.01%, extending the losing streak and making it clear the bears are still firmly in the driver's seat. Volume came in at 52.96 million shares, near average, which means there was genuine participation behind the move and not just a low-conviction drift. The fact that sellers showed up with real conviction on another down day is difficult to dismiss. Adding to the concern, the VIX surged 9.98% to close at 18.40, building on yesterday's 9.64% spike and now stringing together back-to-back fear readings that suggest this isn't just noise. Two consecutive days of VIX expansion paired with volume-backed selling is the market telling you in plain language that uncertainty is rising and the bulls haven't found a floor worth trusting yet. The recovery thesis is fading fast, and the burden of proof is squarely on the bulls to step up before this slide picks up any more steam.
Major Indices Performance
The Nasdaq led the declines on the day, dropping 1.4% as growth and tech names bore the brunt of the selling. It's a familiar story — when momentum names come under pressure, the Nasdaq absorbs the damage faster and deeper than anywhere else, and today was no exception. The index continues to be the most sensitive barometer of risk appetite in the market, and another session like this one keeps the pressure squarely on growth investors.
The Russell 2000 held up slightly better in relative terms but still finished down 0.45%, which is a story of small-caps once again failing to carve out their own path when sentiment turns sour. There's no institutional floor under these names the way there is with the mega-caps, and that vulnerability shows up in sessions like today. The small-cap index remains one of the more frustrating corners of the market — it rarely leads on the upside and tends to participate fully on the downside.
The Dow fared the best of the major averages, declining 0.77%, as the blue-chip index's tilt toward dividend-paying, defensive-oriented names helped cushion the blow. The S&P 500 also finished in the red on the session. The spread between the Nasdaq and the Dow — roughly 0.63 percentage points — tells you this wasn't a uniform selloff across the board. Growth bore the weight while the more value-oriented, defensive names held up with considerably more composure, and that rotation dynamic is something worth watching as the broader tape tries to find its footing.
Notable Stock Movements
Meta took the hardest hit in the Magnificent Seven today, dropping 2.79% to lead the group lower in what was a mostly red session for the cohort. That's a meaningful single-day move for a mega-cap name, and it carried enough weight to set the tone for the broader group. When one of the most advertising-dependent businesses in the world sells off with that kind of conviction, it raises questions about whether investors are reassessing growth expectations for digital platforms or simply trimming exposure to high-multiple names in a choppy tape — neither reading is particularly encouraging heading into the next session.
The rest of the Magnificent Seven largely followed Meta's lead to the downside, with Apple standing out as the notable exception by managing to close green. That's a meaningful distinction — seeing the most defensively positioned name in the group hold its ground while the more growth-sensitive names absorbed the bulk of the selling suggests investors were finding relative safety within the cohort rather than exiting it entirely. Still, a group that's mostly red with the biggest mover down nearly three percent is not a group that's offering much in the way of market leadership on an already difficult tape.
The Magnificent Seven's rough session fits cleanly with the broader risk-off tone that played out across markets today. The Nasdaq's 1.4% decline confirmed that growth and technology names were under genuine pressure, and the VIX surging 9.98% to 18.40 reflects the kind of volatility expansion that tends to weigh heaviest on high-multiple names. Apple deserves credit for holding the line, but Meta's outsized drop was the defining story for the group, and it's the kind of move that warrants close attention in the sessions ahead.
Commodity and Cryptocurrency Updates
Crude oil surged 3.14% today, closing at $81.43, and the move higher is impossible to ignore. That's a significant single-session push that puts crude even further above $70 and well into territory that complicates the Fed's inflation-fighting narrative. Energy prices at this level don't exist in a vacuum — they feed directly into transportation costs, manufacturing inputs, and eventually consumer prices, which means every dollar crude stays elevated near $80 gives the Fed one more reason to hold rates higher for longer. Geopolitical pressures and supply dynamics continue to drive the bid, and nothing in today's session suggests that pressure is about to ease. A sustained stay above $80 keeps rate cut expectations firmly off the table.
Gold bounced back in a meaningful way, gaining 0.86% to close at $4,020. That reclaim of the $4,000 level is exactly what gold bulls needed to see after yesterday's technical break below that key floor. One session doesn't erase the concern entirely, but closing back above $4,000 is a statement. The core drivers — central bank accumulation, geopolitical uncertainty, and a complicated global rate environment — remain fully intact, and today's recovery suggests the dip buyers were ready and waiting just below that level.
Bitcoin added a quiet 0.37% today, closing above $64,027. The move is modest but constructive — the crypto continues to hold comfortably above the $60,000 floor that bulls have been defending, and today's calm session suggests no real distribution is taking place. With broader equity markets under pressure, Bitcoin's resilience here is worth noting. The intermediate-term setup remains intact as long as that $60,000 level holds.
Treasury Yield Information
The 10-year Treasury yield edged lower on the session, falling 0.61% to close at 4.540%. It's a small move in the right direction, but context matters here — yields are still sitting above the critical 4.5% threshold where equity headwinds become a daily reality. One down day does not a trend make, and after the prior session's snapback higher, the bond market has yet to demonstrate any real conviction that a sustained retreat is underway. The equity market's broad red close today confirms that even a modest dip in yields isn't enough to give bulls the breathing room they're looking for.
Inside the framework, 4.540% keeps the pressure squarely on stocks. We're now 26 basis points from the 4.8% level where selling tends to become more aggressive and sustained, and the path there can close in a hurry on a hot inflation print or any hawkish tone from the Fed. Today's slight decline is the right direction, but without a convincing and sustained break below 4.5%, it doesn't change the fundamental setup. The pattern of brief dips followed by bounces back above the line is exactly what bond bears do not want to see continue.
What bulls need is a clean, multi-session hold below 4.5% that signals genuine momentum in yields. Instead, what we have is a yield level that's hovering just above a key danger zone, refusing to let equity sentiment stabilize. Watch whether this dip has any follow-through in the sessions ahead. A failure to extend lower — or worse, another bounce back toward 4.7% or 4.8% — would put the market right back on defense. The burden of proof still belongs entirely to the yield bears.
Previous Day’s Forecast Analysis
Friday's forecast called for SPY to trade within a fourteen-point range, with $746 as the downside floor and $760 as the max upside ceiling. The model established a bearish bias heading into the session, with Thursday's close at $750.77 sitting in the lower half of the projected range and the tape dominated by negative gamma. The critical battleground identified was $750, where a significant put wall and deep negative gamma were expected to serve as the key decision point — with $751 acting as the first line of defense bulls needed to hold early. A clean breakdown through $750 was projected to open $749 and $748, with $746 as the ultimate floor and a put wall at $745 just beneath. On the upside, $754 was flagged as the immediate gate bulls needed to reclaim convincingly before $755 became viable, where positive gamma would firm up and give buyers a real tailwind. From there, $757 and $759-760 were the next targets in a bull scenario.
The trading strategy leaned short-biased but kept long setups on the table for disciplined traders. The $748-750 zone was identified as a critical support shelf where stabilizing price action could offer tactical long entries targeting $753 and then $754.57, with stops below $747.89. In a rising scenario, reclaiming $752 on improving volume set up a momentum long targeting $755 and $757-758. On the short side, a failed rally into the $752-754 resistance band was the preferred fade entry, targeting $748 first and then $745-746 if sellers held control. A decisive break below $747.89 opened short entries toward $745 and then $742 on extension, with stops above $750.77. With the VIX at 17.18, the strategy called for trimmed position sizing at 70-75% of normal exposure and wider stop-loss parameters in the 1.5-1.75% range to account for the elevated volatility environment.
Market Performance vs. Forecast
Friday's session delivered a sharply bearish outcome that pushed price action below the model's projected floor, with SPY gapping open at $742.08 — well beneath the $746 downside boundary the forecast had established as the bottom of the expected move. External catalysts drove price action beyond the projected range from the opening bell, and it's important to note that sudden gap-down opens of this magnitude are inherently outside the model's standard inputs — no framework built on options structure and gamma mapping can fully account for overnight developments that reprice the market before a single trade is made.
That said, the forecast's directional bias proved entirely correct. The model leaned bearish heading into Friday, explicitly warned that $751 had to hold early or sellers would press toward $750 and below, and outlined a falling market scenario where a decisive break beneath $747.89 opened the door to further downside. That scenario played out — the bears were firmly in control all session. The short setup framework — specifically the break below $747.89 targeting $745 and then $742 on an extended move — was directionally sound, and risk management protocols protected capital for any trader who respected defined stop parameters and kept size trimmed to the 70-75% range the forecast had explicitly recommended given the elevated VIX environment.
The VIX continued its aggressive climb, rising another 9.98% to close at 18.40, extending Thursday's surge and confirming that the options market's fear repricing was not a one-day event. The forecast had correctly identified the VIX as a meaningful warning signal and urged traders to widen stop parameters and reduce exposure accordingly — that guidance proved its value in a session where oversized positioning would have inflicted real damage. The model's structural map and its emphasis on disciplined, right-sized risk management remain the most reliable navigational tools available, and the framework's ability to identify the correct directional bias and key breakdown levels keeps it essential even when gap risk introduces volatility that exceeds the base case scenario.
Premarket Analysis Summary
The premarket analysis posted at market open identified SPY spot at $745.19 sitting in a put-dominated environment on monthly expiration day, with open interest running roughly ten times a normal session and unusually heavy positioning throughout the chain. The defining gate above was set at $746 — described as the immediate level that needed to be cleared for any structural repair, as well as the heaviest negative gamma strike on the board. Above there, $748 was flagged as the first meaningful target, $750 was identified as the major put wall battleground where resistance would intensify, $751 was designated the flip point where gamma turns positive and buyers regain a tailwind, and $755 served as the max upside and top of the expected move. On the downside, $744 was the first level to watch just beneath spot, with a clean break there confirming sellers' control. Below $744, $743 was flagged as the accelerant level where the negative gamma pocket could drive fast follow-through, $742 was the next decision point, $740 was identified as the point of last hope carrying an enormous put wall, and $735 sat at the bottom of the expected move as the ultimate floor. The analysis explicitly warned that expiration Fridays in deep negative gamma can move violently, and that if $744 failed early there would be minimal cushion until $742.
The actual session validated the downside playbook almost immediately. SPY opened at $742.08, gapping straight through $744 and landing inside the accelerant zone flagged in the premarket framework before the first print was even made. The low of $740.80 tested the critical $740 put wall nearly to the penny, demonstrating exactly the kind of violent downside extension the analysis warned about. The $746 gate was never challenged from below — bulls had no answer — and the session high of $747.29, reached during a brief intraday bounce, stopped right in the area between $746 and $748 before fading. The close at $743.15 confirmed sellers maintained control throughout the session, and the VIX surging 9.98% to 18.40 reinforced the fear-driven, gamma-amplified environment the premarket analysis had clearly anticipated.
Validation of the Analysis
Today's session was a textbook example of the premarket framework doing exactly what it's designed to do — laying out the levels in advance so traders know where price is likely to pause, accelerate, or reverse before the first print ever hits the tape. SPY opened at $742.08, which immediately told the story. The analysis warned that losing 744 cleanly would confirm the sellers' grip, and that's precisely how the day began — not with a test of 744 from below, but with a gap straight through it, opening directly in the danger zone the premarket identified between 743 and 742. The framework specifically said a break of 743 puts 742 in play as the next decision point, and SPY's open at $742.08 landed almost exactly on that level, giving traders who read the premarket a precise anchor right from the bell.
From there, the session played out along the exact lines the analysis drew. The low of $740.80 probed the 740 level — the round-number put wall the premarket called the point of last hope and described as holding an enormous put wall representing major support. That level held, and the bounce off $740.80 was the tradeable moment the framework pointed to in advance. The high of $747.29 reached up toward the 746-to-748 zone, tagging the 746 gate the premarket identified as the immediate resistance and the first requirement for any repair, then stalled right in that zone — exactly the kind of probe-and-reject behavior the analysis anticipated in deep negative gamma. SPY closed at $743.15, settling back in the heart of the 743-to-744 battleground. The VIX surging 9.98% to 18.40 confirmed the elevated put pressure the premarket flagged from the start. Every major move in this session had a named level attached to it before the open — that's the value of the framework.
Looking Ahead
Monday's economic calendar is clean, with no high-impact releases scheduled to kick off the week. That puts the focus squarely on price action and positioning rather than data-driven moves. Traders walking into Monday's session are essentially carrying the narrative from this week — whatever the market made of CPI, PPI, and Fed Chairman Warsh's back-to-back testimonies is the hand everyone plays with heading into the open.
A quiet calendar doesn't mean a quiet tape, but it does mean the market is free to move on its own terms. Without a catalyst to force a reaction, Monday becomes a session where sentiment and technicals do the heavy lifting. If the bulls absorbed the week's data well, expect traders to use the calm to add exposure ahead of what shapes up to be a busier stretch later in the week. If there's still unresolved tension from Warsh's commentary or the inflation prints, a quiet Monday can actually amplify the drift — nothing is coming to reset the narrative, so whatever pressure exists has room to build. Stay disciplined, keep your levels defined, and let the price action tell you what the market actually believes.
Market Sentiment and Key Levels
The directional bias today belongs to the bears, and they pressed their case with enough conviction to make the bulls uncomfortable. SPY fell 1.01% in a session where the intraday high of $747.29 couldn't hold and sellers drove price back down to close at $743.15, well off the day's best levels. The VIX surging 9.98% to 18.40 is the loudest warning signal of the session — that kind of fear gauge expansion in a single day tells you this isn't just routine profit-taking. When the VIX is climbing toward the high teens with that kind of momentum, the market is pricing in real uncertainty, and traders need to respect that. Volume coming in near average at 52.96M gives the selloff enough credibility to take seriously rather than dismissing it as a low-liquidity drift.
Key resistance is now at $747.29, the session high, and SPY would need to reclaim that level convincingly to give bulls any real footing. A strong push back above $747.29 on expanding volume could open the door toward the $750 to $752 area. On the downside, $740.80 — today's intraday low — is the line in the sand. A clean break below that level would be a meaningful technical deterioration and could quickly expose SPY to a test of the $737 to $738 area, which is where things get genuinely uncomfortable. The Nasdaq's steeper 1.4% decline is a yellow flag, since tech tends to lead the broader market in both directions. Gold's 0.86% gain to $4,020 is one of the few constructive reads of the day, suggesting some flight-to-safety rotation is happening, while Bitcoin's modest 0.37% close above $64,027 shows crypto staying relatively resilient. The 10-year yield holding at 4.540% keeps pressure on equity valuations, and any further climb in rates would add more headwind to an already fragile setup. The bears have the edge heading into tomorrow, but a VIX reversal and some yield stability could shift things quickly.
Expected Price Action
Monday's session presents actionable intelligence generated by our AI model, with SPY projected to trade within a range defined by $735 on the downside and $755 as the max upside target. That twenty-point window signals the market will trend rather than consolidate, and with Friday's close at $743.15 sitting in the lower portion of the expected move, the bias leans bearish heading into Monday's open.
The defining level to watch Monday is $746 — that's the immediate gate above and the heaviest negative gamma strike, meaning clearing it is the first requirement for any meaningful recovery attempt. Bulls need to reclaim $746 convincingly before the move toward $748 becomes viable, and above there $750 is where a massive put wall sits and the battle intensifies. The critical threshold for a true structural repair is $751, where gamma flips positive and buyers finally regain a tailwind, with $755 capping the expected move top as the max upside ceiling. On the downside, $744 is the first level to defend — losing it cleanly confirms the sellers' grip and signals the put-dominated tone is in full control. Below $744, selling can accelerate through $743 and into $742 as the next decision point. The model identifies $740 as the point of last hope, where a major put wall provides significant support. A failure there opens the door to $735, the bottom of the expected move and the ultimate floor, where another substantial put wall sits as the final line of defense. With the VIX having surged to 18.40 and the broader tape under pressure heading into the new week, the burden is squarely on the bulls — $744 must hold early or expect a swift and aggressive push toward that $742 to $740 battleground.
Trading Strategy
The VIX surging 9.98% to 18.40 is a clear escalation of fear in the options market, and traders need to respect what that number is telling them. At 18.40, volatility is no longer flirting with discomfort — it's moved into territory where daily swings can become violent and unpredictable, and anyone holding oversized positions is playing with fire. This level of VIX historically signals that institutional hedging is accelerating, and until it shows signs of rolling back below 17, you should treat every setup with added caution. Position sizing should be pulled back to roughly 65-70% of normal exposure, and stop-loss parameters need to be widened to the 1.75-2% range from entry to account for the increased intraday noise that comes with a tape like this.
Long setups exist but require patience and precision. The $740-741 zone, which includes today's low of $740.80, is the first key support shelf to watch. A test of that area on stabilizing volume and improving breadth offers a tactical long entry with an initial profit target at $747, and a secondary target at $747.29 if momentum continues to build. In a rising market scenario, reclaiming $747 with conviction and holding it on a retest sets up a momentum long targeting $750 and then $752-753 on follow-through, with stops placed firmly below $740.80 to protect against a structural breakdown. That session low is the line in the sand — losing it on volume changes the entire short-term picture.
Short setups are the higher-probability plays in this environment given the tone of the session. A failed rally back into the $747-748 resistance band on weak breadth or renewed selling pressure offers a clean fade entry, with downside targets at $743 first and then $740-741 if sellers stay in control. In a falling market scenario, a decisive break below $740.80 on elevated activity opens the door to short entries targeting $737 initially and then $734-735 on an extended move, with stops placed above $744 to keep risk contained. With the VIX at 18.40 and pointing higher, this is not the environment to be stubborn about directional bias — let the key levels trigger your entries, keep size disciplined, and honor your stops without hesitation.
Model’s Projected Range
SPY's projected maximum range for Monday is $735 to $752, with the Put side dominating in an expanding band that suggests trending price action with intermittent chop. Monday brings no economic news due out so the market will trade on technicals. SPY closed at $743.15, down 1.01%, after opening at $742.08, tagging a high of $747.29, and dipping to a low of $740.80 on below-average volume — a session that showed early strength fade into a quiet but negative close. SPY remains in the $740 to $745 range that has defined recent trading, with ongoing trade policy uncertainty continuing to weigh on sentiment at the margins. On the upside, our model shows the first resistance at $745, and a clean break above that level puts $750 in play next — on the downside, the first support sits at $740, and a break below there opens the door to $736, with little to keep price from sliding toward $730 if that level gives way. The long-term bull trend remains intact above $640 with SPY well above structural support. As long as price holds above key structural levels, this remains a broader dip-buying environment. Absent a catalyst, resistance sits at $745, $750, $752, $753, while support rests at $740, $736, $735, $730. Given that SPY closed near the middle of the range but slightly closer to support, we favor buying dips near $740 on any early weakness Monday. Bitcoin edged higher by 0.37% to close above $64,027, showing modest resilience, while MAG stocks were mostly red on the session led by Meta dropping as much as -2.79%, with Apple the lone bright spot finishing up 0.14% — sustained weakness across both leadership groups would be required to signal a deeper pullback. The VIX closed at 18.40, up 9.98%, suggesting elevated fear given the soft tape and cautious positioning heading into the new week. SPY closed just above the lower line of the trend channel, keeping structural support intact for now but leaving the bulls with work to do to reclaim momentum.
Market State Indicator (MSI) Forecast
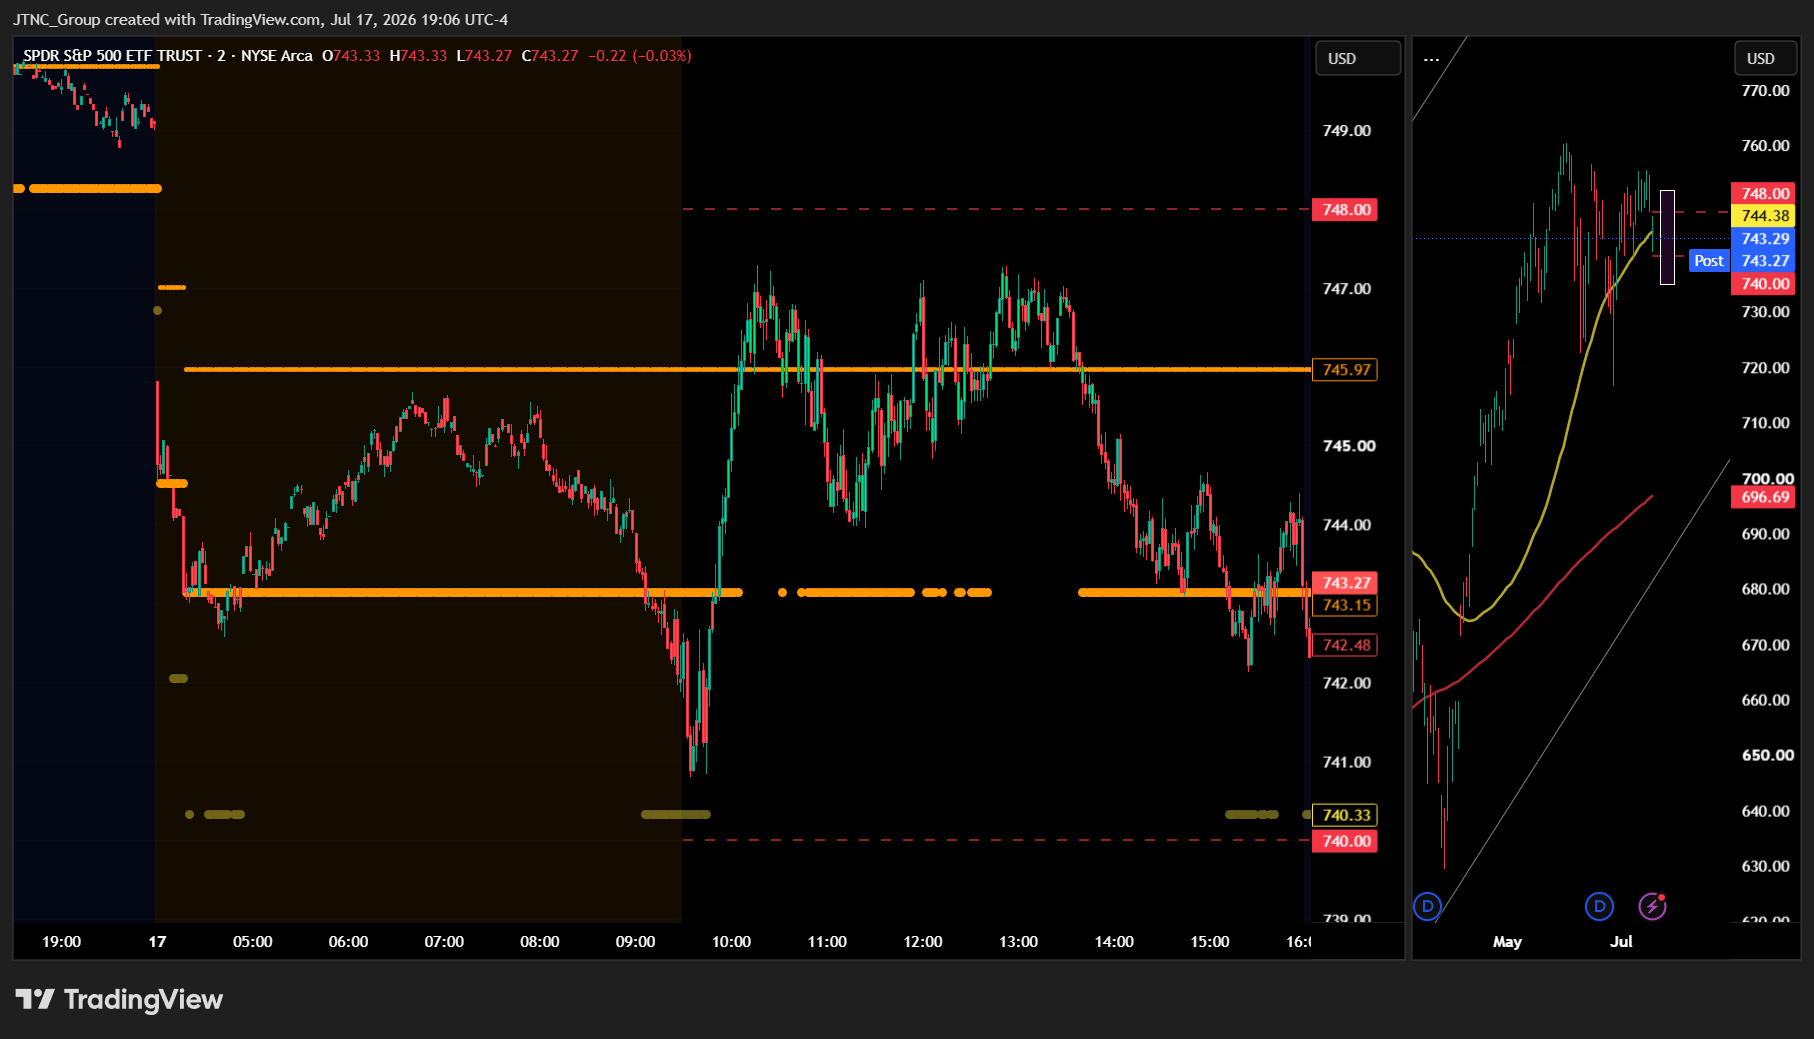
Current Market State Overview:
The MSI ended in a Bearish Trending Market State with SPY closing at $743.15. MSI support at $743.15 holds as support heading into Monday, with resistance at $745.97 above. The MSI width of $2.82 is moderate, and that tells you the bears have enough room to work with but the spread is not so wide that the move feels runaway. Extended targets were not printing at the close, which is an important detail because it suggests the selling pressure, while persistent, did not carry the kind of aggressive momentum into the final hour that would signal a gap-down open on Monday. Extended targets did print below during premarket, the AM session, and the PM session, meaning the bears were in control and actively driving price lower for most of the day. The premarket extended targets were especially telling because they foretold the type of session that would develop before the open even arrived.
The MSI rescaled lower overnight with extended targets printing below, which set the tone early and gave prepared traders a roadmap before the bell. The MSI rescaled just once during the regular session into a ranging state as SPY hovered near $756 through the late morning before the selling escalated and SPY fell through MSI resistance and pressed down to support. That late-session flush was clean and confirmed what the MSI had been communicating all day. The closing MSI range is moderate and the absence of extended targets at the close suggests Monday may see a slow grind lower rather than an aggressive continuation, with the downside likely limited and support at key levels below likely to attract buyers. MSI support is $743.15 with resistance at $745.97.
Key Levels and Market Movements:
Thursday we stated, "Bears want to see $748.26 fail. A clean break below $748.26 with the MSI rescaling into a Bearish Trending state and extended targets printing below would confirm the sellers are pressing the advantage and bring the $746 area into view as the next likely support magnet," and added, "Within the session, the core strategy is to sell rallies to $749.81 MSI resistance and target $748.26 support below, consistent with the bearish lean coming out of Thursday," while also noting, "The moderate MSI width means both directions are in play overnight, so staying reactive to what the MSI is doing in real time is far more valuable than committing to a bias before the open."
That read proved accurate in every meaningful way. The bulls never found footing and the bears delivered exactly the kind of follow-through the MSI had telegraphed. SPY opened at $742.08, briefly pushed up to a session high of $747.29, and then sold off steadily throughout the day, printing a session low of $740.80 before closing at $743.15, down 1.01% on the session. The MSI maintained a Bearish Trending state through most of the day with price grinding toward the lower MSI line, which is exactly the environment where the framework shines. The first setup came in the AM session when extended targets stopped printing below, signaling a short-term exhaustion of seller momentum and offering a clean long entry off the lows. That was a significant win as SPY bounced off the session low and gave traders a tradeable move to the upside. The second setup arrived as SPY failed near MSI resistance and the MSI confirmed the sellers were regaining control, giving traders a high-confidence short entry targeting MSI support below. That 70% trade from resistance to support proved highly accurate, as it has repeatedly throughout this process. Both setups were clear, well-defined, and fully supported by the MSI structure in real time.
At minimum it was a 2-for-2 session for traders following the framework. It was an easy day to read and execute with substantial setups, all identified through proper context, patience, and flexibility while leveraging the MSI, premarket levels, and market structure rather than forcing trades. The VIX rose 9.98% to 18.40, reflecting a meaningful increase in fear that was entirely consistent with the aggressive selling and the extended targets that printed throughout the session. The MSI continues to prove its reliability as the cornerstone of our trading process.
Trading Strategy Based on MSI:
Monday has light economic news so the market is likely to grind lower given the Bearish Trending state at the close, though the move may be modest given the absence of extended targets printing at the close. With no high-impact catalysts on the calendar, Monday's price action will be driven by whatever momentum and sentiment carry over from Friday's notably negative session. That puts the MSI squarely at the center of the decision-making process, and traders should let it do the work rather than entering Monday with a rigid directional bias. The MSI rescaling data and the presence of extended targets during the premarket, AM session, and PM session all confirm the bears were in control today, and that tone is likely to carry into Monday's open. That said, without extended targets printing at the close, the downside appears limited and key support levels below are likely to attract buyers before the move extends materially further.
Heading into Monday the MSI closed in a Bearish Trending state with a moderate $2.82 spread. That moderate width means the bears have room to continue pressing, and any rally to MSI resistance at $745.97 should be treated as a shorting opportunity unless the MSI signals otherwise. The absence of extended targets at the close does temper the conviction for a gap-down continuation, and traders should watch the overnight session closely for any shift in MSI state that could change the tone before the open. $740 looks to be a viable target on the downside, as does $736 if the sellers find a second wind and extended targets begin printing again in premarket.
Bulls want to see price hold above $743.15 overnight and use it as a base to press SPY back through MSI resistance at $745.97 with conviction. If the MSI rescales into a Bullish Trending state with extended targets printing above, that would signal a meaningful recovery attempt and shift the bias toward buying dips to $743.15 as support and targeting levels above. Bears want to see $743.15 fail. A clean break below $743.15 with the MSI rescaling into a deeper Bearish Trending state and extended targets printing below would confirm the sellers are pressing the advantage and bring $740 into view as the next likely support magnet, with $736 as a secondary target beyond that.
Within the session, the core strategy is to sell rallies to $745.97 MSI resistance and target $743.15 support below, consistent with the bearish lean coming out of Friday. If price fails at $745.97 and the MSI holds in a Bearish Trending state, that is confirmation to stay with the sellers. If price instead holds above $745.97 and the MSI rescales into a Bullish Trending state, that flip is the signal to shift approach and buy dips back to $745.97 as support targeting levels above. A failed breakdown at $743.15 with price reversing and the MSI rescaling higher is also a high-probability long setup, particularly if extended targets stop printing below as that reversal takes hold. The moderate MSI width means both directions remain in play overnight, and staying reactive to what the MSI is doing in real time is far more valuable than committing to a directional bias before the open.
The long-term bull trend remains intact above $640 and failed breakouts and failed breakdowns continue to offer the highest-probability setups. Remain flexible, avoid trading during Ranging Market States unless a clear failed breakout or breakdown presents itself, and ensure all trades are fully aligned with MSI signals. Providing real-time insights into market control, momentum shifts, and actionable levels, the MSI when integrated with our Pre-Market and Post-Market Reports continues to sharpen execution precision and elevate trade quality. If you haven't yet integrated MSI and our model levels into your process, now is the time. Contact your representative to get started as these tools are designed to support consistency and enhance performance.
Dealer Positioning Analysis
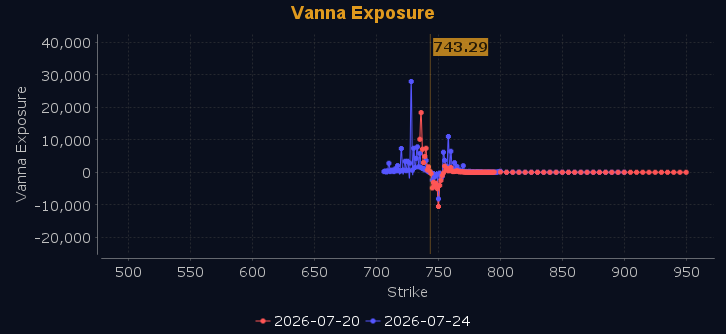
Dealers are selling SPY $754 to $770 and higher strike Calls while buying $743 to $753 Calls, indicating the Dealers' desire to participate in any relief rally on Monday. The ceiling for Monday appears to be $755, where heavy resistance from $745 to $750 is sure to slow any recovery attempt. Notably, SPY is sitting right at the 50 DMA, and a dip below that level could lead to a rapid move lower absent any external catalysts. To the downside, Dealers are buying $743 to $690 and lower strike Puts in a 4:1 ratio to the Calls they're selling, displaying significant concern that prices could move lower. Below $752 is bearish and above $753 is bullish, though traders should be aware that support is building most strongly at $740 and $736, which become key levels if the market loses ground. Dealer positioning is unchanged at bearish.
Looking Ahead to Next Friday:
Dealers are selling SPY $751 to $778 and higher strike Calls while buying $744 to $750 Calls, indicating the Dealers' desire to participate in any rally next week, though they remain heavily hedged heading into the week — and we have recommended traders do the same. The ceiling for next week appears to be $758, with formidable resistance at $745 to $750 and at $755 likely to cap any meaningful advance. To the downside, Dealers are buying $743 to $685 and lower strike Puts in a 5:1 ratio to the Calls they're selling, displaying significant concern that prices could move decidedly lower. Major support sits at $740 and $735, and we recommend traders remain well hedged. We recommend traders remain bullish above $752, but below $751 we are bearish. For the week Dealer positioning is unchanged at bearish. We advise reviewing Dealer positioning daily for directional clues. These positions evolve quickly and tracking them is essential for staying ahead of shifting market sentiment.
Recommendation for Traders
With SPY closing at $743.15 and VIX jumping 9.98% to 18.40, the bias stays short. Watch $740.80 as immediate support — a break there opens the door to $738. Favor short setups on failed bounces near $745–$747, keeping stops tight above $747.29.
Volatility is elevated, so size down and don't chase — let the levels come to you. Review the premarket analysis posted before 9 AM ET for any changes in the model's outlook and Dealer Positioning.
Good luck and good trading!
