
Market Insights: Monday, July 13th, 2026
Market Overview
Stocks kicked off a busy week in the red as the US and Iran escalated military tensions over the weekend, with renewed US strikes near the Strait of Hormuz and Iran retaliating against US allies including Kuwait, Jordan, and Qatar. The Dow fell 0.3%, the S&P 500 dropped 0.8%, and the Nasdaq slid 1.6% as AI and semiconductor stocks came under pressure — SK Hynix, which just made its Nasdaq debut last week, led declines among chipmakers. Oil jumped with Brent crude surging above $82 per barrel after President Trump vowed to reinstate the Strait of Hormuz blockade and announced a 20% fee on all cargo transiting the waterway, threatening to derail ongoing ceasefire talks.
The flare-up revived inflation concerns at a critical moment, with the Consumer Price Index due Tuesday and the Producer Price Index on Wednesday — both of which could shape expectations around Fed rate hikes. Investors are also watching the unofficial start of earnings season, with big bank results coming from JPMorgan Chase, Goldman Sachs, and Bank of America, while Taiwan Semiconductor's numbers will be closely watched as a read on AI demand. Netflix and Dow component UnitedHealth are also on deck to report this week.
SPY Performance
SPY opened at $752.47 and struggled to find any footing right out of the gate, with bulls making a brief run toward the $753.91 high before sellers took firm control of the session. The early attempt at continuation was quickly snuffed out, and from there the tape deteriorated steadily, dragging the ETF down to a low of $748.03 as the bears reasserted themselves with conviction. Whatever momentum had been building over the prior two sessions got handed back in a hurry, and the two-day winning streak came to an abrupt end.
SPY closed at $749.08, down 0.78%, erasing a meaningful chunk of the recent recovery and raising real questions about whether that bounce had any substance behind it. Volume came in at 39.26 million shares, still below average, which means the selling pressure didn't exactly arrive with overwhelming force — but it didn't need to, because the bulls simply weren't there to fight back. The VIX surged 14.17% to close at 17.16, a sharp one-day spike in anxiety that stands in stark contrast to the calm that had been building. One session doesn't make a trend, but a nearly one percent drop paired with a double-digit VIX jump is the market sending a clear message that the "show-me phase" ended today — and what it showed wasn't encouraging. The burden of proof now shifts back to the bulls, who need to respond quickly before this starts looking less like a pullback and more like a failed bounce.
Major Indices Performance
The Nasdaq took the biggest hit on the day, dropping 1.55% as growth and tech names bore the brunt of the selling pressure. With NVIDIA getting hit hard and the broader tech complex struggling, it's no surprise that the Nasdaq underperformed the other major averages by a wide margin. Growth stocks are particularly vulnerable when sentiment shifts and risk appetite fades, and today was a clear example of that dynamic playing out in real time.
The Russell 2000 came in next, falling 0.83% and once again confirming that small-caps can't find solid footing. As noted in the prior session, these names need consecutive positive days to build any kind of credibility, and instead they're sliding further. The fragility in this group continues to stand out as one of the more concerning signals for broader market health.
The Dow held up the best of the bunch, declining just 0.26% as its blue-chip, dividend-heavy composition offered some cushion against the day's selling. The S&P 500 also finished in the red, though the Dow's relative resilience suggests investors were rotating toward more defensive positioning rather than abandoning equities entirely. The spread between the Nasdaq's steep decline and the Dow's modest dip is a classic sign of risk-off behavior — investors weren't panicking across the board, but they were definitely making choices about where they wanted to be. Until growth leadership can stabilize, the major averages are going to have a hard time mounting any kind of sustained move higher.
Notable Stock Movements
NVIDIA took the hardest hit among the Magnificent Seven today, sliding 3.52% to lead what was a mostly red session for the group. That's a meaningful pullback for the AI darling, and it set the tone for a cohort that couldn't find its footing as broader market sentiment soured. When NVIDIA is getting sold off at that magnitude, it usually signals that risk appetite is pulling back from the highest-beta, highest-multiple names — and that's exactly what today felt like.
The broader Magnificent Seven picture leaned red, though Microsoft, Amazon, and Apple managed to stay on the right side of the tape and finish green. That's a bit of an unusual split — typically when NVIDIA sells off hard, the rest of the AI-adjacent names follow. The fact that Microsoft and Amazon held up suggests investors may be rotating within the group rather than abandoning mega-cap tech altogether, favoring names with more diversified revenue streams over pure-play AI hardware exposure.
The group's mostly red performance fits cleanly with the broader risk-off tone that dominated today's session. The Nasdaq getting hit the hardest among the major indices tells you that growth and technology names were in the crosshairs, and the Magnificent Seven were no exception. With the VIX surging 14.17% to 17.16, fear crept back into the market in a real way, and that kind of volatility spike tends to pressure the highest-valued names first. The green finishes from Apple, Microsoft, and Amazon are a silver lining, but NVIDIA's sharp decline makes it hard to frame today as anything other than a tough day for the group.
Commodity and Cryptocurrency Updates
Crude oil surged 8.81% today, closing at $77.70 in a massive single-session move that pushed the commodity even further above the $70 level. That kind of jump doesn't happen without a catalyst, and geopolitical tensions and supply concerns remain the dominant forces behind this run. With crude now sitting comfortably in the high $70s, the inflationary implications are hard to ignore — if energy prices stay elevated at these levels, the Fed's job gets considerably more difficult, and any hopes for near-term policy easing could take a backseat to renewed inflation concerns.
Gold had a rough session, dropping 2.36% to close at $4,007. That's a meaningful pullback, but one down day — even a sharp one — doesn't unravel the broader story. Central bank demand, geopolitical uncertainty, and an unresolved rate environment are still the pillars holding up this market, and buyers have shown a consistent tendency to step in on weakness. The $4,000 level will be worth watching closely in the near term as a key area of support.
Bitcoin continued its quiet but steady climb, adding 0.69% to close above $64,199. The move is measured and methodical, which is actually more encouraging than a volatile spike — it suggests conviction rather than speculation. With the crypto holding firmly above $60,000 and continuing to grind higher, the intermediate-term outlook remains solidly in the bulls' favor.
Treasury Yield Information
The 10-year Treasury yield pushed higher again on the session, climbing 0.88% to close at 4.610%. That's another step in the wrong direction for equity bulls, and it confirms that yesterday's move above 4.5% was not a one-day anomaly — it's becoming an established range. Each session that holds above that threshold adds weight to the bearish case for stocks, and today's close makes it harder to argue this is anything other than a trend.
Within the framework, 4.610% keeps us solidly above that critical 4.5% danger line where headwinds for equities are real and measurable. It's not a panic level, but it is a level that demands respect. The next significant waypoint is 4.8%, and we're now only 19 basis points away from a zone where history shows equity selling becomes more sustained and harder to reverse. Above that, 5% represents a serious shift in the risk environment, and 5.2% is where the framework calls for a correction of 20% or more. The market isn't there yet, but the path of least resistance in yields is still pointing higher.
What's most concerning today isn't just the number — it's the momentum. Two consecutive sessions of climbing yields with no meaningful pushback from the bond market is a signal that the pressure on equities is building, not stabilizing. Equity bulls desperately need yields to reverse convincingly back below 4.5% and eventually work toward the 4.3% range before stocks can sustain any meaningful rally. Until that happens, every bounce in equities faces a ceiling. The key watch heading into the next few sessions is whether 4.610% acts as a pause point or a springboard toward 4.7% and beyond — because the closer yields drift toward 4.8%, the more serious the conversation about downside risk in this market becomes.
Previous Day’s Forecast Analysis
Monday's forecast called for SPY to trade within a $745 to $760 range, a fifteen-point window the model characterized as a trending rather than consolidating structure. With Friday's close at $754.94 sitting near the upper half of that range, the bias heading into Monday was bullish, supported by a call-dominated options environment and strong positive gamma stacked between $752 and $756.
The key level to watch was $753, identified as the heaviest concentration zone and the critical gate that needed to be cleared and held with conviction to unlock further upside. Above there, $755 and $756 were the next decision points, with $758 marking the expected move top and $760 serving as the major call wall and maximum upside target. On the downside, $750 was the first line of defense — a major round-number pivot sitting in negative gamma territory, meaning a clean breakdown there could accelerate selling quickly. Below that, $749 was flagged as the critical gamma flip level, with $748, $746, and ultimately $745 as the model's floor where a heavy put wall was stacked.
The trading strategy leaned bullish, with the VIX's drop to 15.03 supporting expanded position sizing toward 85-90% of normal. Long entries were favored in the $750-751 zone, targeting $754-755 initially and $758-760 on a momentum extension, with stops placed below $748. Short setups were valid near $755-757 on a failed breakout, targeting $751-752 and deeper toward $748 if selling took hold. A clean break below $750 reopened short entries targeting $747, with stops above $752.50. The overall message was to stay disciplined with levels, keep stop parameters in the 1.5-2% range, and let the tape confirm before sizing up.
Market Performance vs. Forecast
Monday's session tested the lower half of the projected range, and the framework's structural analysis proved its value exactly where it mattered most. SPY opened at $752.47, right inside the model's projected window, and the early tape validated the forecast's identification of $753 as the critical gate — price briefly tagged $753.91 before sellers stepped in, confirming that level as legitimate overhead resistance rather than a springboard. The model had explicitly warned that a failure to hold and clear $753 with conviction would keep the session anchored to the lower half of the range, and that's precisely what unfolded.
The downside scenario the forecast outlined was well-mapped. The model identified $750 as the first major pivot and warned that a clean loss of that level would "open the door lower in a hurry" — SPY lost $750 during the session and followed through to a low of $748.03, which landed almost exactly on the $748 decision point the forecast had flagged. Risk management protocols protected capital on long setups, as the stop level below $748 was defined in advance, giving disciplined traders a clean exit point before the close at $749.08. The model's framework identified every meaningful level the session interacted with — from the $753 resistance rejection to the $748-$749 battleground — and that structural precision is exactly what the framework is built to deliver.
The VIX surge of 14.17% to 17.16 introduced volatility that exceeded the model's base case scenario built around a 15.03 starting point, and external catalysts drove that fear spike beyond what the prior session's calm tape had implied. The model does not account for unpredictable developments that can rapidly shift sentiment and compress price through key gamma levels in compressed timeframes. What remains consistent is that the architecture of the forecast — the resistance zones, the gamma flip triggers, the stop placement logic — defined the session's structure with precision. The framework adapts as volatility regimes shift, and with the VIX now elevated, Monday's price action gives the model sharper inputs heading into the next session.
Premarket Analysis Summary
The premarket analysis posted at market open identified SPY spot at $752.50 sitting in a call-dominated environment, consolidating near the highs following last week's recovery. The defining gate above was set at $754 — described as the major concentration zone and the single level that needed to be cleared with conviction to unlock the next leg higher. Above that, $755 was flagged as the next target where momentum would be tested, with $756 as the following decision point carrying heavy interest, $758 marking additional resistance, and $759 serving as the expected move top and max upside target. Strong positive gamma stacked between $753 and $756 was expected to provide a stabilizing tailwind throughout the session. On the downside, $752 was identified as the first level to watch sitting just below spot — a negative gamma zone where a clean breakdown would open the door lower. Below that, $751 was flagged as where selling could accelerate, with $750 identified as the critical round-number pivot and gamma flip level carrying the heaviest negative gamma concentration. Below $750, $748 was outlined as the next decision point and $746 marked the bottom of the expected move and the line in the sand as max downside.
The actual session delivered a bearish outcome that engaged the downside framework and never seriously challenged the upside. SPY opened at $752.47, essentially right on spot, but failed to mount any meaningful push toward the $754 gate. Price peaked at $753.91, falling just short of that defining level, and the inability to clear it with conviction was the tell early on. From there the session deteriorated, with $752 giving way, then $751, and ultimately $750 failing cleanly — exactly the acceleration scenario the premarket analysis had warned about given the deep negative gamma sitting at that strike. The low of $748.03 tagged the $748 decision point outlined in the framework before the session found a temporary floor. The close at $749.08 landed between the $748 and $750 levels, a soft finish that confirmed the downside bias the framework had flagged once those critical pivots gave way. The loss of 0.78% alongside VIX surging 14.17% to 17.16 stood in sharp contrast to the call-dominated environment described premarket, with the $754 gate never cleared and the $750 floor decisively failing.
Validation of the Analysis
Today's session delivered a clean downside validation of the premarket framework, with SPY respecting the named levels in nearly textbook fashion and providing well-defined trading opportunities for those working the analysis. The premarket opened with spot at 752.50 and immediately flagged 752 as the first line to watch on the downside — a negative gamma zone where losing it cleanly would open the door lower. SPY opened at $752.47, essentially spot on the premarket's current level, and the session told the story from there. Price never made a meaningful run at the 754 gate, stalling at a session high of $753.91 — just cents shy of that major call wall — confirming that 754 was exactly the resistance the analysis described as the single heaviest concentration zone needing to be cleared with conviction. When that level rejected price, the downside roadmap took over.
The breakdown played out almost step by step against the levels laid out overnight. The analysis warned that losing 752 opens the door, that 751 is where selling could accelerate, and that 750 was the critical round-number pivot and gamma flip — the heaviest negative gamma strike and a major battleground. SPY sliced through all three in succession before finding its session low at $748.03, tagging the 748 decision point the premarket identified as the next level below 750 with striking accuracy. That's the exact acceleration scenario the framework described for a 750 failure, and 748 acting as the floor confirms the map was drawn correctly. SPY closed at $749.08, settling just above that 748 decision point with the VIX surging 14.17% to 17.16, reinforcing the negative gamma environment the downside warnings were built around. From the precise 754 rejection to the flush through 750 and the 748 hold, the full range played out inside the boundaries the analysis defined before the bell rang.
Looking Ahead
Tuesday brings the big one — CPI. Both the headline and core readings drop for the month of July, and this is the data point the entire market has been waiting on. With the Fed still threading the needle between fighting inflation and avoiding a policy mistake, any surprise in either direction is going to move markets fast. A hotter-than-expected print crushes rate cut hopes and puts pressure on equities across the board, while a cooler number gives bulls the ammunition they need to push this rally further. Core CPI year-over-year is the figure traders will watch most closely, since it strips out the noise from food and energy and gives the clearest read on where underlying inflation actually stands.
On top of the CPI data, Fed Chairman Warsh testifies on Tuesday as well, which doubles the potential for volatility. If the CPI print is hot and Warsh strikes a hawkish tone, that's a tough combination for the bulls to absorb. If inflation comes in soft and Warsh signals patience, expect risk assets to catch a meaningful bid. The smart play is to go into Tuesday with your levels already mapped out, keep position sizes reasonable ahead of the CPI release, and let the market show its hand before committing. This is not a session to be a hero into the open.
Market Sentiment and Key Levels
The directional bias today tilts bearish, and the session's price action makes a reasonably clear case for the bears taking control — at least in the short term. SPY fell 0.78% and closed at $749.08, well off the session high of $753.91 and unable to find any meaningful recovery after morning selling hit the tape. What makes this more concerning is that the VIX surged 14.17% to 17.16, a sharp spike that signals options traders are actively pricing in more volatility ahead. That's not noise — that's the market's fear gauge sending a real warning. Volume came in at 39.26M, below average, which is actually a double-edged data point here. Lighter volume on a down day can mean institutional sellers aren't fully committed yet, but it also means buyers lacked the conviction to step in and defend prices, letting SPY drift lower without much of a fight.
Key resistance now sits at $753.91, today's intraday high, and just above that the $752.47 open acts as a secondary ceiling the bulls would need to reclaim to reestablish control. A strong, volume-backed move back above $753.91 would suggest the pullback was just a one-day shakeout and could set up a retest of the $755 area. On the downside, $748.03 — today's session low — is the critical line in the sand. A break below that level with any real follow-through selling puts the bulls in a genuinely uncomfortable position and opens the door to a deeper slide toward the $743 to $745 range. The Nasdaq's 1.55% drop is a notable red flag, as tech-heavy weakness tends to drag the broader market when it gets persistent. Gold dropping sharply and Bitcoin barely holding a modest gain suggests risk appetite is fragmented rather than unified. A crawling 10-year yield above 4.6% remains a quiet but persistent headwind for equity valuations. The bears have the edge right now, and $748.03 is the number to watch.
Expected Price Action
Tuesday's session presents actionable intelligence generated by our AI model, with SPY projected to trade within a range defined by $746 on the downside and $759 as the max upside target. That thirteen-point window signals the market will trend rather than consolidate, and with Monday's close at $749.08 sitting in the lower half of the expected move, the bias leans bearish heading into the session.
The defining level on the upside is $754 — the model identifies that as the single heaviest concentration zone and the major gate that needs to be cleared and held with conviction before any meaningful rally can develop. Strong positive gamma stacked between $753 and $756 should act as a stabilizing tailwind if price can push back into that zone, with $755 as the first momentum checkpoint and $756 as the next decision point. Above $756, resistance builds toward $758, with $759 capping the expected move top as max upside. On the downside, $752 is the first level to watch — it sits just above Monday's close in a negative gamma zone, and losing it cleanly opens the door lower in a hurry. Below $752, $751 is where selling could accelerate, and $750 becomes the critical round-number pivot and gamma flip — the heaviest negative gamma strike on the board and a major battleground. If $750 fails cleanly, $748 is the next decision point with $746 serving as the model's ultimate floor and line in the sand. With VIX spiking 14.17% to close at 17.16, the elevated fear reading adds urgency to that $750 level — bulls absolutely need to defend it Tuesday or risk an acceleration lower given the deep negative gamma sitting right below it.
Trading Strategy
The VIX jumping 14.17% to 17.16 is a meaningful shift in market tone, signaling that options markets are repricing fear at a faster clip and hedging demand is picking back up. At 17.16, the VIX has moved out of the relaxed sub-16 zone and into territory that warrants genuine caution — it's not at panic levels, but the acceleration in the move tells you traders are paying up for protection heading into the next session. This elevated volatility read justifies trimming position sizing down to 70-75% of normal, as the conditions favor tighter discipline and more selective entries over broad exposure. Below-average volume on the session adds a layer of complexity here — the selling wasn't backed by heavy institutional conviction, which means a reversal attempt has some credibility, but it also means we shouldn't assume the downside is exhausted.
Long setups require patience given the bearish session close, but the $748-749 zone now becomes the key battleground. A hold and bounce off $748 on the open with stabilizing breadth offers an entry for a long, with an initial profit target at $752-753 and a secondary push toward $754-755 if buyers step in with real follow-through. Stops on longs belong below $746.50 — a clean break under that level would suggest the bounce is failing and more downside is ahead. In a rising market scenario, a gap-fill attempt back toward $753-754 on improving internals sets up a momentum add, with targets at $755-756 on the first leg and $758 if institutional buyers absorb the overhead supply left behind by today's session.
Short setups are attractive near the $752-753 zone, where any failed recovery rally runs directly into resistance. A weak bounce into that area on declining breadth sets up a clean fade, with initial downside targets at $749-750 and a deeper move toward $746-747 if selling pressure accelerates. In a declining market scenario, a failure to reclaim $750 on the open reopens short entries with targets at $747 and $745, with stops placed above $752. With the VIX at 17.16 and expanding, keep stop-loss parameters tight at 1.25-1.5% from entry — rising volatility environments can produce violent whipsaws in both directions, and the edge belongs to the trader who respects levels rather than chases the move.
Model’s Projected Range
SPY's projected maximum range for Tuesday is $741 to $757, with the Put side dominating in an expanding band that suggests trending price action with intermittent chop. Tuesday brings Core CPI m/m, Core CPI y/y, CPI m/m, CPI y/y, and Fed Chairman Warsh testifying — a heavy slate of high-impact events likely to produce significant volatility particularly in the first hour of trading. SPY closed at $749.08, down 0.78%, after opening at $752.47 and trading between a high of $753.91 and a low of $748.03, with volume running below average — a session that started firm and faded into the close. SPY remains in the $745 to $750 range that has defined recent trading, with ongoing macro uncertainty keeping bulls cautious and sellers opportunistic at the highs. On the upside, our model shows the first resistance at $750, and a clean break above that level targets $755 next; on the downside, the first support sits at $745, and a break below that opens the door to $741, and if that level fails, there is little to keep price from falling toward $740 and potentially $735. The long-term bull trend remains intact above $640 with SPY well above structural support. As long as price holds above key structural levels, this remains a broader dip-buying environment. Absent a catalyst, resistance sits at $750, $755, $757, $760, while support rests at $745, $741, $740, $735. Given SPY's close just below the $750 resistance, we favor shorting rallies near $750 until price can reclaim and hold that level with conviction. Bitcoin edged higher by 0.69% closing above $64,199, showing modest resilience, while MAG stocks were mostly red across the board led lower by NVIDIA dropping 3.52%, though Microsoft bucked the trend to the upside gaining 1.53% — a split in leadership that bears watching heading into a data-heavy Tuesday. The VIX closed at 17.16, up 14.17%, suggesting elevated fear given the heavy inflation data and Fed testimony on deck. SPY closed near the lower end of its recent trend channel, with structural support near $745 keeping the broader uptrend intact for now.
Market State Indicator (MSI) Forecast
Current Market State Overview:
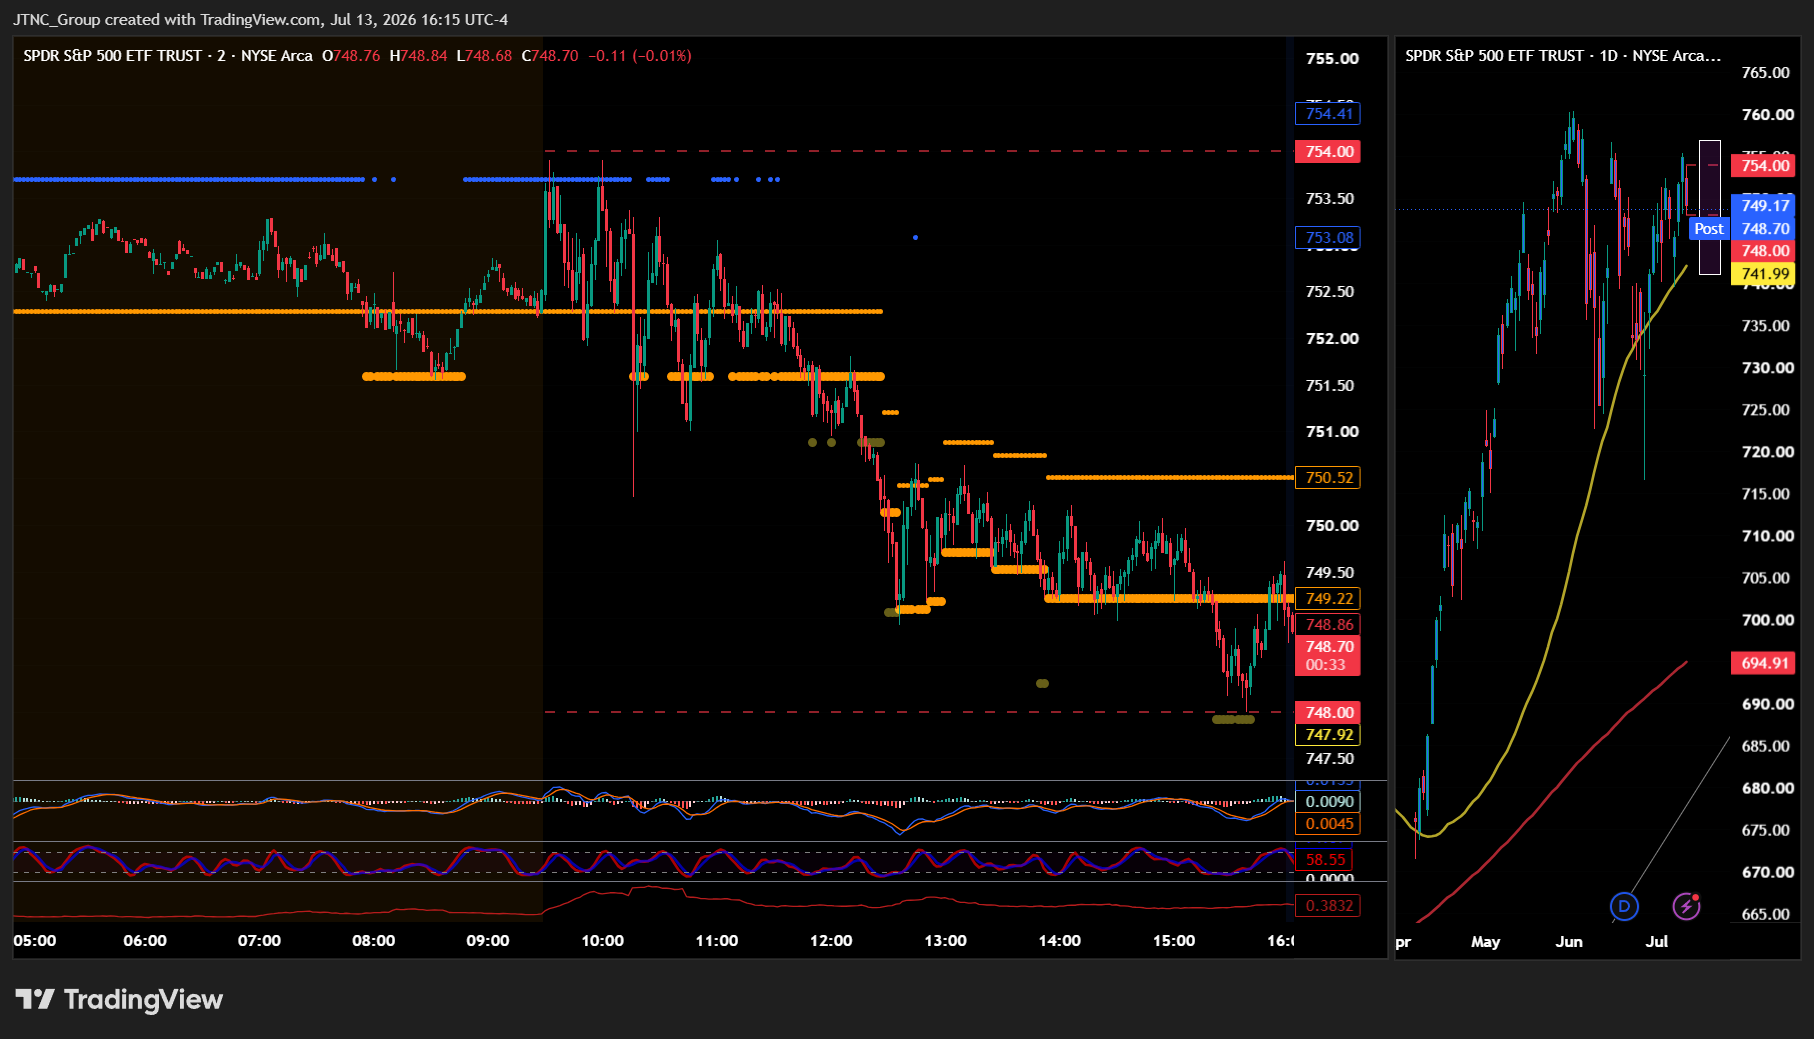
The MSI ended in a Bearish Trending Market State with SPY closing at $749.08. Since SPY closed below MSI support, that former support level at $749.22 now flips to resistance heading into Tuesday, with the next meaningful level being $750.52. Extended targets were not printing at the close, which is a notable shift from the aggressive selling that dominated the afternoon. Extended targets were active during both the AM session and the PM session, printing above as the session unfolded, though the real acceleration came later in the day as the bears took control and the MSI began a series of rapid rescalings lower. In premarket there were no extended targets visible, offering little directional conviction before the open.
The MSI rescaled lower overnight, opening the day in a narrow ranging market state that persisted through the entire morning session, creating choppy, indecisive price action with the MSI flipping between a ranging state and a narrow bearish state. Extended targets did not print below until the PM session when the bears finally stepped on the gas and triggered a meaningful selloff. From there the MSI underwent a series of rapid rescalings lower with extended targets printing for much of the afternoon, driving price down to a session low of $748.03. A brief flash to that level late in the session gave way to a slight recovery into the close, and with extended targets stopping before the bell, price edged back up just shy of $750. The MSI closed with a narrow $1.30 spread, indicating tight consolidation rather than a strong trending environment. With no extended targets printing at the close and the range remaining this narrow, the MSI is forecasting a likely sideways to possibly up session on Tuesday, though the bears are expected to maintain downside pressure. Any failure of former support now acting as resistance could keep SPY pinned, and any break lower risks a retest of the day's lows. MSI support is $749.22 with resistance at $750.52.
Key Levels and Market Movements:
Friday we stated, "Bulls want to see overnight price hold above $754.41 MSI support and use that level as a launching pad to press SPY toward new highs above $755.03 and beyond," and added, "Bears want to see $754.41 support fail and the MSI rescale into a Ranging or Bearish Trending state," while also noting, "If extended targets stop printing above and the MSI rescales lower, it would signal the rally is losing steam and a pullback toward $750 becomes probable."
That warning aged quickly. Monday opened at $752.47, and right away it was clear the bulls could not hold their ground. The premarket offered no extended targets to guide direction, which was the first sign that Friday's momentum had faded. The morning session was a grind rather than a trend, with the MSI flipping back and forth between a ranging state and a narrow bearish state, keeping price contained and choppy with no clean directional edge. SPY oscillated without conviction as sellers tested the waters and buyers offered token resistance. Traders following the MSI knew to stay patient and avoid forcing setups during that ranging stretch.
The real story began in the PM session when the bears finally committed. The MSI began a series of rapid rescalings lower with extended targets printing, and price dropped sharply from the mid-session range all the way down to a session low of $748.03. That move of nearly six points from the open to the low was telegraphed in real time by the MSI's rescaling pattern and the appearance of extended targets printing above as the framework confirmed momentum had decisively shifted to the downside. Traders who sold rallies to MSI resistance-turned-resistance levels during those rapid rescales had clean entries with price tracking lower toward premarket levels on each leg down. Late in the session the extended targets stopped printing and price recovered slightly to close at $749.08, a decline of 0.78% on below-average volume of 39.26 million shares. The VIX surged 14.17% to 17.16, a sharp spike in fear that confirmed the risk-off tone and validated the bearish session read. At minimum it was a three-for-three session for traders following the framework. It was an easy day to read albeit not an easy day to trade given the choppy morning range. But substantial setups were present, all identified through proper context, patience, and flexibility while leveraging the MSI, premarket levels, and market structure rather than forcing trades. The MSI continues to prove its reliability as the cornerstone of our trading process.
Trading Strategy Based on MSI:
Tuesday has heavy economic data with Core CPI m/m, Core CPI y/y, CPI m/m, CPI y/y, and Fed Chairman Warsh Testifies, which can introduce significant volatility, so traders should be ready to trade what they see rather than predict. Inflation data of this magnitude can immediately shift the MSI state in either direction, and Warsh's testimony adds another layer of potential surprise that makes predicting a clean directional move in advance particularly difficult. The best approach is to let the MSI react to the data and follow its lead.
Heading into Tuesday the MSI closed in a narrow Bearish Trending state with a $1.30 spread, which tells us the bears have nominal control but not dominant control. The narrow width suggests this market is coiling rather than trending, and Tuesday may just as easily see a relief rally or an overnight rescale higher as it continues the downward pressure. The absence of extended targets at Monday's close reinforces this softer bearish read — the selling pressure eased into the bell and the MSI is not forecasting a strong continuation lower on its own without a catalyst.
With SPY closing below former MSI support, $749.22 now acts as resistance heading into Tuesday. Bulls need to reclaim that $749.22 level overnight or at the open with conviction. If they can push through $749.22 and hold it, the next target becomes $750.52. A sustained move above $750.52 with the MSI rescaling into a Bullish Trending state and extended targets printing above would be a meaningful shift in tone and would give bulls the momentum to press toward higher levels and potentially retest Friday's close near $755. Bears want to see $749.22 hold as resistance and any rally fail at that level, keeping SPY pinned below and vulnerable to retesting the session low of $748.03. A clean break below $748 with the MSI rescaling lower and extended targets printing would signal that the selling pressure is resuming and deeper levels come into play.
Given the CPI data hitting before the open, the premarket will likely set the tone early. If the inflation numbers come in hot, expect the MSI to rescale lower with conviction and the bearish trend to reassert itself. If numbers come in cooler than expected, a short squeeze toward $750.52 and above is very much on the table, especially with the MSI already set up in a narrow range that historically precedes larger moves. Remain on the right side of whatever the MSI signals in real time and do not fight the initial reaction.
The long-term bull trend remains intact above $640 and failed breakouts and failed breakdowns continue to offer the highest-probability setups. Remain flexible, avoid trading during Ranging Market States unless a clear failed breakout or breakdown presents itself, and ensure all trades are fully aligned with MSI signals. Providing real-time insights into market control, momentum shifts, and actionable levels, the MSI when integrated with our Pre-Market and Post-Market Reports continues to sharpen execution precision and elevate trade quality. If you haven't yet integrated MSI and our model levels into your process, now is the time. Contact your representative to get started as these tools are designed to support consistency and enhance performance.
Dealer Positioning Analysis
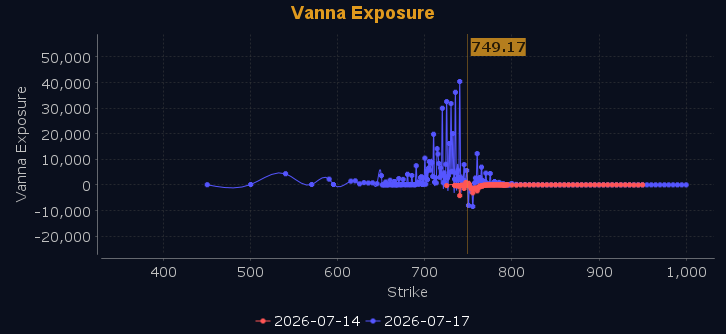
Dealers are selling SPY $763 to $773 and higher strike Calls while buying $750 to $763 Calls, indicating the Dealers' desire to participate in any rally on Tuesday. The ceiling for Tuesday appears to be $768. To the downside, Dealers are buying $749 to $688 and lower strike Puts in a 3:1 ratio to the Calls they're selling, displaying moderate concern that prices could move lower. Notably, Dealers are selling OTM Puts at $740 and $745 in size, indicating their belief that prices will find a floor no lower than $740 and perhaps $745. Dealers do not sell ATM Puts unless they believe there is a floor in the market at $740. Dealers remain hedged but balanced in their positioning, with major resistance sitting at $750 likely to contain price for much of the session, and material support at $745 setting the stage for more chop and consolidation rather than a strong directional trend. Below $748 is bearish and above $749 is bullish. Dealer positioning is unchanged at neutral/slightly bearish.
Looking Ahead to Next Friday:
Dealers are selling SPY $756 to $778 and higher strike Calls while buying $750 to $755 Calls, indicating the Dealers' desire to participate in any rally this week. The ceiling for the week appears to be $760. To the downside, Dealers are buying $749 to $645 and lower strike Puts in a 5:1 ratio to the Calls they're selling, displaying significant concern that prices could move decidedly lower, as Dealers have increased the size of their hedges in the event conditions deteriorate further. Large walls at $750, $748, and $745 will act as key support and resistance levels, and clearing $752 opens the door to $755 easily with a hard stop at $757. We recommend traders remain bullish above $752 but below $751 we are bearish. For the week Dealer positioning is unchanged at bearish. We advise reviewing Dealer positioning daily for directional clues. These positions evolve quickly and tracking them is essential for staying ahead of shifting market sentiment.
Recommendation for Traders
SPY closed at $749.08 with VIX surging 14.17% to 17.16, shifting the bias toward caution. The $748 area is now key support — a break below puts $745 in play. Favor shorts on bounces toward $752, and keep stops tight above $754.
Volatility is picking up, so reduce size and don't overstay trades in either direction. Review the premarket analysis posted before 9 AM ET for any changes in the model's outlook and Dealer Positioning.
Good luck and good trading!
