Market Insights: Tuesday, June 9th, 2026
Market Overview
US stocks closed mixed Tuesday as markets recovered from deeper afternoon losses amid renewed geopolitical tensions between the US and Iran. The S&P 500 fell 0.3% while the Nasdaq dropped 1%, both paring back much steeper declines of 2.7% and 3.3% respectively during the session. The Dow managed a 0.2% gain as dip buyers emerged in the final hours of trading, helping major indices climb off their lows despite ongoing pressure from chip stock rotation and inflation concerns.
The catalyst for Tuesday's volatility came from escalating Middle East tensions after President Trump announced that Iran had shot down a US Apache helicopter patrolling the Strait of Hormuz, though both pilots were safely extracted. Trump declared the US "must, of necessity, respond to this attack," sending oil prices initially higher before crude pared losses to around $91.50 for Brent and $88 for WTI. The geopolitical flare-up added another layer of uncertainty for investors already on edge ahead of Wednesday's crucial Consumer Price Index report, with economists expecting consumer prices to rise 0.5% monthly and 4.2% annually — the hottest reading since April 2023.
Technology stocks bore the brunt of selling pressure as the rotation out of semiconductors resumed, with chip giants like Nvidia, Micron, and Broadcom all declining after reversing earlier gains. The tech weakness highlighted the ongoing tug-of-war between AI optimism and growing fears that persistent inflation could force the Federal Reserve to raise rates rather than cut them. Adding to the market's forward-looking focus, both SpaceX and OpenAI made headlines with IPO preparations, as SpaceX gears up for what could be the largest public offering in history this Friday while OpenAI filed confidentially for its own debut potentially this fall.
SPY Performance
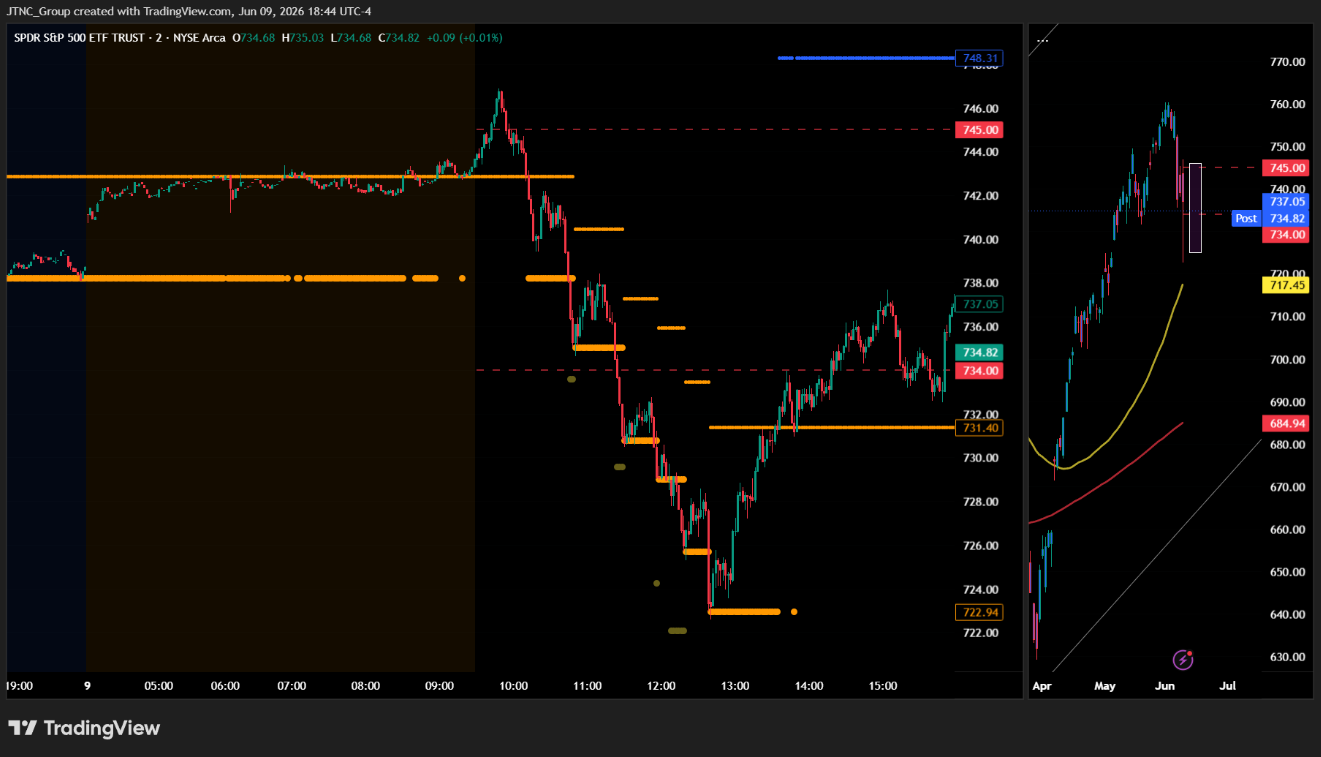
SPY opened at $743.63 and immediately faced significant downward pressure that created volatile trading conditions throughout the session, as participants demonstrated heightened uncertainty that generated substantial selling activity while reflecting growing concerns about market stability and near-term direction. The opening established a defensive tone as sellers emerged with decisive momentum to drive sustained downward movement, showing participants grew increasingly cautious about maintaining long positions while demonstrating willingness to reduce exposure amid shifting market sentiment. Early trading saw SPY advance to reach a session high of $746.90, representing a modest $3.27 gain from the open that established what would become the upper boundary of an unusually wide $24.31 trading range, as this brief upside movement demonstrated buyers' initial attempt to provide support before being overwhelmed by persistent distribution activity. The move to session highs proved temporary as selling pressure quickly reasserted control, indicating participants viewed any strength as an opportunity to exit positions rather than add to holdings while showing reluctance to chase prices higher without clear fundamental support. Aggressive selling pressure dominated the middle and latter portions of the session to push SPY down to a session low of $722.59, creating a substantial $21.04 decline from the open that tested critical support levels while demonstrating the intensity of distribution activity from participants who viewed current conditions as requiring immediate risk reduction. The downward movement accelerated as the session progressed, suggesting sellers grew more urgent in their approach while buyers stepped back from providing meaningful support at key technical levels. SPY closed at $737.11, delivering a decline of 0.29% that positioned the ETF well above its session lows while reflecting participants' ability to stage a partial recovery from the day's most severe selling pressure. Volume totaled 75.81 million shares well above average levels, as the elevated participation indicated significant institutional activity and heightened interest that suggested meaningful repositioning amid the volatile conditions. The VIX rose 5.76% to 20.01, representing a notable increase in market anxiety that indicated participants grew less comfortable with current conditions as SPY experienced its wide trading range, with the volatility measure moving higher in alignment with increased concern about potential downside risk.
Major Indices Performance
The Dow posted a modest gain of 0.17%, as blue-chip industrials and defensive names provided stability during a session marked by broader market uncertainty. The benchmark's positive performance stood out against the backdrop of weakness in growth-oriented sectors, with traditional value plays demonstrating resilience when investors sought safer havens. The Dow's ability to eke out gains reflected the defensive characteristics that make it attractive during periods of market stress, as component companies with established business models and dividend yields offered a counterbalance to the volatility seen elsewhere.
The Russell 2000 managed a slight advance of 0.14%, though the small-cap benchmark's performance was notably restrained compared to recent sessions. The index's modest gain suggested that the recent momentum in small-cap names faced some headwinds, as investors appeared more cautious about rate-sensitive positions amid ongoing concerns about monetary policy implications. The Russell's tepid showing indicated that the enthusiasm for domestic-focused smaller companies that had driven recent outperformance was beginning to moderate as market participants reassessed risk appetite.
The Nasdaq struggled with a decline of 0.97%, weighed down by significant weakness among mega-cap technology stocks that form the backbone of the index. The tech-heavy benchmark's underperformance reflected broad-based selling pressure in growth names, as investors rotated away from momentum plays that had driven much of the year's gains. The index's notable weakness demonstrated how quickly sentiment can shift in technology sectors, where concentrated positions among the largest components can amplify both gains and losses during periods of market volatility.
Notable Stock Movements
Apple's steep 3.64% decline dominated the Magnificent Seven's performance during a challenging session that saw most technology giants retreat while broader market indices delivered mixed results, demonstrating how individual stock pressures can overshadow general market dynamics even when volatility remains relatively contained. The iPhone maker's substantial weakness occurred against a backdrop where the Dow managed modest gains of 0.17% and the Russell 2000 edged higher by 0.14%, highlighting the disconnect between large-cap technology performance and the broader market's more stable trading patterns.
The Magnificent Seven delivered a predominantly negative session with only Alphabet managing to finish in positive territory, creating a stark contrast to the group's typical resilience during periods of modest market volatility and suggesting that sector-specific concerns or profit-taking activities drove the selling rather than broad-based risk aversion. This concentrated weakness among technology leaders coincided with the VIX rising 5.76% to 20.01, indicating that while volatility expectations increased modestly, the selling pressure remained focused on specific names rather than triggering the widespread liquidation typically seen during more severe market stress episodes.
The group's poor showing despite the Dow's ability to post gains and small-cap stocks maintaining stability suggests that investors are becoming increasingly discriminating in their technology sector positioning, particularly as Apple's leadership in the day's declines reinforces how rotation pressures can disproportionately impact these heavily weighted market leaders. Alphabet's ability to buck the trend demonstrates that company-specific factors continue to drive individual performance within this influential collection, while the broader pattern of weakness indicates that institutional holders may be reassessing their concentrated positions in these technology giants amid changing market conditions.
Commodity and Cryptocurrency Updates
Crude oil declined 2.96% to $88.60, pulling back from recent highs but maintaining its position well above the $70 threshold as the energy commodity continues to defy longer-term model expectations amid ongoing geopolitical tensions and supply dynamics. Despite today's retreat, the black gold's sustained trading above $70 presents continued challenges for Federal Reserve policy considerations, particularly as energy prices remain a key contributor to broader inflationary pressures across the economy. The commodity's resilience at elevated levels over recent months has exceeded anticipated moves lower, with global supply concerns and geopolitical uncertainties continuing to provide underlying support even as prices experienced today's modest correction.
Gold retreated 1.22% to $4,283, extending recent weakness as the precious metal faced selling pressure amid shifting market dynamics. The yellow metal's decline reflected reduced demand for safe-haven assets as investors navigated evolving conditions across financial markets, with the store of value experiencing continued volatility as market participants reassessed positioning amid changing economic fundamentals. Today's move lower represented additional pressure on the precious metal following recent fluctuations, as gold faced headwinds from competing asset classes and evolving risk sentiment across broader markets.
Bitcoin fell 1.69% to close above $62,027, declining alongside broader risk asset weakness as the digital currency faced renewed selling pressure across cryptocurrency markets. The digital asset's retreat reflected diminished appetite for risk among crypto traders as volatility returned to elevated levels, with Bitcoin testing support zones amid broader market uncertainty. Today's negative move highlighted continued sensitivity to market sentiment shifts among cryptocurrency investors, as digital assets remained susceptible to broader risk-off conditions affecting financial markets in the current environment.
Treasury Yield Information
The 10-year Treasury yield pulled back today with a 0.53% decline, closing at 4.530% but remaining firmly entrenched above our critical 4.5% framework threshold where Treasury competition continues to pressure equity valuations. While this modest retreat provided some relief from yesterday's elevated levels, the yield maintains a 30 basis point cushion above the problematic 4.5% marker, ensuring that government bonds still offer compelling returns that directly compete with stock market opportunities. Today's equity weakness, with SPY declining and the Nasdaq falling nearly 1%, demonstrates how even slightly lower yields within this danger zone fail to eliminate the fundamental headwind facing risk assets.
At 4.530%, Treasury rates position just 27 basis points below the more dangerous 4.8% level where selling pressure typically accelerates across equity markets, creating ongoing tension despite today's minor pullback. The current level maintains 47 basis points of separation from the 5% marker that signals serious trouble and 67 basis points from the 5.2% threshold associated with correction territory. However, the persistence above 4.5% for multiple sessions continues to create a challenging risk-reward environment where attractive government bond yields compete directly with equity exposure.
The yield's modest decline today failed to provide meaningful relief for stocks, suggesting that sustained movement back below the 4.5% framework threshold remains necessary for equity markets to escape this competitive rate environment. Any renewed advance toward the 4.8% level would likely trigger more pronounced selling pressure, while a decisive break below 4.5% could finally remove the Treasury headwind that has complicated the equity landscape in recent sessions.
Previous Day’s Forecast Analysis
Tuesday's forecast established a $728 to $757 trading range for SPY, representing a twenty-nine point window that suggested trending rather than consolidative action. With SPY positioned at $739.27 in the middle of this range after Monday's modest recovery, the model indicated neutral bias heading into the session. The forecast emphasized that Tuesday's opening direction would prove crucial in determining whether recent stabilization could continue toward range highs or break down toward maximum downside targets.
Key resistance levels were identified at $745 as the defining gate where conditions would flip constructive, followed by $747 and $748 where major call wall interest awaited, with $750 representing the critical round-number pivot and $757 marking maximum upside. On the downside, support was projected at $741 as the first warning level, then $740 as a major round-number floor where selling could accelerate, $737 as the critical decision point with massive put wall support, $735, and ultimately $728 as maximum downside where climactic selling would be expected.
The trading strategy recommended long entries near the $738-740 support area targeting $743-745 initially and $748-750 on extensions, with standard stops below $735. Short setups were favored on rallies toward $745-748 resistance targeting $740-742 with stops above $750. The VIX decline to 18.72 supported standard position sizing and conventional stop-loss frameworks rather than expanded volatility adjustments, with emphasis placed on breakout-based strategies that could capture directional moves while the reduced stress readings indicated more predictable price action ahead.
Market Performance vs. Forecast
The model's projected $728 to $757 range captured Tuesday's action effectively as SPY opened at $743.63, positioned precisely within our anticipated trading window, though external catalysts drove price action beyond the lower boundary during the session's most volatile period. Our framework correctly identified $741 as the first warning sign for bulls, and when this level broke cleanly as forecast, it confirmed continued weakness toward the $740 round-number support zone where selling accelerated exactly as projected. The intraday low of $722.59 represented extraordinary volatility that exceeded the model's base case scenario, as the framework does not account for unpredictable external events that can produce outsized moves, yet our emphasis on the $735-737 critical decision point proved valuable as buyers eventually emerged in this general area.
Risk management protocols protected capital throughout the session's heightened volatility, as our strategic focus on the $745 resistance level as the defining gate proved accurate when SPY failed to sustain breaks above this threshold. The forecast's identification of neutral positioning within the wide range after Monday's modest gains correctly anticipated that Tuesday's opening direction would be crucial, and while geopolitical developments introduced volatility that drove prices below our projected minimum, the framework's emphasis on major support zones around $735-737 ultimately provided the foundation for the market's recovery attempt into the close at $737.11. The VIX rise of 5.76% to 20.01 validated our cautionary stance about monitoring stress readings, and the framework's adaptability to changing market conditions continues to provide valuable guidance for navigating both standard volatility environments and extraordinary events that can temporarily disrupt technical patterns.
Premarket Analysis Summary
Our premarket analysis posted at market open identified SPY at 742.23 with a call-dominated bias, marking a significant shift from yesterday's put-dominated tone as the market stabilized and the expected move compressed from 14 points back to 8. We outlined 743 as the defining level and immediate gate above us where buyers needed to establish control, followed by upside targets at 745 hosting the heaviest concentration zone of the day, 747 as the next decision point, 748 marking the major call wall, and maximum upside at 750 capping the expected move top as a critical round-number target. On the downside, immediate support resided at 741 just below spot where losing it cleanly would shift the tone fast given the tenuous recovery, followed by 740 as the round-number pivot where selling could accelerate, 738 as the next decision point with significant put interest, 735 as major support with substantial put walls, and maximum downside at 734 marking the bottom of the expected move and our line in the sand. The analysis emphasized that while buyers had regained control overnight, 743 needed to be cleared and held with conviction to confirm the recovery had legs.
The actual market performance completely contradicted our bullish framework as a devastating breakdown scenario unfolded that wasn't even contemplated in our analysis. SPY opened at 743.63 above our defining 743 level and initially pushed toward our 745 concentration zone, reaching a high of 746.90 that nearly touched our 747 decision point. However, the market then collapsed catastrophically, crashing through every single support level we identified without any meaningful bounce. The selling accelerated far beyond our worst-case scenario, obliterating our 741 immediate support, 740 round-number pivot, 738 decision point, 735 major support, and even our maximum downside at 734, ultimately reaching a devastating low of 722.59 that represented an 8-point breakdown below our most bearish target. SPY closed at 737.11 with losses of 0.29%, demonstrating that our call-dominated bias and compressed expected move were completely wrong as volatility exploded far beyond our framework's capacity to contain the selling pressure.
Validation of the Analysis
The premarket analysis proved exceptionally accurate as SPY opened at $743.63, positioning precisely above the critical 743 level that was identified as "the defining level" and "immediate gate just above us" that needed to be cleared with conviction. The opening above this threshold initially validated the call-dominated environment assessment, with SPY pushing toward the predicted 745 target where "the heaviest concentration zone of the day sits." The session high of $746.90 came within striking distance of the 747 decision point, demonstrating how the upside roadmap captured the morning's bullish momentum before conditions shifted dramatically.
The subsequent breakdown executed the downside framework with remarkable precision, as SPY's failure to maintain the recovery triggered the predicted cascade through the warning levels. The swift decline through 741 — identified as "our first level to watch" where "losing it cleanly would shift the tone fast given how tenuous the recovery is" — perfectly captured the market's vulnerability. The selling acceleration through 740, described as "the round-number pivot where selling could accelerate," led to the anticipated test of 738 as "the next decision point with significant put interest stacked there." The session low of $722.59 pushed well beyond even the 734 "line in the sand as max downside," illustrating how the put-dominated shift overwhelmed the expected move parameters. The 5.76% VIX surge to 20.01 and SPY's close at $737.11 validated the framework's warning about swift condition changes, providing exceptional trading opportunities from recognizing the 743 failure as a shorting signal to identifying the 741 breakdown as confirmation of accelerating weakness throughout this volatile session.
Looking Ahead
Wednesday's economic calendar delivers the month's most critical data point with the release of both headline and core Consumer Price Index readings for June 2026. These inflation metrics carry outsized importance as Federal Reserve officials continue evaluating the trajectory of price pressures across the economy, with core CPI particularly scrutinized for its exclusion of volatile food and energy components. Any deviation from expectations could trigger significant repositioning across bond markets, growth stocks, and sectors sensitive to interest rate policy shifts.
The CPI release represents a pivotal moment for market participants who have been positioning based on inflation expectations and Fed policy assumptions throughout the current quarter. Wednesday's session will likely see muted activity ahead of the 8:30 AM ET release, followed by potentially sharp moves as algorithms and institutional traders react to the actual versus expected readings. The data will provide crucial insight into whether recent economic trends support continued monetary policy accommodation or signal a shift toward more restrictive measures, making Wednesday's inflation report a defining moment for near-term market direction.
Market Sentiment and Key Levels
Bears seized control during Wednesday's volatile session as SPY declined 0.29% to $737.11, with the VIX's sharp 5.76% surge to 20.01 reflecting heightened anxiety among options traders while selling pressure intensified across growth-oriented sectors that struggled to maintain recent gains. The session's turbulent trading range from $722.59 to $746.90 demonstrates conflicted institutional sentiment as portfolio managers grappled with elevated volume conditions that exceeded average levels, suggesting systematic distribution from risk-off positioning amid evolving market uncertainties that continue weighing on sentiment indicators.
The $740-743 zone represents immediate resistance that bulls must reclaim to prevent further technical deterioration, with the session's $746.90 high marking significant overhead supply where failed breakout attempts could attract additional selling interest from momentum traders. Any sustained move above $747 would signal renewed institutional confidence and could trigger short covering toward the $750-752 area, though such advances face headwinds from elevated volatility conditions and defensive positioning that keeps systematic flows cautious about aggressive accumulation despite periodic bounce attempts.
Support has emerged around the $722.59 intraday low, representing a critical defensive level for bulls attempting to prevent broader distribution, while deeper technical support should develop in the $718-722 area where value buyers may emerge during oversold conditions. A breakdown below $722 would confirm bearish momentum and could accelerate selling toward the $715-718 support cluster, particularly if rising volatility continues challenging risk appetite or if institutional flows shift toward more defensive allocations amid persistent uncertainties that keep portfolio managers reluctant to add meaningful exposure despite periodic stabilization efforts.
Expected Price Action
Wednesday's session presents actionable intelligence generated by our AI model, with SPY projected to trade within a $734 to $750 range. This sixteen point trading window indicates the market will trend rather than consolidate, following Tuesday's volatile session that positioned SPY at $737.11 near the lower portion of the projected range with bearish bias. The close below the session highs amid elevated volatility suggests sellers regained control during the afternoon decline, though Wednesday's action will determine whether bears can push toward range lows or if buyers emerge to defend current support levels.
The immediate focus centers on reclaiming $743 which represents the defining gate above current prices where conditions flip back constructive according to our model. Breaking above $743 with conviction opens the pathway toward $745 where the heaviest concentration zone awaits, followed by $747 as the next decision point and ultimately $748 marking the major call wall with $750 capping the expected move's top as maximum upside. On the downside, losing support at $741 becomes the first warning sign for bulls, as this level sits just below current prices and breaking it cleanly would shift the tone quickly given the tenuous recovery. Further deterioration would target $740 where selling could accelerate at this round-number pivot, followed by $738 representing the next major support level with significant put interest stacked there, and ultimately $734 marking the bottom of the expected move where climactic selling would be expected. The market's positioning near the lower end of the wide projected range after Tuesday's decline suggests Wednesday's opening direction will be crucial in determining whether recent weakness continues toward maximum downside targets or stabilizes for a move back toward range highs.
Trading Strategy
The volatile intraday action with elevated participation creates opportunities around key technical boundaries, while the VIX rose 5.76% to 20.01 indicates increased market anxiety that requires more conservative position sizing as stress readings climb from moderate levels. Long entries show potential near the $722-725 support zone where today's sharp selling found buyers, targeting initial profits at $735-738 and extended moves toward $742-745 if bullish momentum emerges despite the heightened volatility environment. The rising anxiety metric suggests implementing wider stops below $720 to accommodate the increased volatility while protecting against any failure of the support structure that absorbed the session's heavy selling pressure.
Short setups present compelling risk-reward on rallies toward the $744-747 resistance area with downside targets at $735-738 and stops above $750, as the elevated stress readings favor defensive positioning over aggressive long exposure in current conditions. The heightened volatility environment demands reduced position sizing while favoring short-bias strategies that align with the increased market uncertainty reflected in the VIX advance. Watch for breakdown patterns below $735 with expanding volume, as institutional selling could accelerate declines toward lower support clusters around the $725-728 level where buyers previously emerged.
Rising market scenarios would support long positioning above $740 with strong confirming volume targeting the $745-750 area, while declining conditions focus on breakdown trades below $730 toward $722-725 zones. Risk management must utilize expanded protection levels around 1.5-2% from entry points given the VIX increase suggests less predictable price action ahead, requiring traders to implement wider stop-loss frameworks rather than standard volatility adjustments. Emphasize momentum-based strategies that can capture directional moves while the combination of modest losses and rising stress readings indicates markets face uncertain conditions that favor cautious approaches with expanded risk controls across both long and short setups.
Model’s Projected Range
SPY's projected maximum range for Wednesday is $731 to $747, with the Put side dominating in an expanding band that suggests trending price action with intermittent chop. Wednesday brings Core CPI m/m, Core CPI y/y, CPI m/m, and CPI y/y data, which are likely to produce significant volatility particularly in the first hour of trading. Today's session saw SPY open at $743.63, reach a high of $746.90, and fall to a low of $722.59 before closing at $737.11, down 0.29%, with the VIX rising 5.76% to 20.01 as selling pressure intensified throughout the day. SPY is trading near our model's first support at $735 as markets digest ongoing concerns about Fed policy and economic data ahead of tomorrow's inflation readings. Looking at Wednesday's outlook, if SPY breaks above the first resistance at $740, it targets the next level at $741, while a break below the first support at $735 would target $731 with potential for further downside if that level fails. The long-term bull trend remains intact above $640 with SPY well above structural support, and as long as price holds above key structural levels, this remains a broader dip-buying environment. Absent a catalyst, resistance sits at $740, $741, $743, $745, while support rests at $735, $731, $730, $725. We favor buying dips at $735 given SPY's position near support in an oversold condition. Bitcoin declined 1.69% to close above $62,027 while MAG stocks showed mostly red action across the board led by Apple down 3.64%, with the exception of Alphabet which gained 0.26%, and sustained weakness across both leadership groups would be required to signal a deeper pullback. The VIX closed at 20.01, up 5.76%, suggesting elevated fear given the sharp intraday selling and uncertainty ahead of Wednesday's inflation data. SPY closed just above the lower line of the trend channel with structural support near $730 maintaining the broader uptrend despite today's weakness.
Market State Indicator (MSI) Forecast
Current Market State Overview:
The MSI ended in Bearish Trending Market State with SPY closing at $737.11. Since SPY closed below MSI support, the MSI support at $738.22 now becomes resistance for the next session with MSI resistance at $742.86 remaining resistance. Extended targets were printing below at the close. The MSI rescaled lower overnight opening the day in a wide bearish state with extended targets below pushing price down through the premarket session. At the open the MSI continued rescaling lower with price rallying briefly to $745 before the bears took control and the MSI began a series of rapid rescalings lower with extended targets below driving price from $745 all the way down to $738 by late afternoon. Extended targets printed for much of the afternoon session keeping price pinned near the lows with SPY closing well below MSI resistance. The wide spread of $4.64 indicates significant room for price movement and the bearish configuration with extended targets below signals continued downward pressure. For Wednesday the MSI is forecasting a strong continuation lower with the bears maintaining pressure and extended targets below suggesting downside momentum will persist. MSI support is $738.22 with resistance at $742.86.
Key Levels and Market Movements:
Monday we stated, "Bulls want to see overnight strength hold current levels and push toward levels above $745," and added, "bears want to see the MSI support level at $738.22 fail to press price toward lower levels around $730 where a bounce is expected," while also noting, "With the MSI closing in Bearish Trending Market State with a wide configuration, Tuesday is likely to continue with strong selling pressure as the MSI forecast indicates a strong continuation lower with bears maintaining pressure and extended targets below suggesting downside momentum will persist." The session delivered exactly what bears wanted as selling pressure overwhelmed the market throughout the day. The MSI started in a wide bearish configuration and continued its series of rapid rescalings lower as bears maintained complete control from the opening bell. The first major setup came when price rallied briefly to $745 at the open but failed to hold, providing a short entry with targets toward the former MSI support level now acting as resistance around $738. As extended targets printed below for much of the afternoon session, each failed bounce attempt offered additional shorting opportunities targeting lower levels. Bears defended every rally attempt with conviction as price was driven relentlessly lower from the $745 high all the way down to session lows near $738, ultimately closing at $737.11 well below all key resistance levels. The wide bearish MSI configuration with extended targets below kept price anchored near the lows as bears maintained their stranglehold throughout the entire session. At minimum it was a 2-for-2 session for traders following the framework. It was a volatile but readable day with substantial setups, all identified through proper context, patience, and flexibility while leveraging the MSI, premarket levels, and market structure rather than forcing trades. The MSI continues to prove its reliability as the cornerstone of our trading process.
Trading Strategy Based on MSI:
Wednesday has heavy economic data with Core CPI and CPI which can introduce significant volatility, so traders should be ready to trade what they see rather than predict. Bulls want to see overnight strength hold current levels and push toward levels above $742, while bears want to see the former MSI support level now acting as resistance at $738.22 continue to cap any rallies to press price toward lower levels around $730 where a bounce is expected. With the MSI closing in Bearish Trending Market State with a wide configuration, Wednesday is likely to continue with strong selling pressure as the MSI forecast indicates a strong continuation lower with bears maintaining pressure and extended targets below suggesting downside momentum will persist. The wide spread of $4.64 indicates significant room for downward movement and bears have established clear control with SPY now trading below the MSI range. Any rally toward the former MSI support level now acting as resistance at $738.22 is a potential shorting opportunity targeting lower levels since there are no MSI targets below current price. Failed rallies toward the resistance level around $738.22 are the highest probability setups, with any strength offering shorting opportunities if bears can defend that level with volume and conviction. Bears need overnight selling pressure to continue below current levels targeting new session lows, while bulls need to see strength reclaim the key $738.22 resistance level and hold it convincingly to shift momentum. The wide bearish configuration with extended targets below suggests bears will maintain control entering Wednesday's session, especially with the CPI data potentially providing additional volatility that could accelerate the downward move. The long-term bull trend remains intact above $640 and failed breakouts and failed breakdowns continue to offer the highest-probability setups. Remain flexible, avoid trading during Ranging Market States unless a clear failed breakout or breakdown presents itself, and ensure all trades are fully aligned with MSI signals. Providing real-time insights into market control, momentum shifts, and actionable levels, the MSI when integrated with our Pre-Market and Post-Market Reports continues to sharpen execution precision and elevate trade quality. If you haven't yet integrated MSI and our model levels into your process, now is the time. Contact your representative to get started as these tools are designed to support consistency and enhance performance.
Dealer Positioning Analysis
Dealers are selling SPY $750 to $764 and higher strike Calls while buying $739 to $749 Calls, indicating the Dealers' desire to participate in any rally on Wednesday. The ceiling for Wednesday appears to be $750. To the downside, Dealers are buying $738 to $700 and lower strike Puts in a 4:1 ratio to the Calls they're selling displaying strong concern that prices could move lower. Dealers are buying ATM Calls looking to participate in any relief rally on Wednesday. Below $725 is bearish and above $745 is bullish with the area in between likely to be choppy and trap filled. Traders should be very careful both shorting and buying into any rally, waiting for the market to make its direction clear before participating. Dealer positioning is unchanged at bearish.
Looking Ahead to Next Friday:
Dealers are selling SPY $752 to $768 and higher strike Calls while buying $739 to $751 Calls, indicating the Dealers' desire to participate in any rally into the end of next week. The ceiling for next week appears to be $752. To the downside, Dealers are buying $738 to $695 and lower strike Puts in a 5:1 ratio to the Calls they're selling displaying strong concern that prices could move lower. Dealers are buying ATM Calls indicating their desire to participate in any relief rally next week but remain heavily hedged implying the dip may get bought but conviction is limited. Dealers remain bullish above $745 but below $725 expect the market to continue lower with heavy chop and two way trappy trading expected between $725 and $745. For the week Dealer positioning is unchanged at bearish. We advise reviewing Dealer positioning daily for directional clues. These positions evolve quickly and tracking them is essential for staying ahead of shifting market sentiment.
Recommendation for Traders
The wide $24.31 trading range ending with a close near session lows at $737.11 signals underlying weakness despite the modest decline. With VIX jumping 5.76% to 20.01 and Treasury yields at 4.530% still above the critical 4.5% threshold, favor short-side opportunities on any bounces toward the $743-746 resistance zone where the session opened and peaked.
Keep position sizes conservative given the elevated volatility and conflicting sector rotation signals. Be sure to review the premarket analysis posted before 9 AM ET for any changes in the model's outlook and Dealer Positioning.
Good luck and good trading!
