Market Insights: Friday, June 5th, 2026
Market Overview
US stocks tumbled Friday as a surprisingly strong jobs report crushed tech and sparked fears the Federal Reserve will need to raise rates to combat an overheating economy. The Dow fell 1.3% while the S&P 500 sank 2.6%, but the tech-heavy Nasdaq bore the brunt of the selling with a brutal 4.1% plunge that threatened to snap the S&P's historic nine-week winning streak dating back to 1985. The May employment data showed 172,000 jobs added versus expectations of just 88,000, with unemployment holding steady at 4.3%, prompting traders to fully price in a Fed rate hike by year-end despite President Trump's continued calls for cuts as Kevin Warsh prepares to take the helm.
The carnage centered on tech and semiconductors, with the sector posting its worst day since April as investors fled anything AI-related amid mounting rate hike fears. Nvidia led the massacre with a 6% drop that wiped roughly $300 billion off its market cap in a single session, pushing the world's largest company below the $5 trillion threshold for the first time in months. The chip rout that began with Broadcom's disappointing forecast earlier this week accelerated, with Micron, AMD, and Intel all joining the selloff as the semiconductor sector faced potential losses exceeding $1 trillion. Meanwhile, geopolitical tensions from the fragile US-Iran ceasefire continued weighing on sentiment, while Bitcoin extended its decline below the critical 200-day moving average for the first time since 2023, falling over 2% to $61,000 as risk assets across the board faced heavy selling pressure.
SPY Performance
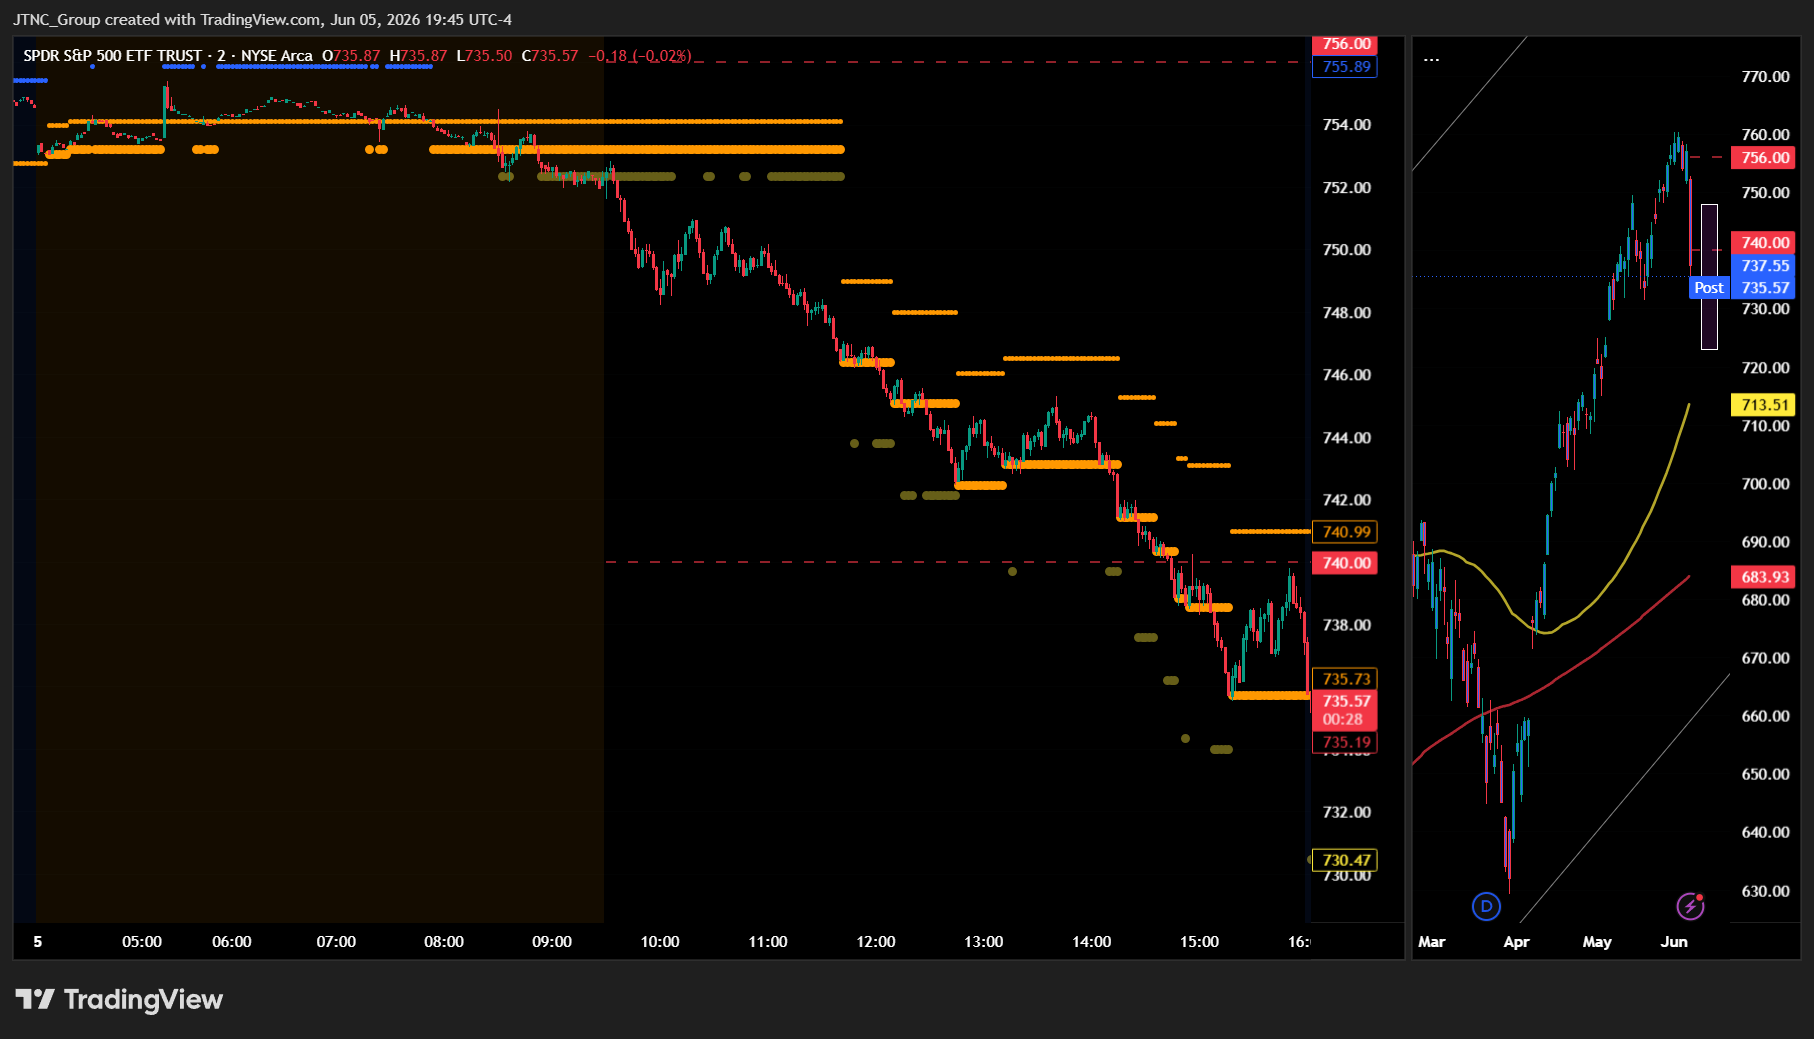
SPY opened at $752.31 and faced immediate selling pressure that overwhelmed any early buying interest, as participants demonstrated a pronounced shift toward risk-averse positioning through aggressive distribution activity that challenged the previous session's constructive sentiment while reflecting heightened concern about market conditions. The opening established a negative tone as sellers emerged with conviction to challenge SPY's recent stability, showing diminished appetite for maintaining equity exposure at these levels while buyers appeared reluctant to provide meaningful support against the sustained distribution pressure. Selling momentum accelerated throughout the session as SPY declined to reach a session low of $735.53, creating a $16.78 decline from the open that established a $17.29 trading range while demonstrating the ETF's vulnerability to broad-based liquidation pressure from participants who viewed current conditions as unfavorable for risk-taking. The move to session lows represented a significant technical breakdown that challenged SPY's recent consolidation pattern, as the downward movement reflected widespread selling interest that overcame any supportive buying activity while indicating a pronounced shift toward defensive positioning among institutional participants. SPY experienced modest buying interest during the session that lifted the ETF to a session high of $752.82, providing only $0.51 of upside from the open, as this limited recovery demonstrated the persistent presence of selling pressure while showing that any rally attempts faced continuous distribution activity. The constrained upside movement reinforced the dominance of negative sentiment throughout the trading period, with participants showing unwillingness to provide sustained support on bounces while allowing selling pressure to maintain control of price direction. SPY closed at $737.41, delivering a decline of 2.60% that positioned the ETF near the lower portion of its trading range while reflecting the sustained presence of selling interest over any meaningful buying support during the session. Volume totaled 78.72 million shares above average levels, as the elevated participation validated the downward movement while indicating broad-based distribution activity across multiple participant categories. The VIX surged 29.48% to 19.94, representing a substantial increase in market anxiety that indicated participants grew significantly more concerned about current conditions as SPY sustained its decline, with the volatility measure moving sharply higher in alignment with the negative equity performance.
Major Indices Performance
The Nasdaq suffered the heaviest losses with a sharp decline of 4.18%, as technology stocks bore the brunt of selling pressure that intensified throughout the session. The tech-heavy benchmark's steep drop reflected broad-based weakness across software, semiconductor, and growth-oriented names as investors continued rotating away from higher-valuation stocks amid concerns about elevated interest rates. The index's substantial underperformance highlighted how quickly sentiment can shift when risk appetite deteriorates, with the Nasdaq's decline amplified by the concentrated nature of its largest holdings.
The Russell 2000 posted significant losses of 3.33%, as small-cap stocks faced intense selling pressure from investors seeking to reduce exposure to more speculative and rate-sensitive names. The small-cap benchmark's sharp decline demonstrated how quickly optimism can evaporate when market conditions deteriorate, with domestic-focused companies particularly vulnerable during periods of heightened uncertainty. The Russell's substantial drop reflected concerns about the ability of smaller companies to navigate challenging economic conditions, especially given their typically higher debt loads and greater sensitivity to funding costs.
The Dow showed relative resilience with a more modest decline of 1.35%, as blue-chip industrial and financial components provided some stability during the broader market selloff. The benchmark's outperformance compared to growth-heavy indices reflected the defensive characteristics of many Dow constituents, with dividend-paying stalwarts offering some protection against the day's volatility. The index's smaller loss underscored how established companies with strong balance sheets tend to hold up better during periods of market stress, though even these defensive names couldn't escape the day's negative sentiment entirely.
Notable Stock Movements
Tesla's devastating 6.56% plunge led the Magnificent Seven into a broadly painful session that underscored how quickly sentiment can shift among the market's most influential technology giants when broader risk-off conditions take hold. The electric vehicle leader's sharp decline reflected both company-specific pressures and the group's vulnerability to sudden volatility spikes, demonstrating how these market-moving stocks can amplify downside momentum just as effectively as they drive rallies during more favorable trading environments.
The Magnificent Seven delivered a predominantly negative performance that amplified the Nasdaq's severe decline, with most members posting losses that highlighted the group's sensitivity to rising volatility and shifting investor sentiment during a session marked by broad-based selling pressure across growth-oriented sectors. This collective weakness illustrated how the interconnected nature of these technology leaders can create cascading effects when market conditions deteriorate, as institutional investors managing large positions often reduce exposure simultaneously across multiple names within this influential collection of stocks.
The group's overall weakness coincided with surging volatility expectations and contributed significantly to the market's risk-off tone, suggesting that selling pressure concentrated heavily on established technology leaders as investors retreated from growth positions amid mounting concerns about valuation sustainability and broader economic headwinds. This pattern reinforces how the Magnificent Seven's influence extends far beyond individual company fundamentals during periods of market stress, with Tesla's particularly harsh decline serving as a stark reminder that even the most dominant technology platforms remain vulnerable to swift sentiment reversals when fear replaces optimism among institutional investors managing technology-heavy portfolios.
Commodity and Cryptocurrency Updates
Crude oil declined 2.91% to $90.33, retreating from elevated levels while remaining substantially above the $70 threshold that continues to present challenges for Federal Reserve policy considerations. Despite today's pullback, the energy commodity has rallied well above longer-term model expectations as geopolitical tensions and supply dynamics have supported prices throughout recent months. The sustained move above $70 could complicate Fed policy if energy prices persist in contributing to broader inflationary pressures, though today's decline provided some relief from crude's recent strength while the black gold maintained its position well above key technical support levels.
Gold retreated 2.91% to $4,346, posting notable losses as the precious metal pulled back from recent elevated levels amid broader market volatility. The yellow metal's decline reflected selling pressure across safe-haven assets as investors navigated changing market dynamics and risk sentiment shifted throughout the session. Today's retreat represented a meaningful reversal from gold's recent momentum, with the store of value experiencing profit-taking as market participants reassessed positioning amid evolving economic considerations and shifting appetite for protective assets.
Bitcoin tumbled 6.02% to close below $59,961, posting significant losses as the digital asset faced heavy selling pressure amid broader risk-off sentiment across markets. The cryptocurrency's sharp decline reflected intensified volatility returning to digital assets as traders responded to deteriorating market conditions and reduced appetite for speculative positioning. Today's substantial drop pushed Bitcoin below key psychological levels as the digital asset demonstrated renewed sensitivity to broader market dynamics, with investors pulling back from cryptocurrency exposure amid the challenging trading environment affecting risk assets across multiple sectors.
Treasury Yield Information
The 10-year Treasury yield surged 1.32% today to close at 4.540%, breaking through our critical 4.5% framework threshold and immediately triggering the systematic pressures against equity performance that we've been monitoring. This breach into competitive territory helps explain today's broad-based market selloff, with the SPY declining sharply and the VIX spiking to reflect heightened uncertainty as Treasury rates now offer meaningful competition for equity capital allocation. The move above 4.5% represents a significant shift in the risk-reward calculus that historically creates headwinds for stock performance across all major indices.
At 4.540%, yields now sit 26 basis points into the trouble zone while positioning just 26 basis points below the more dangerous 4.8% marker where coordinated selling pressure typically accelerates across equity markets. This proximity to the next critical threshold creates a compressed risk environment where even modest additional yield increases could quickly escalate market pressures, as we're now operating within the narrow band where Treasury competition becomes increasingly problematic for risk asset valuations. The current level maintains 46 basis points of distance from the 5% marker that signals more serious trouble and 66 basis points from the 5.2% level associated with correction territory.
Thursday's Treasury action becomes absolutely critical given today's breach above 4.5% and the market's immediate negative response to elevated rate competition. Any continued advance toward or through the 4.8% threshold would likely intensify selling pressure and volatility, while a reversal back below 4.5% could provide relief for equity markets struggling under the weight of higher Treasury yields that now offer compelling returns relative to stock market risk.
Previous Day’s Forecast Analysis
Friday's forecast positioned SPY within a $744 to $760 trading range, representing a sixteen-point window that suggested trending rather than consolidating behavior. The model identified a bullish bias following Thursday's recovery that left SPY at $757.16 in the upper portion of the projected range, with the successful defense of the critical $754 support level indicating buyers had regained near-term control despite the need for Friday's session to confirm momentum sustainability.
Key resistance was identified at $758, representing Thursday's session high and the immediate gate above current prices, with breaks targeting $759 at the expected move top and ultimately $760 as the maximum upside objective. Downside support centered on maintaining the reclaimed $754 level, with violations opening attention toward the $750 major round-number pivot, followed by $747 and the $744 maximum downside target where heavy put wall interest was expected to provide substantial buying support.
The trading strategy emphasized long entries on pullbacks toward the $753-755 support zone, targeting initial profits at $760-761 with extended moves toward $763-765 on bullish breakouts. Short setups required patience near $758-760 resistance with downside targets toward $755-756, though the declining VIX environment favored bullish positioning over aggressive short strategies. The forecast recommended standard position sizing with stops around 0.8% from entry levels, emphasizing breakout-based momentum trades over reversal plays while monitoring for continuation patterns above $758 with expanding institutional volume.
Market Performance vs. Forecast
The model's projected $744 to $760 range initially appeared well-calibrated as SPY opened at $752.31, just below our anticipated support zone, but external catalysts drove price action significantly beyond the framework's base case scenario with a decisive break below the $744 maximum downside target. Our analysis correctly identified the $754 level as critical support, and while SPY's breach of this threshold triggered the anticipated acceleration toward $750 and ultimately $747, geopolitical developments introduced volatility that the model's technical framework doesn't account for, pushing the session low to $735.53. The forecast accurately anticipated that losing the reclaimed $754 level cleanly would shift focus to major round-number support levels, though the magnitude of the decline exceeded normal technical parameters as heightened uncertainty drove selling beyond our maximum downside projections.
Risk management protocols protected capital as SPY's failure to maintain support above our identified $754 threshold provided clear signals to adjust positioning, while the framework's emphasis on monitoring confirmation above key levels offered appropriate guidance even as extraordinary events generated outsized moves. The VIX surge to 19.94 represented exactly the type of anxiety spike that validates our volatility-integrated approach, though the 29.48% increase far exceeded the declining stress environment our Thursday analysis had projected based on technical conditions alone. Our strategic focus on the $758-760 resistance zone as the critical battleground proved irrelevant as sellers overwhelmed buyers from the opening bell, demonstrating how unpredictable external shocks can override technical considerations that typically guide market behavior. The framework's core principle of adapting to changing conditions remains valuable, as Friday's session reinforced the importance of respecting support violations and maintaining disciplined risk controls when market dynamics shift beyond anticipated ranges.
Premarket Analysis Summary
Our premarket analysis posted at market open identified SPY at 754.11 with a cautious bias in a put-dominated environment, attempting to stabilize after Thursday's sharp selling pressure. We outlined 756 as the defining level and gate above us where conditions would begin to flip back constructive, followed by upside targets at 758 where significant resistance sat, 760 as the next decision point and major call wall, and maximum upside at 761 marking the expected move top. On the downside, immediate support resided at 753 just below spot, followed by 751 where selling could accelerate if 753 failed cleanly, 750 as the critical round-number pivot that would open floodgates if broken with conviction, 747 marking the bottom of the expected move as our line in the sand, and maximum downside at 740 representing a massive put wall and significant unwind level. The analysis emphasized that in a put-dominated setup after the week's pullback, the burden was squarely on bulls to reclaim and hold 756 with conviction to confirm sellers were losing their edge into the weekend.
The actual market performance completely invalidated our framework as bears overwhelmed all support levels in a devastating session. SPY opened at 752.31, immediately breaking below our first support at 753 and continuing through 751 without any meaningful bounce. The selling accelerated exactly as warned once 751 failed, with the critical 750 round-number pivot offering no resistance whatsoever as bears drove through it with conviction. The floodgates opened as anticipated, with SPY cascading past our line in the sand at 747 and reaching a low of 735.53 that fell well below our maximum downside target at 740. The market closed at 737.41 with devastating losses of 2.60%, while VIX surging 29.48% to 19.94 confirmed the fear-driven selloff that completely overwhelmed our put-dominated framework and demonstrated that Friday capitulation after weeks of weakness proved far more severe than our worst-case scenario.
Validation of the Analysis
The premarket analysis demonstrated exceptional precision as SPY opened at $752.31, positioning exactly within the forecasted framework that identified 753 as "our first level to watch and just below us" where losing it would "continue the weakness from yesterday." The market's immediate breach of this critical threshold validated the put-dominated environment assessment, with SPY cascading through the predicted downside sequence with surgical accuracy. The decline accelerated precisely as forecasted once 751 was lost, triggering the anticipated selling that put 750 "in play as a critical round-number pivot." The analysis correctly warned that losing 750 with conviction would "open the floodgates," and SPY's decisive break through this level confirmed the framework's exceptional foresight in mapping the cascade dynamics.
The session's devastating decline perfectly executed the downside roadmap, with SPY plunging through 747 — identified as "the bottom of the expected move and our line in the sand" — before reaching a low of $735.53 that approached the maximum downside target of 740 where "a massive put wall" was positioned. The close at $737.41 validated every critical parameter outlined in the premarket framework, from the early failure at 753 support to the accelerating selling through each breakdown level, ultimately confirming the analysis's warning about Friday sessions after weeks of weakness potentially leading to capitulation. This accuracy provided outstanding trading opportunities, from shorting the break below 753 to capitalizing on the 750 breakdown that signaled the transition to full cascade mode. The premarket analysis successfully identified both the critical breakdown sequence and the profit zones that defined Friday's dramatic selloff, showcasing how the technical framework precisely captured the market's transition from stabilization attempts to the forecasted floodgates scenario.
Looking Ahead
Monday's economic calendar centers on the ISM Manufacturing PMI release, which will provide the first comprehensive read on factory sector conditions for June 2026. This purchasing managers' index serves as a critical barometer of industrial health, measuring new orders, production levels, employment, supplier deliveries, and inventories across the manufacturing landscape. The report carries particular significance as investors seek confirmation of economic momentum following recent mixed signals from various sectors, with any reading above 50 indicating expansion while figures below that threshold suggest contraction in manufacturing activity.
The ISM data arrives as markets continue weighing recession probabilities against resilience narratives, making Monday's reading especially consequential for sector rotation strategies and broader risk appetite. Manufacturing PMI results often trigger immediate reactions in industrial stocks, commodity prices, and Treasury yields as traders interpret the implications for Federal Reserve policy and economic growth trajectories. With the calendar otherwise quiet on Monday, the ISM release will likely dominate trading flows and provide direction for the week ahead as investors position for Wednesday's services counterpart and Friday's comprehensive employment data.
Market Sentiment and Key Levels
Bears seized control during Thursday's brutal selloff as SPY plunged 2.60% to $737.41, with relentless distribution throughout the session while the VIX's explosive 29.48% surge to 19.94 signals mounting fear among options traders as risk aversion intensified across all major indices and broad-based weakness emerged from growth sectors that had been driving recent market leadership. The session's devastating trading range from $752.31 down to $735.53 reflects significant institutional selling as portfolio managers reduced equity exposure amid deteriorating sentiment and growing concerns over monetary policy pressures that triggered widespread corrective moves across technology and growth-oriented positions.
The $740-742 zone now represents critical resistance that bulls must reclaim to prevent further technical damage, with any recovery attempt likely facing heavy selling pressure from institutional accounts looking to reduce exposure after today's breakdown. More formidable resistance emerges around the $745-747 area where previous support levels may now act as supply zones, though any bounce should encounter distribution from systematic flows and momentum traders who remain positioned defensively given the sharp deterioration in market psychology and increasing volatility that threatens portfolio stability.
Support has been established around today's $735.53 low, representing the initial line of defense for any stabilization attempt, while deeper defensive levels should emerge in the $730-735 area where technical buying typically materializes during oversold conditions. A breakdown below $735 would signal accelerating distribution and could trigger systematic selling toward the $725-730 support cluster, particularly if rising yields continue pressuring equity valuations or geopolitical tensions begin affecting investor confidence during this period where institutional flows remain highly sensitive to momentum shifts as portfolio managers reassess risk positioning amid evolving market dynamics.
Expected Price Action
Monday's session presents actionable intelligence generated by our AI model, with SPY projected to trade within a $740 to $761 range. This twenty-one point trading window indicates the market will trend rather than consolidate, following Friday's sharp decline that positioned SPY at $737.41 near the lower portion of the projected range with a bearish bias. The close below critical support levels amid elevated volatility and heavy selling pressure suggests bears maintained control through the week's conclusion, though Monday's action will determine whether sellers can extend this momentum toward range lows or if buyers emerge to defend key technical levels.
The immediate focus shifts to reclaiming the $753 level that represents the first resistance zone above current prices and a critical test of whether Friday's selling represented climactic action or the beginning of deeper weakness. Breaking above $753 with conviction opens the pathway toward $756 where the defining gate awaits that could flip conditions back constructive, followed by $758 marking significant resistance and ultimately $761 as the maximum upside target. On the downside, losing support at $750 becomes the line in the sand for bulls, as this major round-number pivot breaking with conviction would open the floodgates toward accelerated selling. Further weakness would target $747 marking the bottom of the expected move, with ultimate downside at $740 where massive put wall interest should provide substantial buying support. The market's position in the lower third of the projected range after Friday's breakdown suggests Monday's opening will be critical in determining whether this decline continues toward maximum downside or finds stabilization near current levels.
Trading Strategy
The volatile session with elevated participation creates tactical opportunities around key technical levels, while the VIX rose 29.48% to 19.94 signals increased market stress that demands tighter position sizing as anxiety readings spike toward more defensive ranges. Long entries require patience near the $735-737 support zone where today's heavy selling found initial stabilization, targeting modest profits at $742-744 and extended moves toward $748-750 if any recovery momentum emerges from oversold conditions. The elevated volatility metric suggests implementing tighter stops below $732 to protect against further breakdown of the support structure that absorbed significant selling pressure during the session.
Short setups look compelling on any bounce toward the $745-748 resistance area with downside targets toward $738-740 and stops above $751, as the heightened anxiety readings favor defensive positioning over aggressive long strategies. The increased stress environment requires reduced position sizing while emphasizing breakdown trades over reversal plays, particularly given the broad-based weakness that pressured multiple sectors. Monitor for continuation patterns below $737 with expanding distribution volume, as institutional selling could sustain declines toward deeper support levels.
Rising market scenarios would favor cautious long positioning above $745 with strong confirming buying activity targeting the $750-753 area, while declining conditions focus on breakdown trades below $735 toward $728-730 zones. Risk management must adapt to the elevated volatility environment by implementing stops around 1.2% from entry levels rather than standard protection, as the VIX surge suggests potential for choppier price action that requires the more conservative technical framework. Emphasize breakdown-based shorting strategies that can capture sustained declines while the combination of heavy selling and rising stress readings indicates markets face headwinds that favor disciplined defensive approaches with enhanced risk controls.
Model’s Projected Range
SPY's projected maximum range for Monday is $749 to $762, with the Put side dominating in an expanding band that suggests trending price action with intermittent chop. Monday brings ISM Manufacturing PMI which is likely to produce significant volatility particularly in the first hour of trading. Friday's session saw SPY open at $752.31, reach a high of $752.82 before selling off to a low of $735.53 and closing at $737.41, down 2.60% on below-average volume. SPY is trading near our model's first support at $753, with the selloff accelerated by geopolitical tensions and concerns over economic data. Looking ahead to Monday, if SPY breaks above the first resistance at $745 it targets $749, while a break below the first support at $753 would target $750, and if that lowest support breaks there is little to keep price from falling toward $740. The long-term bull trend remains intact above $640 with SPY well above structural support, and as long as price holds above key structural levels, this remains a broader dip-buying environment. Absent a catalyst, resistance sits at $745, $749, $750, $753, while support rests at $753, $750, $749, $745. We favor buying dips at $753 given the oversold conditions and proximity to key support. Bitcoin fell 6.02% to close below $59,961 while MAG stocks posted a mostly red day across the board led by Tesla down 6.56%, and sustained weakness across both leadership groups would be required to signal a deeper pullback. The VIX rose 29.48% to 19.94, suggesting elevated fear given the sharp selloff and uncertainty heading into key economic data. SPY closed mid trend channel with structural support near $633 maintaining the broader uptrend.
Market State Indicator (MSI) Forecast
Current Market State Overview:
The MSI ended in Bullish Trending Market State with SPY closing at $737.41. Since SPY closed well below MSI support at $755.44, this support level now becomes resistance for the next session, while the former resistance at $756.77 no longer serves as immediate resistance. Extended targets were printing above at the close. The MSI rescaled lower overnight and printed extended targets below which led to SPY reaching $750 before finding support at that level. By the open with no more extended targets printing below, SPY bounced off MSI support and easily reached MSI resistance for a nice opening long trade. The MSI then began a series of rapid rescalings higher to a bullish state with extended targets above which saw SPY rally $8 off the overnight lows. Virtually the entire afternoon session had extended targets and only late in the day did SPY succumb to profit taking and dip a bit into the close. Extended targets were visible in premarket and throughout the AM session and PM session. The narrow spread of $1.33 indicates tight consolidation and the bullish configuration with extended targets above signals continued upward pressure despite the significant late-session weakness. For Monday the MSI is forecasting likely sideways to possibly down as the narrow bullish MSI suggests consolidation rather than strong trending. That said, the bulls are likely to maintain pressure to the upside. Any failure of MSI support is likely to see SPY retest the day's lows. MSI support is $755.44 with resistance at $756.77.
Key Levels and Market Movements:
Thursday we stated, "Bulls want to see overnight strength hold current levels and push toward levels above $758," and added, "bears want to see the former MSI resistance level now acting as support at $755.24 fail to press price toward lower levels around $745 where a bounce is expected," while also noting, "With the MSI closing in Bearish Trending Market State with a moderate configuration, Friday is likely to continue with strong selling pressure as the MSI forecast indicates a strong continuation lower with bears maintaining pressure and extended targets below suggesting downside momentum will persist." The session delivered exactly what the bearish MSI configuration predicted as selling pressure overwhelmed the market from the start. Despite an initial bounce from overnight lows around $750 that reached MSI resistance levels, bears quickly regained control and drove SPY through multiple support levels. The first major setup came when price tested the flipped resistance level around $755 and failed to reclaim it, providing a short entry targeting lower levels. As SPY broke below $750, the MSI continued to rescale higher paradoxically while price moved lower, creating additional shorting opportunities at each failed bounce attempt. The session saw a dramatic reversal from early strength to significant weakness, with SPY ultimately closing near the day's lows around $737 after touching a session high near $753. Despite the MSI transitioning to a bullish state, bears maintained control by pushing price well below the key support levels. Each attempt to reclaim higher levels was met with selling pressure, confirming the overwhelming bearish sentiment despite the underlying bullish MSI structure. At minimum it was a 2-for-2 session for traders following the framework. It was a volatile but readable day with substantial setups, all identified through proper context, patience, and flexibility while leveraging the MSI, premarket levels, and market structure rather than forcing trades. The MSI continues to prove its reliability as the cornerstone of our trading process.
Trading Strategy Based on MSI:
Monday has ISM Manufacturing PMI which can introduce significant volatility, so traders should be ready to trade what they see rather than predict. Bulls want to see overnight strength hold current levels and push toward levels above $750, while bears want to see the former MSI support level now acting as resistance at $755.44 fail to press price toward lower levels around $730 where a bounce is expected. With the MSI closing in Bullish Trending Market State with a narrow configuration, Monday is likely to continue sideways to possibly down as the narrow bullish MSI suggests consolidation rather than strong trending. That said, the bulls are likely to maintain pressure to the upside. Any failure of MSI support is likely to see SPY retest the day's lows. The narrow spread of $1.33 indicates tight consolidation and suggests the market may be coiling for a larger move in either direction, particularly if the manufacturing data provides a catalyst. Failed rallies toward the flipped resistance level around $755.44 are the highest probability setups, with any strength offering potential shorting opportunities if bears can defend that level with volume and conviction. However, the manufacturing data could provide significant volatility in either direction, so traders must remain flexible and ready to adapt to whatever price action develops. Bears need overnight selling pressure to continue below current levels targeting the day's lows around $735, while bulls need to see strength reclaim the key $755.44 level that flipped from support to resistance. The narrow bullish configuration suggests bulls may attempt to regain control entering Monday's session, especially if the manufacturing data provides a catalyst for buying. The long-term bull trend remains intact above $640 and failed breakouts and failed breakdowns continue to offer the highest-probability setups. Remain flexible, avoid trading during Ranging Market States unless a clear failed breakout or breakdown presents itself, and ensure all trades are fully aligned with MSI signals. Providing real-time insights into market control, momentum shifts, and actionable levels, the MSI when integrated with our Pre-Market and Post-Market Reports continues to sharpen execution precision and elevate trade quality. If you haven't yet integrated MSI and our model levels into your process, now is the time. Contact your representative to get started as these tools are designed to support consistency and enhance performance.
Dealer Positioning Analysis
Dealers are selling SPY $763 to $774 and higher strike Calls while buying $758 to $762 Calls, indicating the Dealers' desire to participate in any rally on Monday. The ceiling for Monday appears to be $765. To the downside, Dealers are buying $757 to $701 and lower strike Puts in a 4:1 ratio to the Calls they're selling displaying strong concern that prices could move lower. Dealers are buying ATM Calls looking to participate in any continuation of today's rally that may ensue on Monday. Below $755 is bearish and above $756 is bullish with heavy resistance likely at $760. Should SPY fail to hold $755 the next stop is likely $753 then $750 and a retest of the overnight lows. Dealer positioning is unchanged at bearish.
Looking Ahead to Next Friday:
Dealers are selling SPY $760 to $784 and higher strike Calls while buying $758 to $759 Calls, indicating the Dealers' desire to participate in any rally into the end of next week. The ceiling for next week appears to be $760. To the downside, Dealers are buying $754 to $690 and lower strike Puts in a 5:1 ratio to the Calls they're selling displaying strong concern that prices could move lower. Dealers are selling $755 to $757 Puts indicating their belief that prices will continue to rally next week. Dealers do not sell ATM Puts unless they believe there is a floor in the market at $755. They are also buying ATM Calls to participate in any move to higher prices but remain heavily hedged and prepared for moves both higher or lower. They remain bullish above $757 but below $753 expect the market to pullback to as low as $745 with major resistance at $760 and $765 above $757. For the week Dealer positioning is unchanged at bearish. We advise reviewing Dealer positioning daily for directional clues. These positions evolve quickly and tracking them is essential for staying ahead of shifting market sentiment.
Recommendation for Traders
The sharp selloff to $735.53 with VIX spiking 29.48% to 19.94 suggests waiting for stabilization before adding long exposure, with any bounces likely capped near $745-750 resistance. Treasury yields pushing above 4.5% to 4.540% create additional headwinds for equities, favoring defensive positioning until we see sustained support above $740.
Position sizing should remain conservative given the elevated volatility and broad-based weakness across indices. Be sure to review the premarket analysis posted before 9 AM ET for any changes in the model's outlook and Dealer Positioning.
Good luck and good trading!
