Market Insights: Friday, June 5th, 2025
Market Overview
U.S. stocks edged lower Thursday as traders adopted a cautious stance ahead of Friday’s pivotal jobs report, which is expected to clarify the Federal Reserve’s next policy moves. The S&P 500 slipped 0.5%, the Dow dropped 0.3%, and the Nasdaq lagged with a decline of 0.8%. The market was pressured by weakness in large-cap tech and renewed geopolitical tension following a public rift between President Trump and Tesla CEO Elon Musk. At the same time, Procter & Gamble weighed on sentiment with news it will cut up to 7,000 jobs over the next two years.
One of the day’s biggest stories was the explosive breakout in silver, which surged to a 13-year high above $35.90 per ounce. The rally was driven by ongoing tariff uncertainty, a softening U.S. dollar, and a backdrop of declining investor confidence in fiscal discipline following the House’s passage of Trump’s debt-raising tax bill. Analysts noted that silver’s smaller market size makes it prone to outsized moves, especially when retail investors join the action. Some warn that silver is now technically overbought and could pull back sharply, but the underlying supply-demand imbalance gives the move staying power. With cumulative deficits in silver supply since 2021 and a bullish outlook supported by industrial demand, many see room for further gains.
SPY Performance
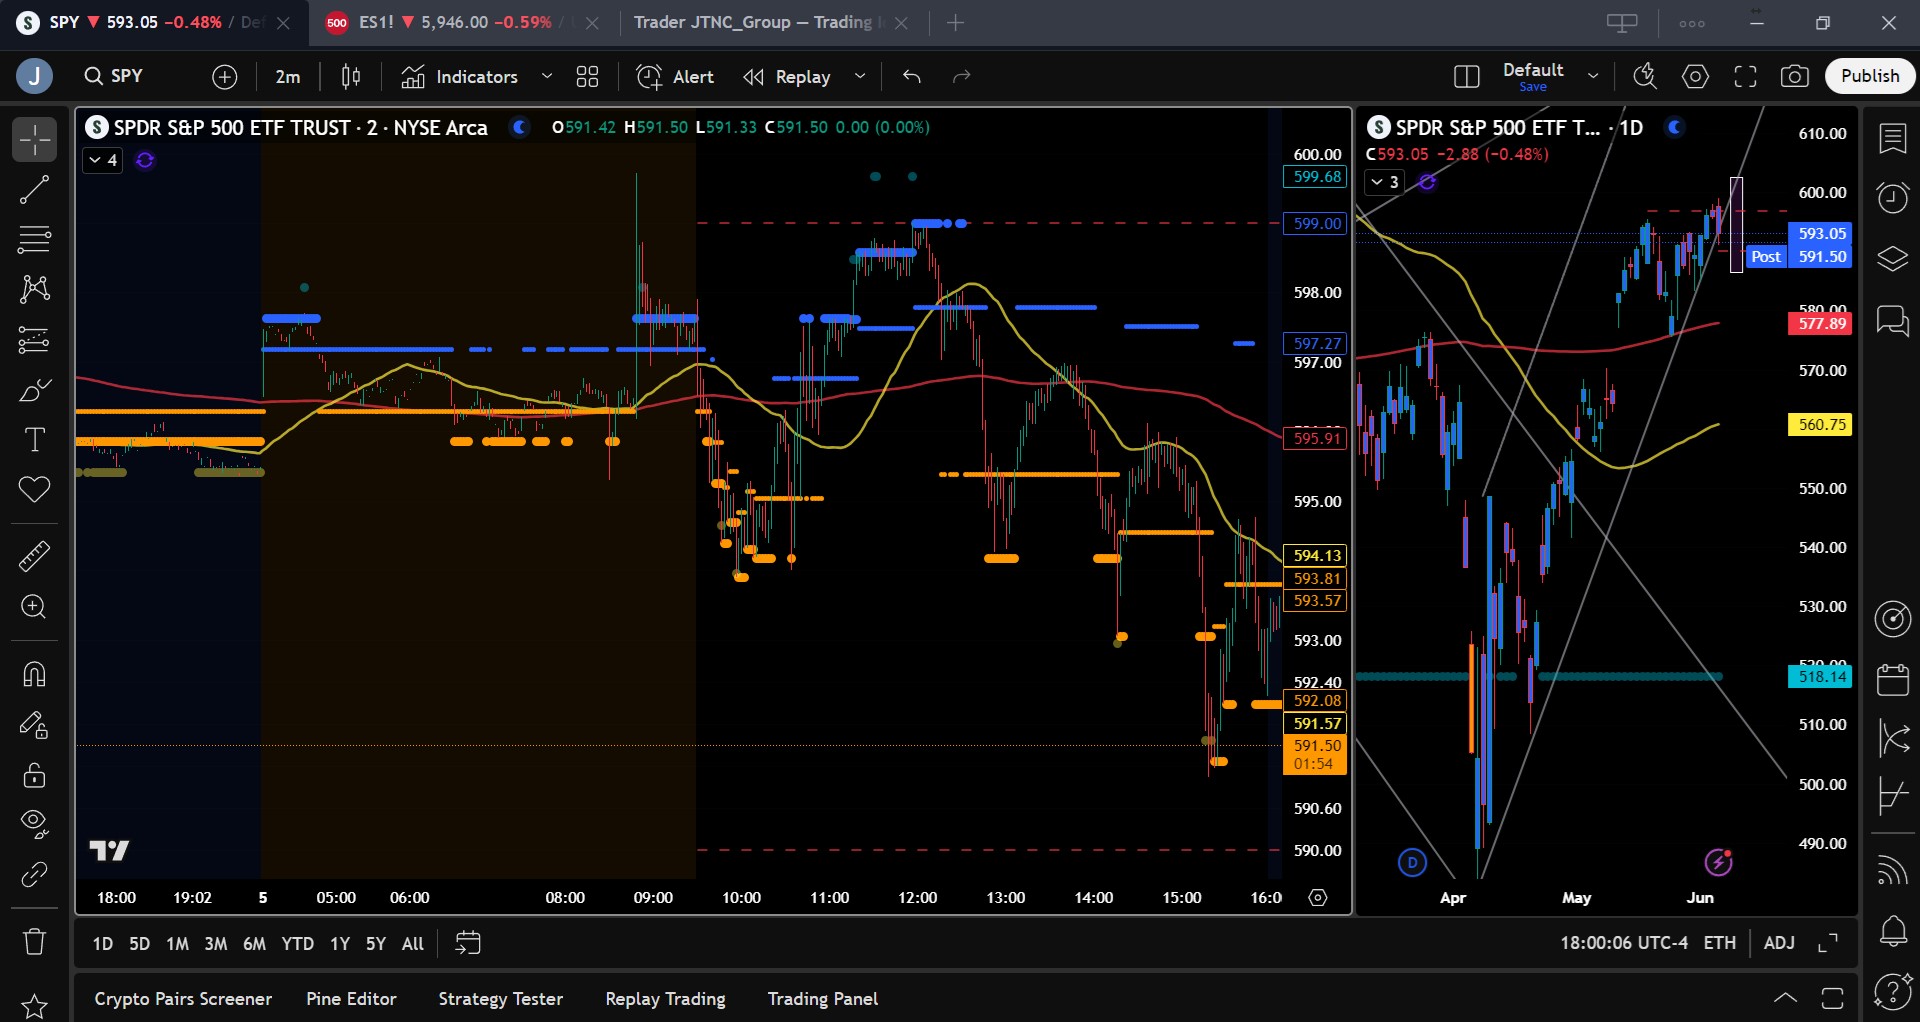
SPY declined 0.48% on Thursday to close at $593.05 after opening at $597.65. The ETF reached a session high of $599 and slipped to a low of $591.06 before settling near the lower end of the day’s range. Volume spiked to 85.79 million shares, well above average, signaling possible profit-taking and reduced risk appetite ahead of Friday’s job data. Despite the broader pullback, SPY held key support levels, but the inability to sustain moves above $598 suggests growing hesitation as the market digests economic uncertainty and geopolitical risk.
Major Indices Performance
The Russell 2000 was the day’s most resilient performer, dipping just 0.02%, while the Dow lost 0.25% amid weakness in consumer staples and financials. The S&P 500 fell 0.5% and the Nasdaq underperformed with a 0.83% decline, dragged down by large-cap tech names and renewed drama between Trump and Elon Musk. Overall, Thursday’s session reflected risk aversion, with traders repositioning ahead of Friday’s critical labor market update. Sector rotation remained modest, though there was a mild shift toward defensive names as volatility picked up.
Notable Stock Movements
A mixed day punctuated by Tesla which fell sharply by 14.26% amid political tension with the Trump administration. Nvidia, Apple and Meta also dipped while the others rose slightly. Tesla’s plunge was a clear signal that market sentiment can shift quickly when politics intersect with corporate headlines. Overall, the group remains crucial to broader market direction, and leadership rotation among them continues to dictate short-term sentiment swings.
Commodity and Cryptocurrency Updates
Crude oil rose 0.81% to settle at $63.34, making a short-term bounce even as our model continues to project a longer-term move toward $50. We remain cautious on oil despite the brief rally, expecting renewed dollar strength to cap gains. Gold advanced 0.57% to $3,379, buoyed by safe-haven demand and the same geopolitical uncertainty fueling silver. Meanwhile, Bitcoin dropped 3.15%, closing just above $101,300. While we remain buyers between $83,000 and $77,000, we caution that levels below $77,000 still carry significant downside risk due to fragile market sentiment.
Treasury Yield Information
The 10-year Treasury yield held nearly flat on Thursday, slipping just 0.02% to finish at 4.393%. While this marks a slight decline, yields remained anchored near their lowest levels in weeks, reflecting persistent caution among bond investors. Traders are waiting for Friday’s jobs report, which could either confirm economic softening and justify further yield declines or surprise to the upside and trigger a bond selloff. Yields remain below the key 4.5% threshold that typically pressures equities, but any spike above 4.8% would raise alarms for stock investors.
Previous Day’s Forecast Analysis
Thursday’s forecast projected a trading range between $593 and $600, with a bullish bias above $595. Upside targets were $598, $600, and $604, while downside targets were $590, $587, and $585. The model emphasized long trades above $595 and warned that a break below $593 could lead to a retest of lower support zones. The strategy favored buying into support and staying cautious around overhead resistance. The potential for false breakouts was highlighted, particularly with momentum stalling ahead of Friday’s key jobs data. This forecast gave traders a flexible game plan for range-bound trading with clearly defined risk zones.
Market Performance vs. Forecast
SPY’s actual performance closely aligned with the forecast, validating the anticipated trading range and cautionary tone. The ETF opened strong at $597.65, briefly hit a high of $599, and then reversed sharply to a low of $591.06 before closing at $593.05. This confirmed the model’s warning that resistance at $598 would be tough to break without strong volume. SPY also dipped below $595, triggering the expected test of the $593 level, and came close to the $590 zone before stabilizing. Traders who followed the forecast’s guidance to stay long above $595 or wait for breakdowns below $593 likely navigated the choppy session with confidence. The forecast effectively flagged the likely range and offered timely insights into intraday sentiment.
Premarket Analysis Summary
In Thursday’s premarket analysis posted at 8:02 AM, SPY was trading at $596.15 with a noted bias level at $596. The analysis expected continued chop around the mid-zone, with upside targets of $598, $599, and $603, while downside levels were set at $596, $595, and $590. The report favored long setups above $596 but cautioned that slipping below this level could invite chop and downside tests of $594 and $590. The commentary suggested traders avoid short trades unless SPY dropped through $594, reinforcing a careful stance ahead of Friday’s major economic release.
Validation of the Analysis
Thursday’s market action validated the premarket plan with strong accuracy. SPY held near the bias level early but failed to gain traction above $596, quickly reversing and dropping through $595 and testing support around $591. The initial upside target zone of $598–$599 was briefly reached before the sharp reversal confirmed that the upside lacked conviction. The analysis correctly warned of chop below $596 and anticipated the test of $590, which came close as SPY hit a low of $591.06. Traders who acted on this forecast would have benefited from clearly defined short-term ranges and pivot zones that captured the session’s tone and direction.
Looking Ahead
Friday brings the all-important Jobs Report, the single most anticipated economic release of the week. This report has the power to swing market sentiment decisively. A strong print may challenge the Fed’s dovish lean and push yields higher, while a weak number could bolster hopes for rate cuts. Either way, expect volatility. Beyond Friday, next week begins quietly but heats up midweek with Core CPI on Wednesday, Core PPI and jobless claims on Thursday, and UoM Consumer Sentiment on Friday. Traders should prepare for a wave of economic data that may reshape the current trend.
Market Sentiment and Key Levels
SPY closed Thursday at $593.05, holding just above key support at $590 but failing to reclaim Wednesday’s highs near $599. The market remains range-bound within the broader $575–$595 zone, although the uptrend from April has started to show signs of fatigue. Resistance remains strong at $596, $600, and $605, while support lies at $590, $585, and $580. With momentum fading, bulls must hold $590 to preserve the recent breakout attempt. A move above $596 could set up a test of $600 and possibly $605, but a break below $590 risks pushing SPY back toward the lower edge of the channel. Traders should remain nimble as headline risks remain elevated.
Expected Price Action
Our AI model projects a wide trading range between $586 and $600 for Friday, signaling potential for breakout or breakdown action driven by economic data. This is actionable intelligence: if SPY holds above $590, a move toward $595 and even $600 is likely, particularly if the jobs report underwhelms and bolsters rate-cut expectations. Conversely, if SPY breaks below $590, a retest of $585 or even $580 could unfold quickly. With the market teetering between fading momentum and bullish aspirations, traders should prepare for sudden reversals. This session could be decisive, and failed breakouts or breakdowns will offer the highest-quality trade setups.
Trading Strategy
Long trades remain favored as long as SPY holds above $585, with targets at $595, $598, and potentially $600. If momentum surprises to the upside, $603 and $605 come into play. If SPY breaks below $585, expect downside tests of $580 and potentially $575, where institutional buyers have previously stepped in. Short trades should be reserved for failed breakouts near $597 or rejections at $600, with profits taken quickly given the choppy tone of the market. The VIX rose 4.94% to 18.48, suggesting that volatility is picking up and traders should tighten stops and reduce position sizes accordingly. Risk management is key in this uncertain environment.
Model’s Projected Range
The model projects a maximum range for SPY on Friday is $586.50 to $602.50, with the Put side dominating in a widening band suggesting trending price action on Friday. Today's rise in Unemployment Claims suggests a weakening U.S. economy, potentially exacerbated by ongoing trade tensions. Tomorrow’s Jobs report could be a major catalyst, with the potential to move SPY by $10 or more in either direction, so be prepared. A disappointing report might pave the way for lower interest rates, which typically support equities. However, since job growth is a key engine of the U.S. economy, a significant miss could outweigh the benefits of lower rates. Until then, prices are likely to stay range-bound heading into the release. Meanwhile, the escalating feud between Trump and Musk rattled markets today. Traders should remain vigilant for any breaking news that could further sway sentiment. In the absence of such external shocks, the bullish narrative remains intact as long as SPY holds above $585. Momentum has clearly stalled, as our model anticipated. While we broke last week’s highs, briefly reaching $599, the market now faces a pivotal moment; will it consolidate or surge to new all-time highs? Our model remains neutral at this stage. Unless SPY closes below $585, we defer to the prevailing uptrend. Key resistance levels are now seen at $596, $600, and $605, while support sits at $590, $585, and $580. SPY ended the day at the lower boundary of a steep, uncorrected bull channel that began in April. The current rate of ascent appears unsustainable, and any further weakness may force a redraw of the trend channel or signal the end of this recent rally. Above $600, resistance thickens quickly into the $605 zone, potentially capping upside. On the downside, firm support has formed between $590 and $585. Without a fresh catalyst, SPY is likely to remain within the broader $575–$595 range that has contained price action since May 13. If SPY holds above $590 on Friday, a move toward $595 and possibly $600 is plausible. A drop below $590 could signal a retreat toward $585, critical support for the bullish case. Trading volume on Thursday came in above average, suggesting profit-taking amid growing concern over macro and geopolitical factors. Since early April, market direction has been largely driven by macroeconomic data, bond yields, inflation readings, tariff headlines, and fiscal policy. This trend is likely to persist absent a significant policy shift. Meanwhile, the VIX rose 4.94% to close at 18.48, still well below the key 23 threshold that typically favors equities. However, today’s uptick signals rising investor anxiety, increasing the potential for price instability on negative surprises. Given the continued uncertainty, traders should remain nimble and responsive as new data rolls in.
Market State Indicator (MSI) Forecast
Current Market State Overview:
The MSI is currently in an average width Bearish Trending Market State with SPY closing just below MSI resistance. No extended targets were printing at the close. Overnight the MSI rescaled lower to a ranging state with brief moments of a very narrow bearish state. By the open and after poor unemployment numbers, SPY popped to the day’s highs with the MSI returning to a very narrow bullish state. By the open the rally had faded and MSI rescaled lower to a ranging state then several rescales lower in a bearish state with brief periods of extended targets below. The MSI range was quite narrow and as such, the move lower did not hold and the MSI reversed and began rescaling higher, again through a ranging state to a bullish state with extended targets above. SPY reached $599 before noon then the feud between Elon Musk and Trump erupted and TSLA dropped 15% and the market with it, with the MSI moving quickly to a bearish state. The range was not overly wide and while there were extended targets printing below, they were sporadic and not wide spread. This implied a likely fake breakdown that would be bought at major support. This came just above $591 and the market reversed into the close to end with the MSI in an average size bearish state. We suspect overnight this move through all three MSI states continues with the current state implying a weak bear trend which is likely to reverse. Currently MSI support stands at $592.00 with resistance at $593.81.
Key Levels and Market Movements:
On Wednesday, we noted: “Should new headlines emerge, the best approach remains to trade the market in front of you.” We also said: “In the absence of a major catalyst, we anticipate a continuation of the current environment, virtually identical to yesterday’s setup, with SPY potentially testing $593 overnight and advancing toward $598 or even $600.” Finally, we added: “Tactical shorts may be considered above $597, but only if a breakout attempt fails and MSI shows signs of weakening.” With this actionable intelligence in hand, we entered at the open with SPY setting up a textbook failed breakout in the premarket, trading just below $598. The MSI was in a narrow bullish state, showing no extended targets above. This aligned with our plan, so we initiated a short, targeting the premarket level of $596. The MSI cooperated, rescaling lower. We held for $596, then consulted the MSI for a second target. As it continued to rescale lower, we took T2 at $595 and trailed the remaining 10%. Although the MSI continued drifting down, the price action remained narrow and unconvincing. Recognizing that bulls were still in control of the broader market, we closed the short position at $594.25 and reversed long on a less-than-perfect failed breakdown. We set our first target at the premarket level of $596, just shy of MSI resistance. By 10:30 am, we hit this level and looked to the MSI for a second target. SPY quickly retraced to our entry. Because our rules say to wait for T2 before moving stops to breakeven when trading with the trend, we remained in the trade. We didn’t reload on the dip as it was too fast and didn’t form a proper failed breakdown. Fortunately, price reversed again, echoing the prior day’s behavior, and we reached our second target at $596.80. The MSI then rescaled higher, so we trailed our final 10%, ultimately exiting at the MSI resistance and premarket level of $599. But our day wasn’t over. As extended targets stopped printing above and the market approaching a major level where the premarket level and MSI resistance converged, we entered a short just below $599. Our first target was MSI support at $597.80, satisfying our $1 minimum rule. Then news about Musk hit, and the MSI rescaled lower. We patiently held, taking T2 at MSI support at $595 and closing the final 10% at $594.30 deciding to protect profits after a three for three day. Three trades. Three wins. Done by 1 PM. While there was plenty of action left in the day, we rarely exceed three trades; most days, it’s one or two. We focus only on high-quality setups, made possible by a clear, structured plan, disciplined execution, and strategic use of MSI insights to identify control, timing, and actionable levels. When integrated into our trading framework, the MSI remains indispensable for consistency and performance.
Trading Strategy Based on MSI:
The Monthly Jobs Report is likely to set the tone for Friday’s session. Until its release, headlines from the White House remain the primary risk catalyst. Should any surprises emerge, the best approach remains to trade the market in front of you. In the absence of a major catalyst, SPY could swing up or down $10 on Friday, suggesting the potential for trending behavior. Be prepared to align with the trend and stay with it using the MSI as your guide. Our model anticipates a slight overnight recovery followed by sideways movement leading into the jobs report. Once the data hits, you must trade what you see. Despite Thursday’s sharp decline, upward momentum remains intact, and dips continue to be bought. As long as SPY holds above $590 on Friday, upside potential extends to $605. A break below $590 shifts the focus to $585, and a failure there could open the door to a deeper pullback toward $580 or lower. Such a move would likely mark a critical inflection point, signaling a potential shift of control to the bears and bringing the $575–$595 range where institutions have actively hedged, back into play. Absent a breakdown, the path of least resistance remains higher. A sustained move above March’s highs could open the way to new all-time highs. We continue to favor long setups, with key support down to $585. Tactical shorts may be considered above $597, but only if a breakout attempt fails and MSI shows signs of weakening. As long as SPY holds above $585, long positions remain favorable. A sustained move below this level could bring renewed bearish pressure. Failed breakdowns remain high-quality long opportunities. Stay alert and responsive as these setups develop. Avoid engaging during Ranging Market States and always align your strategy with the MSI. The MSI provides real-time insight into market control, momentum shifts, and actionable levels. When combined with our Pre-Market and Post-Market Reports, it enables more precise execution and higher-probability trades. If you haven’t yet integrated the MSI and model levels into your trading process, now is the time. Contact your representative to get started as these tools can meaningfully enhance both consistency and performance.
Dealer Positioning Analysis
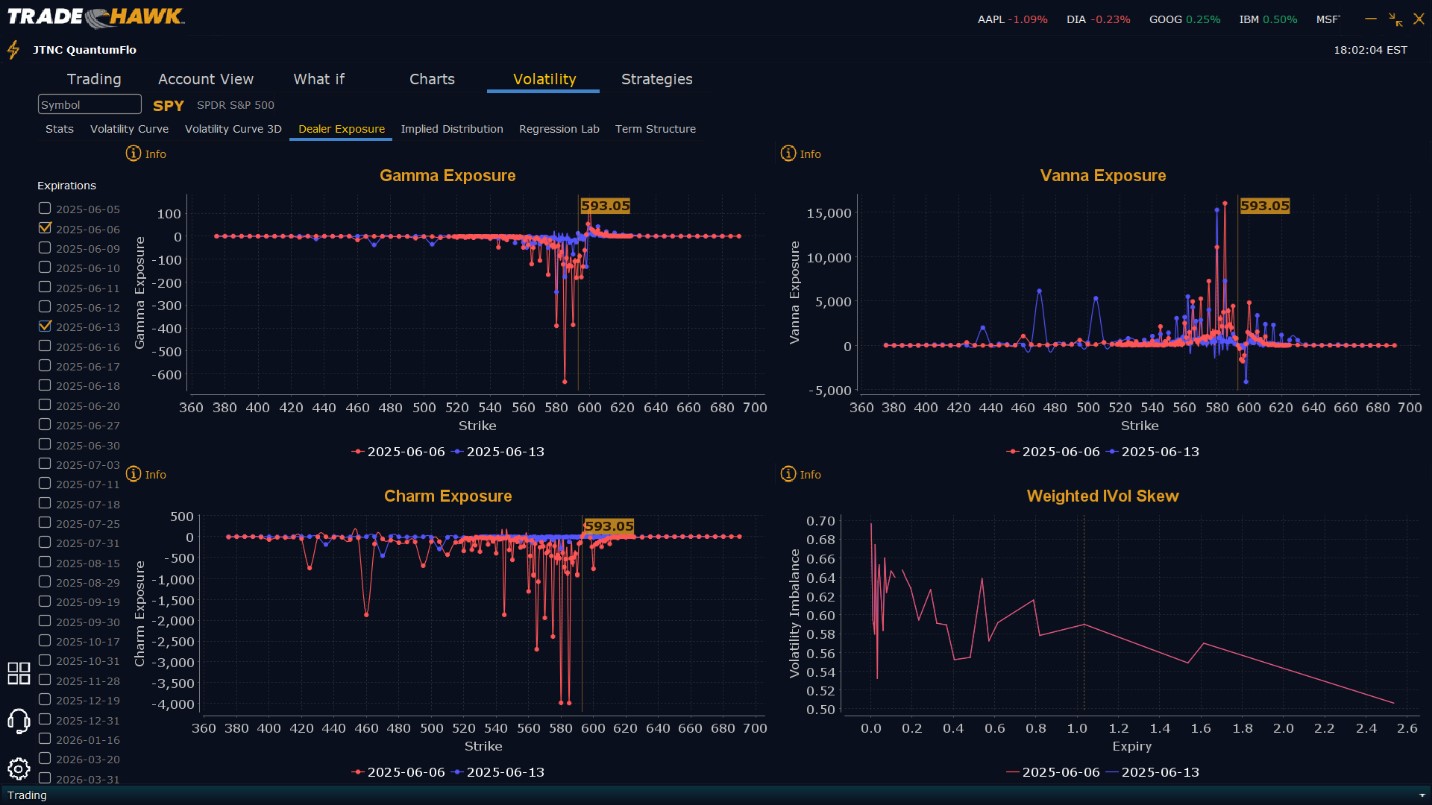
Summary of Current Dealer Positioning:
Dealers are selling SPY $598 to $610 and higher strike Calls while buying $594 to $598 Calls indicating their desire to participate in any recovery on Friday. The peak for Friday from their positioning appears to be $600 for Friday. To the downside, Dealers are buying $593 to $545 and lower strike Puts in a 3:1 ratio to the Calls they’re selling. Dealer positioning has changed from neutral to slightly bearish for Friday. Dealers are positioned to gain from prices moving with way on Friday.
Looking Ahead to Next Friday:
Dealers are selling $599 to $620 and higher strike Calls while buying very small quantities of $594 to $598 Calls, indicating the Dealers desire to participate in any continuation of the bull trend. The likely ceiling for next week is $605 but clearly Dealers are positioned for the rally to continue next week. To the downside, Dealers are buying $593 to $505 and lower strike Puts in a 3:1 ratio to the Calls they’re selling, reflecting a slightly bearish outlook for next week. Dealer positioning is unchanged from slightly bearish to slightly bearish. Dealer positioning hasn’t changed materially in several days which once again further reinforces a continuation of the bull/neutral trend. We advise reviewing Dealer positioning daily for directional clues. These positions evolve quickly and tracking them is essential for staying ahead of shifting market sentiment.
Recommendation for Traders
SPY continues to hover just above the key $590 level, with significant resistance forming at $595 and $600. Traders should prioritize long trades above $585, with upside targets at $590, $595, and potentially $600 or even $605. On the flip side, short trades may be viable on breakdowns below $585, with downside targets at $580 and $575 as well as from major resistance near $600. Volatility is rising with the VIX now at 18.48, indicating greater risk of sharp moves. Keep stops tight and size modest. Be sure to review the premarket analysis posted before 9 AM ET to adapt to any overnight developments in model projections or Dealer Positioning.
Good luck and good trading!
