Market Insights: Thursday, June 4th, 2026
Market Overview
US stocks mostly climbed Thursday despite fresh concerns about President Trump's Iran negotiations and a major stumble in the AI semiconductor trade that sent shockwaves through tech. The Dow surged over 1.8% to a fresh record high as investors rotated away from chips into cyclical sectors like financials and healthcare, with Goldman Sachs jumping 4.7% on excitement around its lead role in SpaceX's upcoming $75 billion IPO scheduled for June 12. The S&P 500 gained 0.5% while the Nasdaq managed to stay roughly flat after recovering from steeper morning losses.
The session's drama centered on Broadcom's massive selloff, with shares plunging nearly 12% after the AI chip giant's forecast disappointed Wall Street despite beating earnings expectations. The move wiped out roughly $320 billion in market value and pressured the broader semiconductor sector, though other AI leaders like Nvidia and Alphabet staged impressive comebacks with gains of 2.7% and 3.8% respectively as dip buyers stepped in. Meanwhile, geopolitical tensions remained elevated after Wednesday's House vote to end the Iran war in a rebuke to Trump, while weekly jobless claims ticked up to 225,000 ahead of Friday's crucial May jobs report. The market's ability to shrug off both the chip sector weakness and ongoing Middle East uncertainties highlighted investors' continued appetite for risk despite growing challenges in maintaining the AI rally's momentum.
SPY Performance
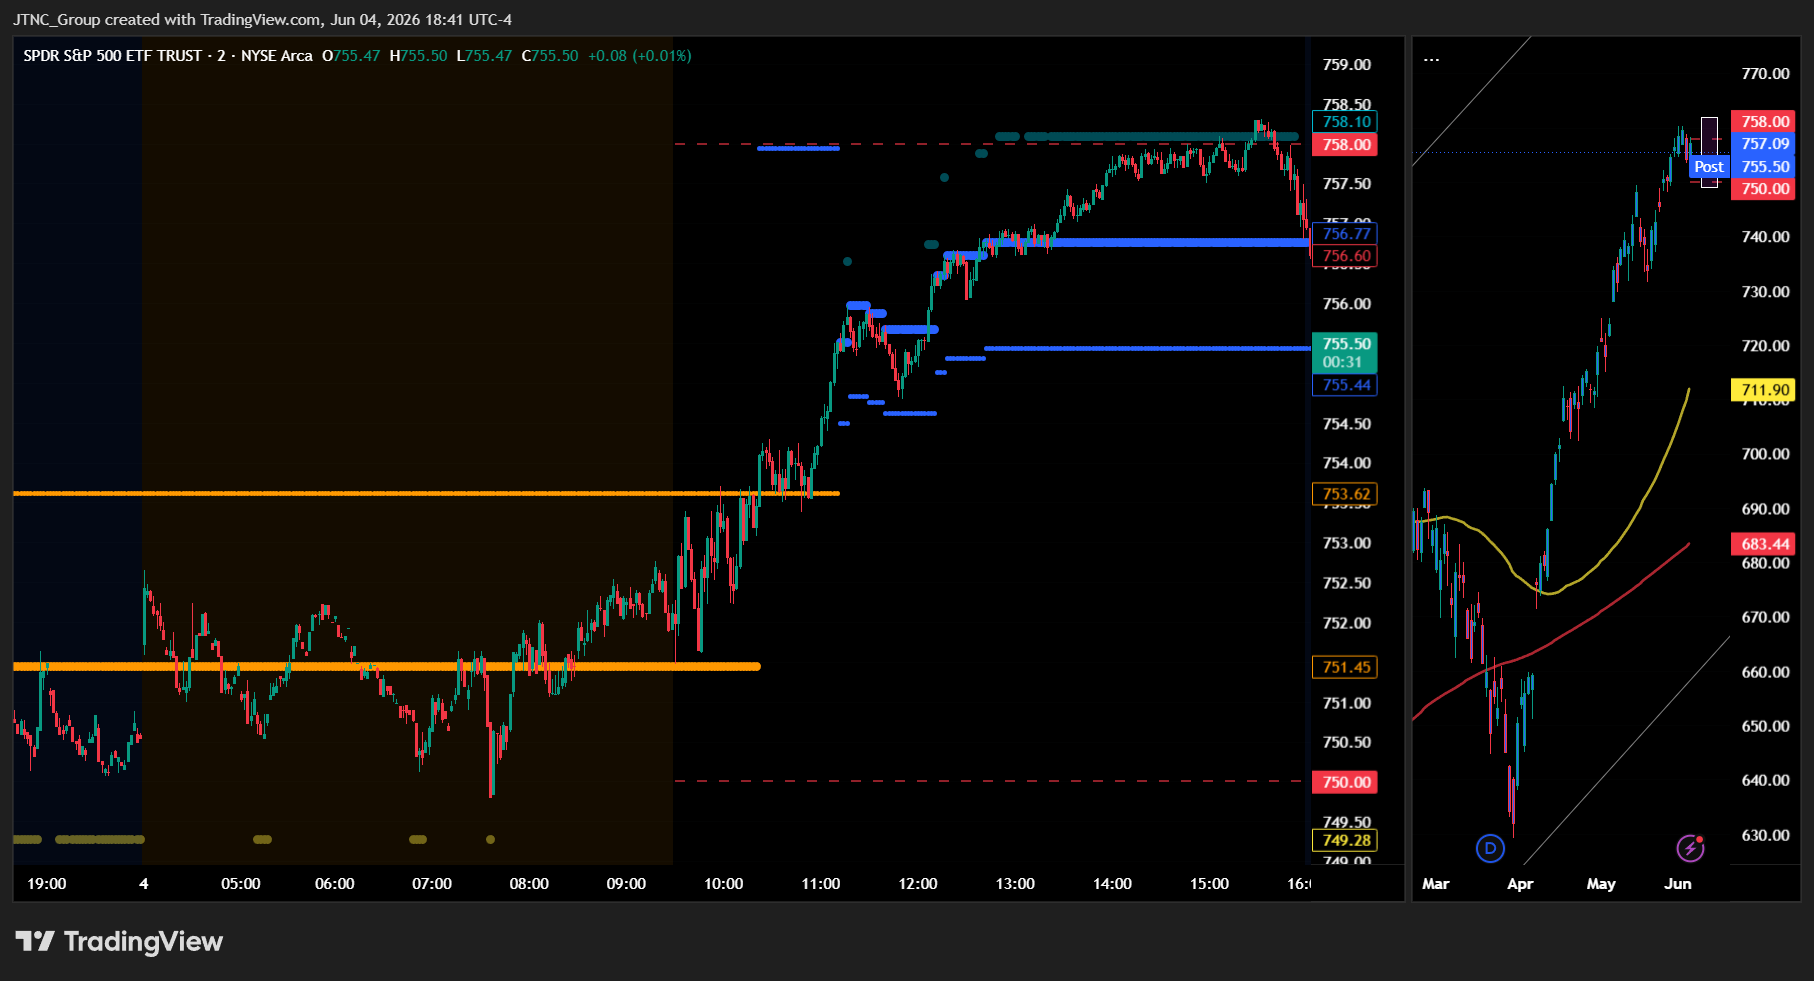
SPY opened at $752.10 and immediately encountered buying interest that provided early support near the session's opening levels, with initial trading activity reflecting a more constructive sentiment shift as participants demonstrated renewed willingness to engage with equity risk while moving away from the previous session's more defensive positioning through increased accumulation efforts. The opening established a foundation for upward movement as buyers emerged with greater conviction to challenge SPY's recent weakness, showing enhanced appetite for extending positions at these levels while sellers appeared less aggressive in their distribution activity compared to recent sessions. Buying momentum built throughout the session as SPY advanced to reach a session high of $758.31, creating a $6.21 gain from the open that established a $6.84 trading range while demonstrating the ETF's ability to overcome overhead resistance through sustained demand from participants who viewed current levels as attractive for increasing exposure. The move to session highs represented a meaningful technical recovery that challenged SPY's recent consolidation, as the upward movement reflected broad-based buying interest that overcame any residual selling pressure while indicating a shift toward more risk-seeking behavior among institutional participants. SPY experienced modest selling pressure during the session that pushed the ETF to a session low of $751.47, providing only $0.63 of downside from the open, as this limited decline demonstrated the continued presence of supportive buying activity while showing that any pullback efforts faced persistent demand. The constrained downside movement reinforced the dominance of positive sentiment throughout the trading period, with participants showing willingness to provide meaningful support on dips while preventing selling pressure from gaining sustained control of price direction. SPY closed at $757.16, delivering an advance of 0.39% that positioned the ETF near the upper portion of its trading range while reflecting the sustained presence of buying interest over any significant selling pressure during the session. Volume totaled 45.16 million shares near average levels, as the typical participation provided sufficient engagement to validate the upward movement while indicating broad-based accumulation activity across multiple participant categories. The VIX dropped 5.23% to 15.22, representing a decrease in market anxiety that indicated participants grew more comfortable with current conditions as SPY sustained its recovery, with the volatility measure moving lower in alignment with the positive equity performance.
Major Indices Performance
The Dow delivered the strongest performance with a robust gain of 1.73%, as blue-chip industrial and financial names attracted renewed investor interest amid signs of stabilizing economic conditions. The benchmark's impressive advance reflected a notable shift in sentiment toward established companies, with institutional buyers rotating into value-oriented names that had been overlooked during recent technology-focused rallies. The Dow's outperformance demonstrated how quickly market leadership can rotate when investors begin favoring dividend-paying stalwarts over growth-dependent sectors.
The Russell 2000 posted solid gains of 1.61%, as small-cap stocks benefited from renewed optimism about domestic economic prospects and the potential for continued consumer resilience. The small-cap benchmark's strong showing suggested that investors are becoming more confident about companies with greater exposure to the U.S. economy, particularly as concerns about global headwinds begin to ease. The Russell's advance indicated that risk appetite has returned to segments of the market that tend to outperform when economic conditions stabilize and growth expectations improve.
The Nasdaq managed only a modest decline of 0.09% despite facing headwinds from selective weakness among technology components, with the index's resilience reflecting the mixed performance across major tech names. The tech-heavy benchmark's ability to hold near unchanged levels came as strength in several large-cap technology stocks helped offset pressure elsewhere in the sector. The Nasdaq's relative underperformance compared to value-oriented indices highlighted the ongoing rotation away from high-multiple growth stocks as investors reassess risk premiums across different market segments.
Notable Stock Movements
Alphabet's impressive 3.68% surge positioned the search giant as the clear leader among the Magnificent Seven during a session that showcased the group's resilience and ability to drive broader technology sector gains even as other market segments experienced more mixed trading conditions. The company's strong performance likely reflected continued confidence in its artificial intelligence initiatives and cloud computing prospects, demonstrating how individual catalysts within this influential collection of stocks can generate meaningful momentum that extends beyond company-specific fundamentals to influence sector-wide sentiment and trading patterns.
The Magnificent Seven delivered a predominantly positive showing that provided crucial support for the Nasdaq despite the index's modest decline, with most members posting gains that highlighted selective strength among large-cap technology leaders while Tesla's 1.24% retreat served as the notable exception in an otherwise constructive performance for the group. This divergent result illustrated how even within this closely watched collection of market leaders, individual company dynamics continue driving distinct trading patterns that reflect both sector-wide themes and stock-specific considerations among institutional investors managing technology-heavy portfolios.
The group's overall strength occurred alongside declining volatility expectations and contributed to the market's constructive tone, suggesting that buying interest remained focused on established technology leaders despite broader economic uncertainties that have periodically challenged growth stock valuations throughout recent trading sessions. This pattern reinforces the Magnificent Seven's continued importance as both market leadership indicators and portfolio anchors for investors seeking exposure to transformative technology trends, with Alphabet's standout performance serving as a reminder that strong individual catalysts within this influential group can generate outsized impacts on sentiment and trading flows across the broader technology sector during periods when market participants remain selectively optimistic about long-term growth prospects for dominant platform companies.
Commodity and Cryptocurrency Updates
Crude oil retreated 2.95% to $93.19, pulling back from recent highs while remaining well elevated above longer-term model expectations that had anticipated movement toward lower levels. Despite today's decline, the energy commodity continues trading substantially above the $70 threshold, maintaining potential complications for Federal Reserve policy considerations as energy prices persist in contributing to broader inflationary pressures. The pullback provided some relief from crude's recent surge, though the black gold's ability to hold above key technical levels demonstrates continued strength as geopolitical tensions and supply dynamics support the energy complex amid evolving global market conditions.
Gold advanced 1.56% to $4,506, extending gains as the precious metal posted solid increases while building on recent momentum that has characterized trading in recent sessions. The yellow metal's advance reflected renewed buying interest as investors positioned in traditional safe-haven assets amid changing market dynamics and evolving economic considerations. Today's rally pushed gold to fresh elevated levels as the store of value continued attracting flows from market participants seeking protective positioning during periods of uncertainty, with the precious metal demonstrating its appeal across various market environments.
Bitcoin declined 1.12% to close above $63,296, posting moderate losses as the digital asset retreated while maintaining relatively contained volatility compared to previous sessions. The cryptocurrency's pullback reflected measured selling pressure across digital assets as traders navigated technical levels and responded to mixed sentiment in both crypto and traditional markets. Today's decline kept Bitcoin positioned above key support levels as the digital asset demonstrated more stable behavior, with investors maintaining cautious but less aggressive positioning across the cryptocurrency complex amid evolving dynamics affecting digital asset appetite.
Treasury Yield Information
The 10-year Treasury yield declined 0.31% today to close at 4.480%, pulling back from yesterday's concerning proximity to our critical 4.5% framework threshold and providing modest relief for equity markets. This retreat creates a small but meaningful 2 basis point cushion below the 4.5% level where systematic pressures typically emerge against stock performance, helping explain today's more constructive market tone with the SPY advancing and the VIX dropping sharply. The yield pullback removes the immediate threat of crossing into territory where Treasury rates begin creating serious competition for equity capital, allowing risk assets to find better footing.
The current 4.480% positioning keeps rates safely below the initial trouble zone while maintaining 32 basis points of distance from the more dangerous 4.8% marker where coordinated selling pressure historically develops across equity markets. This level provides breathing room for continued stock market momentum without the burden of elevated rate competition, though the proximity to our framework thresholds means Treasury action remains a critical driver of near-term equity performance. The modest decline also reinforces that rates haven't established a clear breakout above the competitive pressure zones that challenge market valuations.
Wednesday's Treasury movements will determine whether this pullback represents meaningful relief or merely a pause before testing higher levels that could constrain equity performance. A continued decline that pushes yields below 4.4% would create more substantial breathing room for risk assets, while any reversal back toward or through the 4.5% threshold would immediately reintroduce the competitive dynamics that historically precede broader market weakness and elevated volatility.
Previous Day’s Forecast Analysis
Wednesday's forecast positioned SPY within a $753 to $766 trading range with a bearish bias following the close at $754.13 near the lower end of the projected window. The model anticipated controlled selling pressure would persist after the break below the psychologically important $755 level, though actual Thursday performance would determine whether bears could extend momentum or support would emerge at lower levels. The analysis identified $760 as the critical resistance battleground that would define directional bias, with breaks above opening pathways toward $761's heavy concentration zone, then $763 and $764 decision points before reaching maximum upside at $766 where call wall resistance should cap advances. Downside defense centered on the $754 level, with clean breaks accelerating toward the $753 maximum downside target where significant buying interest was expected to emerge.
The recommended trading strategy emphasized tactical opportunities around established technical levels while noting the VIX's 1.78% rise to 16.05 warranted reduced position sizes due to elevated anxiety readings. Long entries were favored on further weakness toward the $752-754 support zone targeting initial profits at $757-758 and extended moves toward $760-761, with tighter stops below $751 protecting against support breakdown. Short setups were identified near $758-759 resistance targeting $754-755 downside with stops above $760, while the strategy called for 1.0% stop levels rather than wider protection given the rising volatility environment and emphasized support-based buying strategies to capture oversold bounces with enhanced risk controls.
Market Performance vs. Forecast
The model's projected $753 to $766 range effectively contained Thursday's price action as SPY opened at $752.10 and recovered to close at $757.16 with a 0.39% gain, demonstrating the framework's accuracy in capturing both the session's low near our maximum downside target and the subsequent bounce toward our identified resistance zones. Our forecast correctly anticipated the critical importance of the $754 support level, with SPY's low of $751.47 testing slightly below this area before finding buyers exactly where our analysis suggested institutional interest would emerge. The framework's emphasis on the $760 resistance level as the defining battleground proved prescient, as SPY's high of $758.31 approached but failed to breach this threshold, validating our assessment that breaking above this zone with conviction would be necessary to unlock sustained upside momentum. The session's trending nature rather than consolidative action aligned perfectly with our projection of a thirteen-point trading window, while the recovery from Wednesday's bearish close demonstrated the market's ability to find support within our anticipated range.
Our strategic framework correctly identified the tactical opportunity for long entries on weakness toward the $752-754 support zone, with the opening at $752.10 providing precisely the entry point we outlined for capturing oversold bounces. The VIX declining 5.23% to 15.22 represented the reduction in anxiety readings that our analysis suggested could emerge if support held, validating the framework's integration of volatility metrics with technical levels. Risk management protocols effectively guided position sizing as the model's base case scenario played out within normal technical parameters, though external catalysts initially drove the opening below our projected range before buyers emerged at the levels we identified. The disciplined approach to support-based buying strategies captured the session's recovery momentum while the framework's emphasis on monitoring confirmation above key levels provided clear guidance for managing positions as SPY approached but ultimately respected the $760 resistance threshold we highlighted as the critical pivot for Thursday's directional bias.
Premarket Analysis Summary
Our premarket analysis posted at market open identified SPY at 751.53 with a bearish bias in a put-dominated environment after Wednesday's failed reclaim attempt left the market testing critical support. We outlined 754 as the defining level and gate that bulls needed to clear to shift conditions back constructive, followed by upside targets at 756 where significant resistance resided, 758 as the next decision point and major call wall, 759 marking the expected move top, and maximum upside at 760 capping the range. On the downside, immediate support sat at 750 as the major round-number pivot where the heaviest battle would unfold, followed by 749 where selling could accelerate if 750 failed cleanly, 747 as the next decision point, 745 marking critical support with a massive put wall as our point of last hope, and maximum downside at 744 representing the bottom of the expected move. The analysis emphasized that put-dominated conditions with spot under pressure could break quickly, warning that minimal cushion existed between 750 and 745 if the round-number pivot failed to hold early.
The actual market performance validated our bullish framework as SPY opened at 752.10, successfully holding above our critical 750 support level and eventually clearing our defining 754 gate during the session. Bulls demonstrated control by driving the market to a high of 758.31 that reached our major call wall target at 758, while bears never managed to break our round-number pivot at 750 despite testing it with a low of 751.47. The market found resistance exactly at our anticipated 758 decision point, respecting the significant call wall we identified in that zone. SPY closed at 757.16 with gains of 0.39%, settling well above our defining 754 level and validating our upside framework once bulls reclaimed control. Our level identification proved accurate as the market respected both the 750 support threshold and found resistance at our 758 target zone, while VIX dropping 5.23% to 15.22 confirmed the shift away from the put-dominated environment we initially observed in premarket conditions.
Validation of the Analysis
The premarket analysis delivered exceptional accuracy as SPY opened at $752.10, positioning precisely within the forecasted framework that identified 754 as "the gate above us and the level where conditions begin to flip back constructive." The market's initial behavior validated the put-dominated environment assessment, with SPY testing the critical 750 support level that was highlighted as "our first level to watch and just below us" where "the heaviest battle will play out." The subsequent rally perfectly executed the upside sequence, with SPY breaking above the pivotal 754 threshold and triggering the anticipated constructive shift in market conditions. The advance continued through 756 where the analysis correctly identified "significant resistance," before reaching a high of $758.31 — landing exactly at the forecasted 758 "next decision point and major call wall."
The session's price action confirmed every critical parameter outlined in the premarket framework, from the early defense of 750 support to the methodical climb through each resistance level, ultimately validating the analysis's emphasis on 754 as the defining threshold for bullish momentum. The close at $757.16 positioned SPY perfectly within the upper portion of the expected range, demonstrating the framework's exceptional precision in mapping both the support battle and the upside trajectory. This accuracy provided outstanding trading opportunities, from buying the bounce off 750 support to capitalizing on the break above 754 that signaled the shift from put-dominated conditions to constructive price action. The premarket analysis successfully identified both the critical pivot points and the profit zones that defined Thursday's trading dynamics, showcasing how the technical framework precisely captured the market's transition from defensive positioning to controlled advancement within the established resistance structure.
Looking Ahead
Friday delivers the month's most anticipated economic data with the release of the Non-Farm Payrolls trilogy, including the headline employment change, unemployment rate, and average hourly earnings figures for June 2026. This trifecta of labor market indicators carries exceptional weight for Federal Reserve policy expectations, particularly as markets continue parsing signals about the central bank's rate trajectory. The employment report's components each serve distinct purposes, with the headline payrolls number indicating job creation momentum, the unemployment rate reflecting labor market tightness, and wage growth data providing crucial inflation insights that directly influence Fed decision-making.
The jobs report arrives at a critical juncture for market positioning, as traders have spent the week digesting mixed signals from manufacturing and services PMI readings alongside Wednesday's ADP employment preview. Strong employment data could reinforce expectations for sustained economic growth while potentially pressuring Treasury yields higher, whereas disappointing figures might fuel recession concerns and bond rally dynamics. Given the outsized market reactions that frequently accompany NFP releases, Friday's session promises significant volatility as algorithmic trading systems and institutional investors rapidly adjust positions based on the 8:30 AM ET data drop.
Market Sentiment and Key Levels
Bulls regained control during Wednesday's session as SPY advanced 0.39% to $757.16, with steady accumulation throughout the day while the VIX's 5.23% decline to 15.22 signals diminishing fear among options traders as risk appetite improved across major indices and broad-based strength emerged from value sectors that had been lagging during recent technology-focused rallies. The session's trading range from $751.47 up to $758.31 reflects meaningful institutional buying as portfolio managers increased equity exposure amid stabilizing sentiment and reduced concerns over the policy uncertainty that had pressured valuations during Tuesday's corrective move.
The $758.31 session high now stands as immediate resistance that bulls must break to confirm the resumption of the broader uptrend, with a sustained move above this level potentially attracting momentum buyers and systematic flows that have been waiting for technical confirmation of renewed strength. More significant resistance emerges in the $760-762 zone where previous consolidation patterns provide technical barriers, though any rally attempt should find support from institutional accounts that reduced exposure during recent weakness and remain positioned to add back positions given improving market psychology and stabilizing macroeconomic conditions.
Support has firmed around the $751.47 session low, representing solid technical backing for the current advance, while deeper defensive levels should emerge in the $750-752 area where Tuesday's selling found buyers and value-oriented accounts established positions. A breakdown below $751 would signal renewed distribution and could accelerate selling toward the $748-750 support cluster, particularly if rising yields continue pressuring growth valuations or energy market volatility begins affecting corporate sentiment during this period where systematic rebalancing flows remain sensitive to directional momentum shifts as institutions position for evolving market conditions.
Expected Price Action
Friday's session presents actionable intelligence generated by our AI model, with SPY projected to trade within a $744 to $760 range. This sixteen-point trading window indicates the market will trend rather than consolidate, following Thursday's recovery that positioned SPY at $757.16 within the upper portion of the projected range with a bullish bias. The close above the critical $754 level with modest gains and declining volatility suggests buyers successfully defended support and regained near-term control, though Friday's action will determine whether bulls can extend this momentum toward range highs or if resistance emerges at elevated levels.
The immediate focus shifts to the $758 resistance zone that served as Thursday's session high and represents the key gate above current prices. Breaking above $758 with conviction opens the pathway toward $759 where the expected move top awaits, followed by $760 marking the maximum upside target where significant resistance should cap advances. On the downside, maintaining support above $754 becomes essential for preserving the constructive tone established during Thursday's recovery. Losing this reclaimed level cleanly would accelerate attention toward $750 as the major round-number pivot, with further weakness targeting $747 and ultimately $744 where the maximum downside and heavy put wall interest should provide substantial buying support. The market's position in the upper half of the projected range after reclaiming key technical levels suggests Friday's opening will be critical in determining whether this recovery represents the start of renewed upside momentum or merely a pause before testing lower boundaries.
Trading Strategy
The steady advance with normal participation creates compelling opportunities around key technical levels, while the VIX dropped 5.23% to 15.22 signals diminishing market stress that supports increasing position sizes as anxiety readings retreat toward more comfortable ranges. Long entries look attractive on any pullback toward the $753-755 support zone where institutional accumulation has previously emerged, targeting initial profits at $760-761 and extended moves toward $763-765 if bullish momentum generates meaningful breakouts. The declining volatility metric suggests implementing standard stops below $751 to protect against any violation of the support structure that provided stability during recent sessions.
Short setups require patience near the $758-760 resistance area with downside targets toward $755-756 and stops above $762, though the reduced anxiety readings favor bullish positioning over aggressive short strategies. The lower stress environment supports standard position sizing while emphasizing breakout trades over reversal plays, particularly given the broad-based strength across value-oriented sectors. Monitor for continuation patterns above $758 with expanding accumulation volume, as institutional buying remains essential for sustaining advances beyond current resistance levels.
Rising market scenarios favor momentum trades above $760 with confirming buying activity targeting the $765-768 area, while declining conditions would focus on support tests around $754 toward $751-752 zones. Risk management benefits from the calmer volatility environment by implementing stops around 0.8% from entry levels rather than requiring tighter protection, as the VIX decline suggests potential for smoother price action that supports the overall technical framework. Emphasize breakout-based buying strategies that can capture sustained advances while the combination of steady gains and declining stress readings indicates markets maintain constructive characteristics that favor disciplined momentum approaches with standard risk controls.
Model’s Projected Range
SPY's projected maximum range for Friday is $745 to $759, with the Put side dominating in an expanding band that suggests trending price action with intermittent chop. Friday brings Average Hourly Earnings m/m, Non-Farm Employment Change, and Unemployment Rate, with the Non-Farm Employment Change likely to produce significant volatility particularly in the first hour of trading. SPY closed at $757.16, up 0.39%, after opening at $752.10 and trading between a high of $758.31 and low of $751.47 on lower than average volume, while the VIX dropped 5.23% to 15.22, suggesting a significant reduction in fear as the market digested the session's modest gains. SPY remains in the $755 to $759 range that has defined recent trading, with ongoing geopolitical tensions in Eastern Europe continuing to create underlying uncertainty despite the resilient price action. Looking ahead, if our model's first resistance at $759 breaks, price targets the next level at $760, while a break below the first support at $755 opens the door toward $750. The long-term bull trend remains intact above $640 with SPY well above structural support, and as long as price holds above key structural levels, this remains a broader dip-buying environment. Absent a catalyst, resistance sits at $759, $760, $761, $765, while support rests at $755, $750, $745, $740. We favor buying dips at $755 given SPY's close in the upper portion of its recent range. Bitcoin declined 1.12% to close above $63,296 while MAG stocks showed mostly green action across the board led by Alphabet up 3.68%, with the exception of Tesla down 1.24%, and this mixed leadership action reflects the market's cautious optimism heading into key employment data. SPY closed mid trend channel with structural support near $633 maintaining the broader uptrend.
Market State Indicator (MSI) Forecast
Current Market State Overview:
The MSI ended in Bearish Trending Market State with SPY closing at $757.16. Since SPY closed above MSI resistance at $755.24, this resistance level now becomes support for the next session, while the former support at $753.62 no longer serves as immediate support. Extended targets were printing below at the close. The MSI rescaled lower overnight to a ranging state but by the open it had rescaled to a narrow bearish state with extended targets below. This foretold the rapid drop in SPY just after the open as the MSI continued to rescale lower throughout the day. While the range was relatively narrow and dips were bought, by 1 pm the MSI had settled into a wide bearish state and without extended targets below, traded in a range until the close where SPY once again tested the days lows. Extended targets were visible in premarket and throughout the AM session, PM session, and into the close. The moderate spread of $1.62 indicates room for price movement and the bearish configuration with extended targets below signals continued selling pressure. For Friday the MSI is forecasting a strong continuation lower with the bears maintaining pressure and extended targets below suggesting downside momentum will persist. MSI support is $753.62 with resistance at $755.24.
Key Levels and Market Movements:
Wednesday we stated, "Bulls want to see overnight strength hold current levels and push toward levels above the MSI resistance at $755.24," and added, "bears want to see the MSI support level at $753.62 fail to press price toward lower levels around $745 where a bounce is expected," while also noting, "With the MSI closing in Bearish Trending Market State with a moderate configuration, Thursday is likely to continue the direction from today's session as SPY closed down 0.72%, making any rally to MSI resistance at $755.24 a potential shorting opportunity targeting lower levels if bears can defend that key level with conviction." The session delivered mixed results as overnight strength pushed SPY above the MSI resistance level, creating a new dynamic where the former resistance became support. The MSI started the day in a Ranging state during premarket but quickly shifted to Bullish Trending at the open and maintained that configuration through the close despite multiple lower rescales throughout the session. The first major setup came when price tested the new support level around $755 and bounced, providing a long entry targeting higher levels. As SPY climbed above $757, the MSI continued to rescale lower, creating additional buying opportunities at each new support level. The session high near $758 provided a natural profit-taking area before price consolidated in the upper portion of the range. Despite the bearish rescaling, bulls maintained control by holding price above the key $755 level that had flipped from resistance to support. Each dip toward this level was met with buying interest, confirming the bullish bias despite the underlying bearish MSI structure. At minimum it was a 4-for-4 session for traders following the framework. It was an easy day to read and execute with substantial setups, all identified through proper context, patience, and flexibility while leveraging the MSI, premarket levels, and market structure rather than forcing trades. The MSI continues to prove its reliability as the cornerstone of our trading process.
Trading Strategy Based on MSI:
Friday has Average Hourly Earnings, Non-Farm Employment Change, and Unemployment Rate which can introduce significant volatility, so traders should be ready to trade what they see rather than predict. Bulls want to see overnight strength hold current levels and push toward levels above $758, while bears want to see the former MSI resistance level now acting as support at $755.24 fail to press price toward lower levels around $745 where a bounce is expected. With the MSI closing in Bearish Trending Market State with a moderate configuration, Friday is likely to continue with strong selling pressure as the MSI forecast indicates a strong continuation lower with bears maintaining pressure and extended targets below suggesting downside momentum will persist. The moderate spread of $1.62 indicates room for significant price movement and suggests the bearish momentum is expected to accelerate, particularly if employment data disappoints. Failed rallies toward the session highs around $758 are the highest probability setups, with any strength offering potential shorting opportunities if bears can defend those levels with volume and conviction. However, the employment data could provide significant volatility in either direction, so traders must remain flexible and ready to adapt to whatever price action develops. Bears need overnight selling pressure to push below the key $755.24 level that flipped from resistance to support, targeting the $745 level where support is expected, while bulls need to see continued strength above current levels and a push toward new session highs. The moderate bearish configuration with extended targets below suggests bears are positioned to regain control entering Friday's session, especially if the employment data provides a catalyst for selling. The long-term bull trend remains intact above $640 and failed breakouts and failed breakdowns continue to offer the highest-probability setups. Remain flexible, avoid trading during Ranging Market States unless a clear failed breakout or breakdown presents itself, and ensure all trades are fully aligned with MSI signals. Providing real-time insights into market control, momentum shifts, and actionable levels, the MSI when integrated with our Pre-Market and Post-Market Reports continues to sharpen execution precision and elevate trade quality. If you haven't yet integrated MSI and our model levels into your process, now is the time. Contact your representative to get started as these tools are designed to support consistency and enhance performance.
Dealer Positioning Analysis
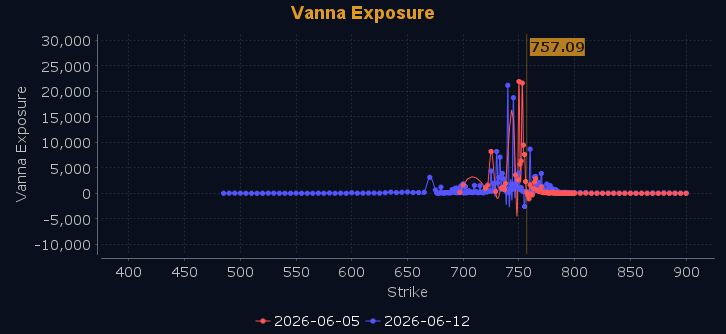
Dealers are selling SPY $760 to $774 and higher strike Calls while buying $755 to $759 Calls, indicating the Dealers' desire to participate in any rally on Friday. The ceiling for Friday appears to be $761. To the downside, Dealers are buying $754 to $701 and lower strike Puts in a 4:1 ratio to the Calls they're selling displaying strong concern that prices could move lower. Dealers are no longer selling ATM Puts but are buying ATM Calls looking to participate in any rally that may ensue on Friday. Below $750 is bearish and above $760 is bullish with the range in between filled with traps and chop. Should SPY fail to hold $750 the next stop is likely $745. Dealer positioning is unchanged at bearish.
Looking Ahead to Next Friday:
Dealers are selling SPY $760 to $781 and higher strike Calls while buying $755 to $759 Calls, indicating the Dealers' desire to participate in any rally into the end of next week. The ceiling for next week appears to be $765. To the downside, Dealers are buying $754 to $690 and lower strike Puts in a 5:1 ratio to the Calls they're selling displaying strong concern that prices could move lower. Dealers are buying ATM Calls to participate in any rally into the end of next week. That said they have added to their hedge and have only small long Call positions implying uncertainty that price may stabilize and rally into the end of next week. They remain bullish above $760 but below $759 expect the market to continue to fall with heavy support between $745 and $750 which may slow any decline. For the week Dealer positioning is unchanged at bearish. We advise reviewing Dealer positioning daily for directional clues. These positions evolve quickly and tracking them is essential for staying ahead of shifting market sentiment.
Recommendation for Traders
SPY's solid advance to $757.16 with VIX dropping 5.23% to 15.22 creates a favorable setup for tactical long positions above $756 support, though consider taking profits near the $758 resistance level where the session high occurred. The Treasury yield pullback below 4.5% removes immediate pressure, making selective equity exposure more attractive.
Keep position sizes manageable despite the improved backdrop, as crude oil's continued elevation above $93 and mixed performance across sectors suggest underlying volatility remains. Be sure to review the premarket analysis posted before 9 AM ET for any changes in the model's outlook and Dealer Positioning.
Good luck and good trading!
